 Open Access Article
Highly efficient degradation of high-loaded phenol over Ru–Cu/Al2O3 catalyst at mild conditions†
Lihong Hua,
Xianrong Liua,
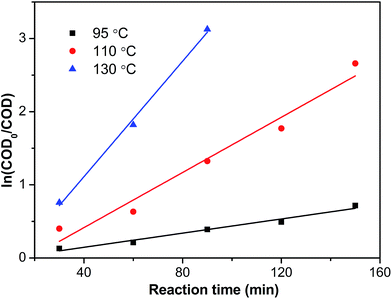
Qiangxin Wangc and
Yanling Zhou *ab
*ab
aSchool of Chemistry and Chemical Engineering, Guangxi University, Nanning, 530004, PR China. E-mail: zyl8289@126.com
bGuangxi Experiment Centre of Science and Technology, Guangxi University, Nanning, 530004, PR China
cZhangjiagang Entry-Exit Inspection and Quarantine Bureau, Zhangjiagang, 215600, PR China
First published on 18th April 2017
Abstract
Ru–M/Al2O3 (M = Cu, Fe, Co, Ni, Mn, Zn, Ag, La and Ce) catalysts were prepared using the co-impregnation method and assessed for catalytic wet oxidation of highly concentrated phenol under mild conditions. The results showed that the Ru–5Cu/Al2O3 (the loading of Cu was 5 wt%) catalyst, especially, had the highest catalytic activity in degradation of phenol with chemical oxygen demand (COD) removal achieved at 95.8% after a 2 h reaction at 130 °C, 0.8 MPa oxygen pressure and an initial COD concentration of 23![[thin space (1/6-em)]](https://www.rsc.org/images/entities/char_2009.gif) 000 mg L−1 (the concentration of phenol was about 10 g L−1). In order to confirm the structure and properties of Ru-based catalysts, the samples were characterized by BET, TG-DSC, XRD, XPS, TPR and TEM techniques. In addition, the influence of different parameters on phenol degradation efficiency was examined and the reaction kinetics were investigated. Hence, the Ru–5Cu/Al2O3 catalyst showing the highest activity might be owing to a synergetic effect between the Ru and Cu species and good dispersion of Ru. The main cause of Ru–5Cu/Al2O3 deactivation was the coke deposit covered active sites, but it was easily regenerated by calcination.
000 mg L−1 (the concentration of phenol was about 10 g L−1). In order to confirm the structure and properties of Ru-based catalysts, the samples were characterized by BET, TG-DSC, XRD, XPS, TPR and TEM techniques. In addition, the influence of different parameters on phenol degradation efficiency was examined and the reaction kinetics were investigated. Hence, the Ru–5Cu/Al2O3 catalyst showing the highest activity might be owing to a synergetic effect between the Ru and Cu species and good dispersion of Ru. The main cause of Ru–5Cu/Al2O3 deactivation was the coke deposit covered active sites, but it was easily regenerated by calcination.
1. Introduction
Nowadays, the increasing growth of the population and industrial developments cause serious water pollution with various organic compounds. Industrial organic pollutants are not allowed to be directly discharged and must pass emission standards. Phenols act as an important precursor for production of chemicals and closely correlate with industrial applications. Phenol biodegrades slowly in the environment and is extremely toxic, teratogenic and refractory in nature, especially for highly concentrated phenol.1 A number of technologies, including electrocatalysis,2 photocatalytic degradation,3,4 microwave and ultrasound methods,5 catalytic ozonation,6,7 and catalytic wet oxidation (CWO)1,8–10 have been developed for elimination of phenol. The methods of photocatalysis, ozonation and electrocatalysis are only suitable to eliminate wastewater with low-loaded organic compounds.11Catalytic wet oxidation exhibits advantages for treatment of organic compounds and has gained much attention due to its high degradation efficiency.12 The addition of a suitable catalyst to the wet air oxidation system can not only decrease the operation conditions but also accelerate the reaction rate and shorten the reaction time. However, homogenous catalysis has disadvantages, it is difficult to recover the catalysts, which results in secondary pollution. The key issue of the CWO process is the availability of an effective catalyst that can work under mild conditions. A diversity of solid catalysts, such as transition metals,10,13–15 noble metals,16–18 and carbon materials,19,20 have been applied to degradation of phenol aqueous solutions. The supported Ru catalyst presented excellent catalytic performance and stability in elimination of phenol pollutants.18,21–23 The single noble metallic Ru catalyst has high cost, and it is necessary to add a secondary metal to the Ru catalyst. Actually, transition metals have been used as promoters to enhance the catalytic performance of precious metal catalysts.24,25 Therefore, it can be expected that the combination of noble and suitable transition metals would adjust the reactivity of the surface oxygen and improve metal dispersion, thus giving rise to much better catalytic activity for elimination of the organic contaminants while significantly reducing the amount of noble metals in catalysts. In previous literature, most catalysts are either single noble,26,27 transition,28,29 bi-noble,30,31 or bi-transition metals,1,15,32 while noble-transition metals were rarely used together for CWO of organic compounds.
The aim of this study was to explore a high activity and stability catalyst with low Ru loading for degradation of high-loaded phenol under relatively mild conditions. The Ru-based catalyst was modified by addition of different transition metals (Cu, Fe, Co, Ni, etc.), where Cu was the best prospective additive species. We obtained a highly efficient Ru–5Cu/Al2O3 catalyst with much lower Ru loading for mineralization of phenol. According to our knowledge, such bimetallic Ru–Cu catalysts for catalytic degradation of organic pollutants have not been reported yet in the literature. The Ru-based catalysts were thoroughly characterized using N2 adsorption/desorption, TG/DSC, XRD, XPS, H2-TPR and TEM techniques. The influences of oxygen pressure and temperature on the COD removal of phenol were examined. Finally, the investigation of the reaction kinetics and life span of the Ru–5Cu/Al2O3 catalyst was conducted.
2. Experimental
2.1. Catalysts preparation
Ru catalysts on various supports were prepared by the impregnation method using an aqueous solution of RuCl3 as a precursor. Al2O3, SiO2, ZrO2, MgO, TiO2, Al2O3–TiO2-1 (the mass ratio of Al2O3 to TiO2 = 1![[thin space (1/6-em)]](https://www.rsc.org/images/entities/char_2009.gif) :
:![[thin space (1/6-em)]](https://www.rsc.org/images/entities/char_2009.gif) 1, denoted as Al–Ti-1) and Al2O3–TiO2-2 (the mass ratio of Al2O3 to TiO2 = 7
1, denoted as Al–Ti-1) and Al2O3–TiO2-2 (the mass ratio of Al2O3 to TiO2 = 7![[thin space (1/6-em)]](https://www.rsc.org/images/entities/char_2009.gif) :
:![[thin space (1/6-em)]](https://www.rsc.org/images/entities/char_2009.gif) 3, denoted as Al–Ti-2) were treated as supports. The mixture was left stirring for 2 h and then the suspension was sonicated for 1.5 h at ambient temperature. After impregnation for 12 h, all the catalysts were dried at 100 °C overnight. In the next step, the samples were introduced into a tubular quartz reactor and reduced under flowing pure hydrogen at 400 °C for 4 h. Cu/Al2O3 (Cu = 5 wt%) was also prepared by the impregnation method. The loading amount of Ru was 1 wt% for all catalysts. Ru–M/Al2O3 (M = Cu, Fe, Co, Ni, Mn, Zn, Ag, La and Ce) catalysts were prepared by the co-impregnation method with a mixed aqueous solution of metal precursors. The Cu/Al2O3 and bimetallic catalysts were prepared through a procedure similar to the above. The secondary metal precursors were Cu(NO3)2·3H2O, Fe(NO3)3·9H2O, Co(NO3)2·6H2O, Ni(NO3)2·6H2O, 50% Mn(NO3)2 aqueous solution, Zn(NO3)2·6H2O, AgNO3, La(NO3)2, and Ce(NO3)2·6H2O.
3, denoted as Al–Ti-2) were treated as supports. The mixture was left stirring for 2 h and then the suspension was sonicated for 1.5 h at ambient temperature. After impregnation for 12 h, all the catalysts were dried at 100 °C overnight. In the next step, the samples were introduced into a tubular quartz reactor and reduced under flowing pure hydrogen at 400 °C for 4 h. Cu/Al2O3 (Cu = 5 wt%) was also prepared by the impregnation method. The loading amount of Ru was 1 wt% for all catalysts. Ru–M/Al2O3 (M = Cu, Fe, Co, Ni, Mn, Zn, Ag, La and Ce) catalysts were prepared by the co-impregnation method with a mixed aqueous solution of metal precursors. The Cu/Al2O3 and bimetallic catalysts were prepared through a procedure similar to the above. The secondary metal precursors were Cu(NO3)2·3H2O, Fe(NO3)3·9H2O, Co(NO3)2·6H2O, Ni(NO3)2·6H2O, 50% Mn(NO3)2 aqueous solution, Zn(NO3)2·6H2O, AgNO3, La(NO3)2, and Ce(NO3)2·6H2O.
2.2. Catalytic tests
The experiments were carried out in a 100 mL autoclave equipped with a magnetically driven stirrer. In a typical run, the reactor was loaded with 30 mL of phenol aqueous solution (initial COD, 23![[thin space (1/6-em)]](https://www.rsc.org/images/entities/char_2009.gif) 000 mg L−1, and a concentration of phenol of about 10 g L−1) and 0.3 g of catalyst. When the mixture was heated to the desired temperature under stirring, a certain amount of pure oxygen gas was admitted into the reactor. This time was taken as zero time. After a period of reaction time, the reactor was cooled down to room temperature immediately and the liquid phase products were separated from the catalyst by centrifugation. The COD concentration of the reaction mixture was analyzed by a spectrophotometric method using a 5B-3B COD analyzer. The COD concentration was chosen as the mineralization index to characterize the phenol degradation.
000 mg L−1, and a concentration of phenol of about 10 g L−1) and 0.3 g of catalyst. When the mixture was heated to the desired temperature under stirring, a certain amount of pure oxygen gas was admitted into the reactor. This time was taken as zero time. After a period of reaction time, the reactor was cooled down to room temperature immediately and the liquid phase products were separated from the catalyst by centrifugation. The COD concentration of the reaction mixture was analyzed by a spectrophotometric method using a 5B-3B COD analyzer. The COD concentration was chosen as the mineralization index to characterize the phenol degradation.
The method of catalyst reuse was as follows: the reactions were carried out simultaneously in the same autoclave under the same conditions. The used catalyst was collected by filtration, washed with ethanol and distilled water or further calcinated at 500 °C for 4 h. The loss of catalyst during the recovery process was neglected in the next run. The amount of leaching of the metal into the reaction solution was detected by inductively-coupled plasma optical emission spectrometry (ICP-OES).
2.3. Analysis techniques
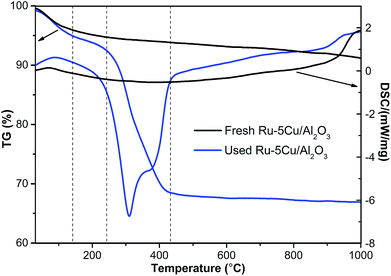
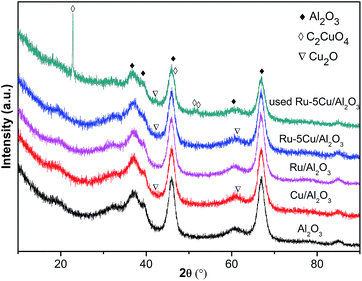
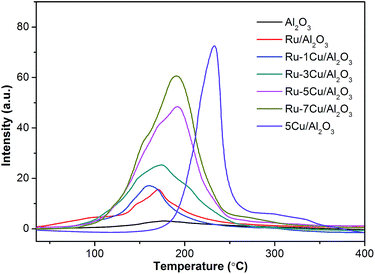
The surface area of the samples was measured using the BET method with a Micromeritics ASAP 2020 N2 adsorption/desorption instrument. The samples were heated at 150 °C for 4 h under vacuum and measured using nitrogen adsorption at −196 °C. In order to measure the amount of coke deposition on the spent catalyst, thermogravimetric analysis of the samples was conducted with a NETZSCH STA449F3 thermogravimetric differential scanning calorimetry (TG-DSC) simultaneous thermal analyzer. The temperature was increased from room temperature to 1000 °C under flowing air with a heating rate of 10 °C min−1. The X-ray diffraction (XRD) pattern was recorded using a PANnalytical X’pert PRO diffractometer using Cu Kα (λ = 1.54 Å, 50 kV, 60 mA) radiation as the X-ray source. The scanning range was 2θ = 10–90° with a step size of 0.02°. The X-ray photoelectron spectroscopy (XPS) data of the catalysts were obtained using a ThermoFisher Scientific ESCALAB 250Xi spectrometer. The sample was analyzed at 5 × 10⁻¹⁰ mbar using C 1s (284.6 eV) as a reference for the binding energies. Transmission electron microscopy (TEM) analysis of samples was carried out using a FEI TECNAI G2 TF20 instrument. Before testing, the samples were dispersed by a sonicator in ethanol, followed by laying the suspension onto Cu grids. The reducibility of the catalysts was determined by hydrogen temperature programmed reduction (H2-TPR) using a Builder PCA-1200 instrument of chemical adsorption analysis with a thermal conductivity detector (TCD). The weight of sample in a typical experiment was about 100 mg. H2-TPR experiments were performed in a U-shape quartz reactor, heated in pure Ar at 300 °C for 30 min with a heating rate of 10 °C min−1 and then cooled down to room temperature under Ar. After pretreatment, the H2-TPR experiments were carried out by passing a 5% H2/Ar (30 mL min−1) stream through the catalyst. The temperature was increased from 30 °C to 500 °C at a linearly programmed rate of 10 °C min−1. The leaching of metal ions was measured by ICP-OES using Agilent 725-ES equipment.3. Results and discussion
3.1. Catalyst optimization for degradation of phenol
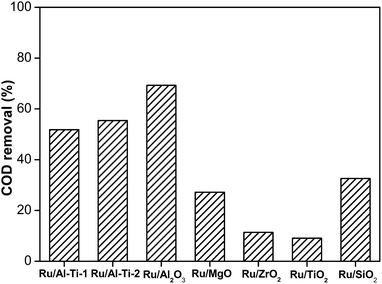
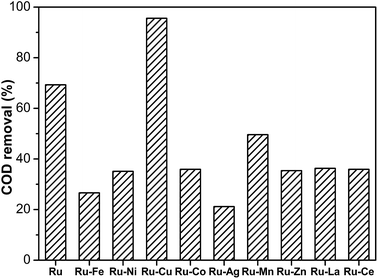
Firstly, the effect of supports for Ru catalysts without additives was investigated in degradation of phenol. In the experiments, the operating conditions were as follows: a temperature of 130 °C and an oxygen pressure of 1.6 MPa. The reaction time was set to 2 h. Fig. 1 shows the influence of supports on the COD removal from phenol. The Ru/Al2O3 catalyst showed the highest catalytic activity with 69.3% COD conversion, which might be due to its largest surface area of 215 m2 g−1. The Ru/Al–Ti-2 and Ru/Al–Ti-1 catalysts exhibited similar COD conversion, which was lower than that of Ru/Al2O3. The activities of the Ru/ZrO2 and Ru/TiO2 catalysts were very low and the COD removals were only 11.4% and 9.0%, respectively. In previous studies, the supports played important roles in the catalytic activity of catalysts.33,34 The properties of different supports, such as the surface area, types and shape of the pores, degrees of porosity, diameter of the pores, and the acidity had to be considered. Considering the degradation efficiency, Al2O3 was selected as the support in the following study.In the next study, the Ru/Al2O3 catalyst was modified by further loading of secondary metals. The loading amount of the secondary metal was 5 wt% as the weight of Al2O3. The modification of supported Ru catalysts with secondary metals is often effective in degradation of organic compounds.22,35,36 The performance of Ru–M/Al2O3 catalysts is shown in Fig. 2. The Ru–Cu/Al2O3 catalyst exhibited the highest performance compared to Ru/Al2O3 and other bimetallic Ru-based catalysts. None of the metal-modified Ru-based catalysts showed better catalytic activity except for the Ru–Cu/Al2O3 catalyst. The removal of COD was increased from 69.3% to 95.6% by addition of 5 wt% Cu species to the Ru–based catalyst. The addition of a first-row transition metal, Ag or a rare-earth metal did not enhance activity, but suppressed the performance of Ru catalysts. The degradation efficiencies of the Ru–Fe/Al2O3 and Ru–Ag/Al2O3 catalysts were very low with 26.6% and 21.2% COD removal, respectively. The kind of additive played an important role in the catalytic activity of Ru catalysts. Only adding a suitable promoter could improve the performance of the Ru-based catalyst.
The effect of Cu loading amount on the catalytic performance of bimetallic Ru–Cu catalysts was investigated (Fig. 3). The activity of the bimetallic Ru–Cu/Al2O3 catalysts was obviously higher than that of the monometallic Ru/Al2O3 catalyst. When the Cu loading amount increased from 1 wt% to 5 wt%, the removal efficiency was gradually improved and achieved 95.6% COD removal, however, the degradation efficiency was slightly increased by further increasing the Cu loading. The excessive amounts of Cu additives might cover the active sites or gather into large particles, resulting in a small increase of the activity. It was confirmed that the monometallic Cu/Al2O3 catalyst had low activity with only 19.0% COD removal. Considering the activity and economy, Ru–5Cu/Al2O3 was selected for this study.
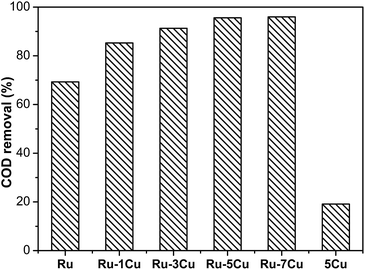 | ||
| Fig. 3 Degradation of highly concentrated phenol over Ru, using a Ru–mCu (where m was the mass percentage content) and Cu catalyst (130 °C, 1.6 MPa, 2 h). | ||
3.2. Catalysts characterization
Table 1 lists the texture parameters of the carrier and Ru-based catalysts. The Al2O3 support had a specific surface area of 189.8 m2 g−1 and a total pore volume of 0.45 cm3 g−1. The Ru-based catalysts showed that the pore volume and pore size were lower than those of the Al2O3 support. The pore volume and surface area dropped with the increase in the Cu loading for the Ru-based catalysts. However, the catalysts had larger surface area than Al2O3. This indicated that the metal particles did not block pores but attached to the support and pore surfaces. The used Ru–5Cu/Al2O3 catalyst exhibited lower pore volume and pore size compared with fresh Ru–5Cu/Al2O3. It was reasonable that the loss of the pore volume and pore size of the used Ru–5Cu/Al2O3 was probably attributed to the deposition of the carbonaceous materials on the pore surface.
| Sample | Surface area (m2 g−1) | Pore volume (cm3 g−1) | Pore size (nm) |
|---|---|---|---|
| Al2O3 | 189.8 | 0.45 | 9.4 |
| Ru/Al2O3 | 215.0 | 0.43 | 8.1 |
| Ru–1Cu/Al2O3 | 206.7 | 0.41 | 8.0 |
| Ru–3Cu/Al2O3 | 203.5 | 0.41 | 8.1 |
| Ru–5Cu/Al2O3 | 190.1 | 0.36 | 7.5 |
| Used Ru–5Cu/Al2O3 | 197.6 | 0.20 | 4.0 |
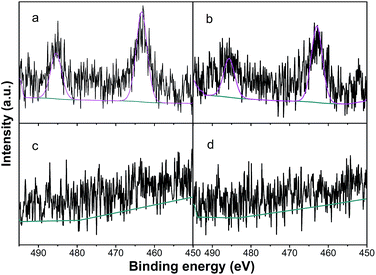
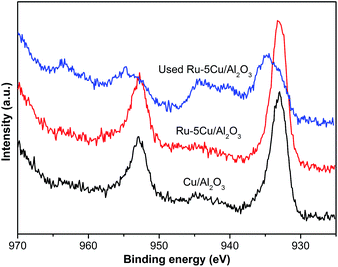
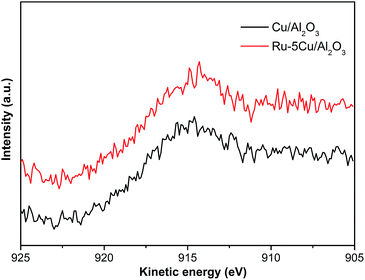
The Cu 2p spectra of Cu/Al2O3, Ru–5Cu/Al2O3 and used Ru–5Cu/Al2O3 are displayed in Fig. 7. For Cu/Al2O3 and Ru–5Cu/Al2O3, the peaks at 933.0 eV and 952.6 eV were assigned to Cu 2p3/2 and Cu 2p1/2, which was attributed to the presence of Cu2O.41 However, the binding energy of Cu 2p for Cu2O and Cu was almost the same, and then the Cu LMM Auger analysis was conducted. In the Cu LMM Auger spectra of both of the fresh catalysts (Fig. 8), the kinetic energy signal at 915.6 eV was ascribed to the Cu(I) species.42 In the Cu/Al2O3 catalyst, the binding energy of Cu 2p3/2 was 933.0 eV, and yet in the Ru–5Cu/Al2O3 catalyst, it was shifted to a high binding energy at 933.3 eV due to the fact that some electrons were transferred to Ru. There were significant differences in the Cu species on the surface of the fresh and used Ru–5Cu/Al2O3 catalysts (Fig. 7). The broadened peak at 940–945 eV in the used catalyst could be corresponded to CuO.43 In addition, the main Cu 2p3/2 peak was broadened and asymmetric for the spent catalyst, suggesting that the Cu species existed in the form of Cu2O and CuO and a part of Cu2O converted to CuO during reaction. The degradation process was operated at 130 °C and 0.8 MPa oxygen pressure, therefore, the Cu2O species were easily oxidized into CuO species. Comparing the used and fresh Ru–5Cu/Al2O3, the intensity of the Cu 2p peaks was also decreased in CWO of organics on account of coke deposition on the catalyst surface, which was in agreement with the Ru 3p (Fig. 6), Ru 3d (Fig. S3†) and XPS survey (Fig. S4†) results.
The XPS O 1s spectra of the Ru/Al2O3 and Ru–5Cu/Al2O3 catalysts exhibited a similar shape, a single-loaded envelope, and were asymmetric indicating that different oxygen types existed on the catalyst surface (Fig. S5†).44,45 Each peak would be fitted for two species (OI and OII), referred to as the lattice oxygen and non-lattice oxygen, respectively.44 The OI with binding energy of 531.2 eV was attributed to the lattice oxygen of Al2O3,46 while the OII with binding energy of around 532.0 eV was characteristic of the non-lattice oxygen of catalysts.44,45 The O 1s XPS data are listed in Table 2. It could be found that the Ru–5Cu/Al2O3 catalyst had more non-lattice oxygen content than Ru/Al2O3.
| Sample | Binding energy (eV) | O/OT (%) | ||
|---|---|---|---|---|
| OI | OII | OI/OT | OII/OT | |
| Ru/Al2O3 | 531.2 | 532.3 | 70.7 | 29.3 |
| Ru–Cu/Al2O3 | 531.1 | 531.9 | 63.9 | 36.1 |
3.3. Performance of the Ru–5Cu/Al2O3 catalyst
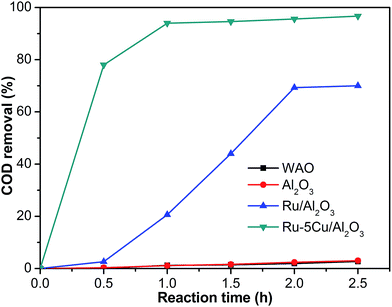
The activity of the Ru–5Cu/Al2O3 catalyst in degradation of phenol (about 10 g L−1) was evaluated at a reaction temperature of 130 °C and an oxygen pressure of 1.6 MPa. In most literature, CWO of low concentration phenol (1–2.1 g L−1) usually requires high temperatures (150–180 °C) and oxygen pressures (1.4–2.0 MPa).8,9,13,16,17 The activity curves of the Ru/Al2O3 and Ru–5Cu/Al2O3 catalysts are displayed in Fig. 11. At zero time, the degradation of COD could almost be neglected before admitting oxygen into the reaction system, suggesting that the oxygen had a great influence in degradation of phenol. In WAO of phenol in the absence of catalyst, the COD was not obviously converted with only 2.7% removal after 2.5 h. The carrier almost had little activity with COD removal similar to the WAO reaction. Apparently, the presence of the Ru–5Cu/Al2O3 catalyst led to significant enhancement of the COD removal efficiency as compared to the WAO and oxidation with Ru/Al2O3. COD degradation efficiencies as high as 94.0% and 96.7% could be reached within 1 h and 2.5 h, respectively. Only 70.0% of COD removal was achieved after a 2.5 h run over the Ru/Al2O3 catalyst, which was lower than that of the Ru–5Cu/Al2O3 catalyst after 0.5 h reaction (78% COD removal). These results indicated that the addition of Cu significantly enhanced the performance of the Ru-based catalyst. There was a synergetic effect between Ru and Cu during the oxidation possess. The Cu species mainly acted as the catalyst accelerator to improve the performance of the Ru-based catalyst.The oxygen pressure is an important factor toward the degradation of organic compounds.49–52 This effect might be related to the availability of oxygen to the catalyst surface and concentration of oxygen dissolved in the liquid phase. The amount of dissolved oxygen is proportional to its partial pressure in the gas phase, according to Henry’s law. Therefore, sufficient oxygen pressure is beneficial to promotion of the free-radical and oxidation of the organic pollutant.50 Increasing the reaction pressure improves the likelihood that the reactants will interact with each other, and thus increases the rate of the reaction. Additionally, the stoichiometric amount of oxygen was calculated from reaction (1). In theory, phenol was completely decomposed into CO2 and H2O under the reaction conditions corresponding to 0.67 MPa oxygen.
| C6H6O + 7O2 → 3H2O + 6CO2 | (1) |
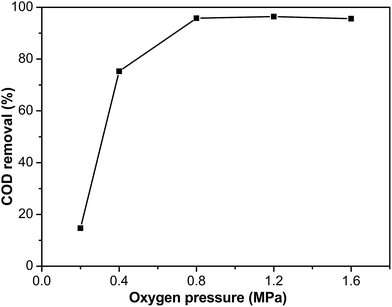
The effect of the oxygen pressure was investigated using Ru–5Cu/Al2O3. The experiments were conducted under oxygen pressures ranging from 0.2 to 1.6 MPa at 130 °C for 2 h reaction (Fig. 12). The degradation efficiency improved with increasing oxygen pressure. This effect was noticeable when the pressure increased from 0.2 to 0.8 MPa, which resulted from the solubility of oxygen in the solution increasing with the oxygen partial pressure increasing. While the difference between 0.8 and 1.6 MPa was insignificant, this could be attributed to the concentration of oxygen in the liquid phase reaching saturation.51 The oxygen diffusion to the catalyst surface was not limiting the rate anymore and the CWO of phenol was transformed from under oxygen diffusion control to kinetic control when the oxygen pressure exceeded 0.8 MPa.52 When the oxygen pressure was below 0.8 MPa, the rate for elimination of phenol was first order with respect to the oxygen pressure. Above this limit, the removal of phenol was zero order with respect to the oxygen pressure. In order to achieve total mineralization of phenol, 0.8 MPa was a suitable oxygen pressure. Under higher oxygen pressure, the dissolved oxygen increased and was beneficial to formation of reactive oxidation species.11 The higher oxygen pressure could accelerate the reaction rate and achieve higher removal efficiency.
In the CWO of organic compounds, reaction temperature is also a significant parameter affecting the catalytic oxidation of organic compounds.50–53 It is necessary to investigate the influence of this factor on the CWO reaction. Usually, increase in temperature is accompanied by increase in the pollutant removal and reaction rate. The temperature is a measure of the kinetic energy of a system, so higher temperature implies higher average kinetic energy of the molecules and more collisions between the pollutants and catalyst. Usually, conducting the reaction at a higher temperature delivers more energy into the system and increases the reaction rate by causing more collisions between the particles, in accordance with collision theory.
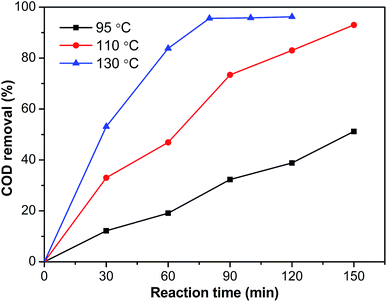
The influence of the reaction temperature on elimination of phenol was studied within the temperature range of 95 °C to 130 °C. Fig. 13 showed the evolution of COD removal from phenol over the Ru–5Cu/Al2O3 catalyst. As expected, because the reaction rate increased with temperature, the COD removal was increased rapidly as the temperature increased. Under 130 °C and 0.8 MPa oxygen pressure, COD removal could reach 95.6% after 80 min reaction time, while the elimination efficiency was only 73.4% after 90 min at 110 °C. The reaction progressed rather slowly at 95 °C taking over 2.5 h to reach 51.2% COD removal. During oxidation of phenol, a small amount of intermediate was produced.28 Then the concentration reached maximum and plateaued because the short chain organics formed from phenol oxidation were relatively stable and refractory to further oxidation into CO2 and H2O.54 Higher temperature resulted in formation of less recalcitrant intermediate products.
3.4. Reaction kinetics
It was necessary to investigate the kinetics of CWAO of organics in order to understand the reaction rate during oxidation. In some previous studies, the concentration of the organic reactant was treated as a kinetic parameter.53–55 During catalytic oxidation of phenol, the process is very complex and generated a variety of intermediate products. Therefore, it is impossible to perform a detailed analysis of the individual compounds. To study the complicated oxidation procedure, the collective parameter has been used to study the rate of reaction.12,51,56,57 An approximated investigation could be carried out in terms of the concentration of COD. The reaction rate equation can be presented as follows:
 | (2) |
| r = k1[COD]a | (3) |
The reaction could be simplified to a pseudo-first-order reaction, and the rate of COD removal was described as follows:
 | (4) |
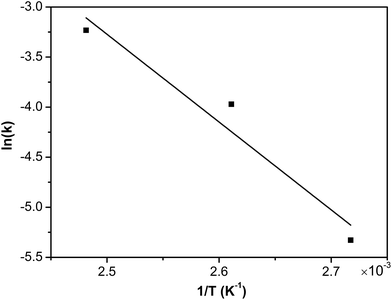
Consequently, assuming that the empirical kinetic constants followed the Arrhenius dependence on temperature, the apparent activation energies were conveniently determined. The rate constant k1 is related to the temperature T according to the Arrhenius equation:
ln![[thin space (1/6-em)]](https://www.rsc.org/images/entities/char_2009.gif) k1 = ln k1 = ln![[thin space (1/6-em)]](https://www.rsc.org/images/entities/char_2009.gif) A − (Ea/RT) A − (Ea/RT)
| (5) |
3.5. Reaction mechanism
The mechanism of phenol oxidation cannot be established on the basis of the data obtained in this study. Based on the activation energy of 72.9 kJ mol−1, the CWO of the phenolic compounds was relevant to the radical reaction.60 Also, according to previous studies, the mechanism of catalytic oxidation of wastewater of phenol was a free radical process.50,61,62 Several free radical reactions consisting of initiation, propagation, and termination of free radicals have been proposed to take place during WAO of various organic compounds.63 In general, the free radicals included superoxide ions (O2˙−), hydroxyl radicals (OH˙) and hydroperoxyl radicals (HO2˙), which were all strong oxidation species in aqueous solutions.11,61 The rate of degradation of the organic compounds was determined by the formation of the reactive oxygen species. This was conducive to generating free radicals under higher oxygen pressure and temperature. A certain number of transition metals can activate O2 via reaction.64 With molecular oxygen, the formation of hydroxyl radicals is quite improbable but superoxide radicals could be catalytically produced by the metal species according to the following equation:| Mn+ + O2 → M(n+1)+ + O2˙− | (6) |
Ru(3+/4+) and Cu(2+/1+) species are known to be good candidates for catalyzing the reaction. The redox potential of the M(n+1)+/Mn+ couple is a main factor in the promotion of oxidation. As the hydroperoxyl radical is the acid form of the superoxide radical ion:
| O2˙− + H+ = H2O˙ | (7) |
It has been reported that heterogeneous catalysts are capable of initiating free radicals.1 Moreover, the catalyst could directly activate the reactant molecules, facilitating their decomposition into radicals, or accelerate the decomposition into radicals with hydroperoxides formed in a radical chain mechanism. The synergetic effect between the Ru and Cu species was important to promote the production of radicals of the Ru–5Cu/Al2O3 catalyst. The catalytic cycle can be introduced through the following reduction–oxidation reactions:62,63
| PhOH + Ru4+ → PhO˙ + Ru3+ + H+ | (8) |
| Ru3+ + O2 → Ru4+ + O2˙− | (9) |
| Cu+ + O2 → Cu2+ + O2˙− | (10) |
| PhOH + HO2˙ → PhO˙ + H2O2 | (11) |
| H2O2 + O2 → 2HO2˙ | (12) |
Each hydrogen abstraction and formation of free radical steps had to take place on the active sites of the catalyst surface. In the first step, a molecule of phenol is adsorbed onto the catalyst. The surface reaction is hydrogen abstraction with formation of a radical. The formed radical will be released into the solution and oxidized in the homogeneous phase, directly to the desired end products, or through the formation of shorter chain intermediates. Phenol is believed to adsorb exclusively on the metal ion sites at their higher oxidation states and is transformed into phenoxy radicals via the surface redox cycle and hydroxyl hydrogen abstraction.61 The non-lattice oxygen on the catalyst surface has higher mobility than the lattice oxygen, and accordingly can take an active part in the oxidation process.44,63 It was widely accepted that the non-lattice oxygen played an important role in the catalytic activity of CWO of organic compounds.44 The catalyst of Ru–5Cu/Al2O3 had more non-lattice oxygen content, resulting in generating radical species more easily.
3.6. Reuse of the Ru–5Cu/Al2O3 catalyst
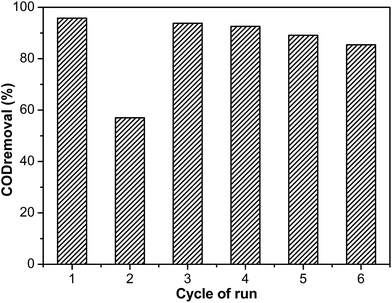
The Ru–5Cu/Al2O3 catalyst exhibited high activity for elimination of phenol. It was necessary to evaluate the lifespan and stability of the catalyst for heterogeneous catalysis. Consecutive runs were carried out using the same catalyst to decompose phenol under the optimum conditions. After the reaction finished, the catalyst was separated from the suspension by filtration, followed by washing with ethanol and distilled water several times. After the first cycle, the catalyst was directly used for a second run without regeneration. Also, the concentration of leaching Ru and Cu ions in the solution was detected by ICP-OES measurement. The concentration of Ru was only 0.13 mg L−1, which could be negligible. The concentration of leaching of the Cu ion was 81.85 mg L−1.The COD removal efficiency decreased dramatically from 95.8% to 57.0% after two cycles, because the coke deposition covered the catalyst surface and inhibited the organics’ contact with the active sites.37 In order to regenerate the catalytic activity of the catalyst, the used catalyst was calcined under air at 500 °C for 4 h after the second run. The COD degradation efficiency of the regenerated catalyst was noticeably increased to 93.8% at the third cycle. This removal efficiency was nearly equal to that of the fresh catalyst. It was suggested that the carbon deposited on the catalyst surface could not cause serious damage to the catalyst. The regenerated catalyst exhibited good performance even after six cycles (Fig. 16). The removal efficiency of the phenol aqueous solutions exhibited a slight reduction and dropped to 85.4% after six runs, which was related to the leaching of the active metals.65 According to XPS of Cu 2p (Fig. S9†), the Cu2O on the catalyst surface was converted into CuO after calcination, which was the same as treating by calcination and H2 treatment. It was observed that the change of the oxidation state of the Cu species was not the main reason for catalyst deactivation. In order to regenerate the catalyst as simply as possible, the used catalyst was directly calcined to recover the catalytic activity.
4. Conclusions
In summary, we combined noble Ru and transition metals as additives for various supports and assessed them for catalytic wet oxidation of highly concentrated phenol under mild conditions. Most importantly, the Ru–5Cu/Al2O3 exhibited the highest efficiency for degradation of the high-loaded phenol with COD removal of 91.7% and 95.8% after 1 h and 2 h under the reaction conditions of 130 °C and 0.8 MPa oxygen pressure. The addition of Cu could effectively improve the performance of the Ru-based catalyst, which may be attributed to the synergistic effect, good dispersion of the active metal and the high content of non-lattice oxygen. The kinetic investigation revealed that the overall rate of the oxidation reaction conformed well to the pseudo-first-order model. The Ru–5Cu/Al2O3 catalyst suffered deactivation mainly due to the carbon deposition covering the active sites, while the deposited carbon was easily removed through calcination and the catalyst recovered catalytic activity. Hence, our work highlighted again that the supports and secondary metals had great influence on the catalytic activity. The noble-transition bimetallic Ru–Cu catalyst had promising prospects for decomposition of organic wastewater with higher activity and lower noble metal loading.Acknowledgements
This work was supported by the National Natural Science Foundation of China (21401030), GXNSF (2014GXNSFBA118048), as well as the Guangxi Experiment Centre of Science and Technology (YXKT2014008).Notes and references
- A. Fortuny, C. Bengoa, J. Font and A. Fabregat, J. Hazard. Mater., 1999, 64, 181–193 CrossRef CAS PubMed.
- R. Berenguer, J. M. Sieben, C. Quijada and E. Morallón, Appl. Catal., B, 2016, 199, 394–404 CrossRef CAS.
- Y. Liu, H. Dai, J. Deng, L. Zhang and C. T. Au, Nanoscale, 2012, 4, 2317–2325 RSC.
- E. Rafiee, E. Noori, A. A. Zinatizadeh and H. Zanganeh, RSC Adv., 2016, 6, 96554–96562 RSC.
- Z.-L. Wu, B. Ondruschka and G. Cravotto, Environ. Sci. Technol., 2008, 42, 8083–8087 CrossRef CAS PubMed.
- S. Song, Z. Liu, Z. He, A. Zhang and J. Chen, Environ. Sci. Technol., 2010, 44, 3913–3918 CrossRef CAS PubMed.
- A. C. Mecha, M. S. Onyango, A. Ochieng, C. J. S. Fourie and M. N. B. Momba, J. Catal., 2016, 341, 116–125 CrossRef CAS.
- F. Arena, C. Italiano and L. Spadaro, Appl. Catal., B, 2012, 115–116, 336–345 CrossRef CAS.
- S. Yang, X. Li, W. Zhu, J. Wang and C. Descorme, Carbon, 2008, 46, 445–452 CrossRef CAS.
- Y. Yan, S. Jiang and H. Zhang, RSC Adv., 2016, 6, 3850–3859 RSC.
- S. Yang, Z. Liu, X. Huang and B. Zhang, J. Hazard. Mater., 2010, 178, 786–791 CrossRef CAS PubMed.
- X. Xu, G. Zeng, Y. Peng and Z. Zeng, Chem. Eng. J., 2012, 200–202, 25–31 CrossRef CAS.
- I.-P. Chen, S.-S. Lin, C.-H. Wang, L. Chang and J.-S. Chang, Appl. Catal., B, 2004, 50, 49–58 CrossRef CAS.
- S. A. Messele, O. S. G. P. Soares, J. J. M. Órfão, F. Stüber, C. Bengoa, A. Fortuny, A. Fabregat and J. Font, Appl. Catal., B, 2014, 154–155, 329–338 CrossRef CAS.
- M. Abecassis-Wolfovich, M. V. Landau, A. Brenner and M. Herskowitz, Ind. Eng. Chem. Res., 2004, 43, 5089–5097 CrossRef CAS.
- S. Nousir, S. Keav, J. Barbier, M. Bensitel, R. Brahmi and D. Duprez, Appl. Catal., B, 2008, 84, 723–731 CrossRef CAS.
- M. A. L. Rocha, G. D. Ángel, G. Torres-Torres, A. Cervantes, A. Vázquez, A. Arrieta and J. N. Beltramini, Catal. Today, 2015, 250, 145–154 CrossRef CAS.
- D. K. Mondal, C. Mondal and S. Roy, RSC Adv., 2016, 6, 114383–114395 RSC.
- A. Quintanilla, J. A. Casas and J. J. Rodriguez, Appl. Catal., B, 2010, 93, 339–345 CrossRef CAS.
- S. Yang, W. Zhu, X. Li, J. Wang and Y. Zhou, Catal. Commun., 2007, 8, 2059–2063 CrossRef CAS.
- A. B. Ayusheev, O. P. Taran, I. A. Seryak, O. Y. Podyacheva, C. Descorme, M. Besson, L. S. Kibis, A. I. Boronin, A. I. Romanenko, Z. R. Ismagilov and V. Parmon, Appl. Catal., B, 2014, 146, 177–185 CrossRef CAS.
- P. Massa, F. Ivorra, P. Haure, F. M. Cabello and R. Fenoglio, Catal. Commun., 2007, 8, 424–428 CrossRef CAS.
- A. E. Monteros, G. Lafaye, A. Cervantes, G. D. Angel, J. Barbier Jr and G. Torres, Catal. Today, 2015, 258, 564–569 CrossRef.
- T. Jiang, Y. Zhou, S. Liang, H. Liu and B. Han, Green Chem., 2009, 11, 1000–1006 RSC.
- W. Long, Q. Zhai, J. He, Q. Zhang, W. Deng and Y. Wang, ChemPlusChem, 2012, 77, 27–30 CrossRef CAS.
- H. T. Gomes, J. L. Figueiredo and J. L. Faria, Appl. Catal., B, 2000, 27, L217–L223 CrossRef CAS.
- A. Cybulski and J. Trawczyński, Appl. Catal., B, 2004, 47, 1–13 CrossRef CAS.
- F. Arena, C. Italiano, A. Raneri and C. Saja, Appl. Catal., B, 2010, 99, 321–328 CrossRef CAS.
- L. Hua, H. Ma and L. Zhang, Chemosphere, 2013, 90, 143–149 CrossRef CAS PubMed.
- A. Song and G. Lu, RSC Adv., 2014, 4, 15325–15331 RSC.
- H. Wang, W. Yang, P. Tian, J. Zhou, R. Tang and S. Wu, Appl. Catal., A, 2017, 529, 60–67 CrossRef CAS.
- D. Liu, B. Jiang, Z. Liu, Y. Ge and Y. Wang, Ceram. Int., 2014, 40, 9981–9987 CrossRef CAS.
- N. Hamzah, N. M. Nordin, A. H. A. Nadzri, Y. A. Nik, M. B. Kassim and M. A. Yarmo, Appl. Catal., A, 2012, 419–420, 133–141 CrossRef CAS.
- M. Ishikawa, M. Tamura, Y. Nakagawa and K. Tomishige, Appl. Catal., B, 2016, 182, 193–203 CrossRef CAS.
- A. Song and G. Lu, Environ. Technol., 2015, 36, 1160–1166 CrossRef CAS PubMed.
- N. M. Dobrynkin, M. V. Batygina, A. S. Noskov, P. G. Tsyrulnikov, D. A. Shlyapin, V. V. Schegolev, D. A. Astrova and B. M. Laskin, Top. Catal., 2005, 33, 69–76 CrossRef CAS.
- H. Zhang, W. Li, Y. Jin, W. Sheng, M. Hu, X. Wang and J. Zhang, Appl. Catal., B, 2016, 189, 56–64 CrossRef CAS.
- M.-N. Chen, D.-Y. Zhang, L. T. Thompson and Z.-F. Ma, Int. J. Hydrogen Energy, 2011, 36, 7516–7522 CrossRef CAS.
- J. Fu, K. Yang, C. Ma, N. Zhang, H. Gai, J. Zheng and B. H. Chen, Appl. Catal., B, 2016, 184, 216–222 CrossRef CAS.
- Z. Sun, Z. Liu, B. Han, S. Miao, J. Du and Z. Miao, Carbon, 2006, 44, 888–893 CrossRef CAS.
- Y. Iijima, N. Niimura and K. Hiraoka, Surf. Interface Anal., 1996, 24, 193–197 CrossRef CAS.
- G. Zhang, Z. Li, H. Zheng, Z. Hao, X. Wang and J. Wang, Appl. Surf. Sci., 2016, 390, 68–77 CrossRef CAS.
- X. Cui, Y. Wang, L. Chen and J. Shi, ChemCatChem, 2014, 6, 2860–2871 CrossRef CAS.
- J. Wang, W. Zhu, X. He and S. Yang, Catal. Commun., 2008, 9, 2163–2167 CrossRef CAS.
- F. Larachi, J. Pierre, A. Adnot and A. Bernis, Appl. Surf. Sci., 2002, 195, 236–250 CrossRef CAS.
- V. I. Nefedov, J. Electron Spectrosc. Relat. Phenom., 1982, 25, 29–47 CrossRef CAS.
- Q. Shi, N. Liu and Y. Liang, Chin. J. Catal., 2007, 28, 57–61 CrossRef CAS.
- T. Chen, S. Yu, X. Fang, H. Huang, L. Li, X. Wang and H. Wang, Appl. Surf. Sci., 2016, 389, 303–310 CrossRef CAS.
- Y. Peng, D. Fu, R. Liu, F. Zhang, X. Xue, Q. Xu and X. Liang, Appl. Catal., B, 2008, 79, 163–170 CrossRef CAS.
- S. S. Lin, D. J. Chang, C.-H. Wang and C. C. Chen, Water Res., 2003, 37, 793–800 CrossRef CAS PubMed.
- S. Wang, Q. Yang, Z. Bai, S. Wang, H. Chen and Y. Cao, Environ. Eng. Sci., 2015, 32, 1–8 CrossRef.
- N. Li, C. Descorme and M. Besson, Appl. Catal., B, 2007, 71, 262–270 CrossRef CAS.
- A. Yadav, A. K. Teja and N. Verma, J. Environ. Chem. Eng., 2016, 4, 1504–1513 CrossRef CAS.
- J. Guo and M. Al-Dahhan, Ind. Eng. Chem. Res., 2003, 42, 5473–5481 CrossRef CAS.
- K. R. Alunga, Y. Ye, S. Li, D. Wang and Y. Liu, Catal. Sci. Technol., 2015, 5, 3746–3753 CAS.
- Anushree, S. Kumar and C. Sharma, Catal. Sci. Technol., 2016, 6, 2101–2111 CAS.
- X. Huang, M. Leal and Q. Li, Water Res., 2008, 42, 1142–1150 CrossRef CAS PubMed.
- J. E. Atwater, J. R. Akse, J. A. McKinnis and J. O. Thompson, Chemosphere, 1997, 34, 203–212 CrossRef CAS.
- F. Luck, Catal. Today, 1996, 27, 195–202 CrossRef CAS.
- Y. I. Matatov-Meytal and M. Sheintuch, Ind. Eng. Chem. Res., 1998, 37, 309–326 CrossRef CAS.
- A. Pintar and J. Levec, Chem. Eng. Sci., 1994, 49, 4391–4407 CrossRef CAS.
- L. Li, P. Chen and E. F. Gloyna, AIChE J., 1991, 37, 1687–1697 CrossRef CAS.
- K.-H. Kim and S.-K. Ihm, J. Hazard. Mater., 2011, 186, 16–34 CrossRef CAS PubMed.
- J. Barbier Jr, F. Delanoë, F. Jabouille, D. Duprez, G. Blanchard and P. Isnard, J. Catal., 1998, 177, 378–385 CrossRef.
- A. Abbasi, M. Soleimani, M. Najafi and S. Geranmayeh, Inorg. Chim. Acta, 2016, 439, 18–23 CrossRef CAS.
Footnote |
| † Electronic supplementary information (ESI) available. See DOI: 10.1039/c7ra00545h |
| This journal is © The Royal Society of Chemistry 2017 |

