
 Open Access Article
 This Open Access Article is licensed under a
 Creative Commons Attribution 3.0 Unported Licence
Graphene oxide-based silsesquioxane-crosslinked networks – synthesis and rheological behavior†
Mina Namvari ab,
Lei Duab and
Florian J. Stadler*a
ab,
Lei Duab and
Florian J. Stadler*a
aCollege of Materials Science and Engineering, Shenzhen Key Laboratory of Polymer Science and Technology, Guangdong Research Center for Interfacial Engineering of Functional Materials, Nanshan District Key Lab for Biopolymers and Safety Evaluation, Shenzhen University, Shenzhen 518060, PR China. E-mail: fjstadler@szu.edu.cn; Fax: +86-0755-26536239; Tel: +86-0755-26538236 Tel: +86-159-8940-3396
bKey Laboratory of Optoelectronic Devices and System of Ministry of Education and Guangdong Province, College of Optoelectronic Engineering, Shenzhen University, Shenzhen, People's Republic of China
First published on 19th April 2017
Abstract
Click reaction between octa(3-azidopropyl)polyhedral oligomeric silsesquioxane (POSS–(N3)8) and heavily alkyne-decorated graphene oxide (GO) has led to crosslinking POSS with GO. Introducing POSS to GO and reduction of GO sheets by sodium ascorbate during click reaction has led to a hydrophobic and well organically dispersible material. Hydrophobic reduced graphene oxide crosslinked with polyhedral oligomeric silsesquioxanes (rGO–POSS) network showed high solubility in various organic solvents. GO, rGO, and rGO–POSS were used as fillers for fabricating polydimethylsiloxane nanocomposites for rheological investigations. While the larger GO-sheets led to a surprisingly low rheological percolation threshold, the significantly smaller rGO–POSS filled systems showed almost the same percolation threshold as GO-filled systems when only the graphenic part of the nanocomposites was considered. rGO-filled composites, which have the same low hydrophobicity and relatively small size as the rGO–POSS fillers, show a significantly higher percolation threshold, which is attributed to partial restacking of these fillers.
Introduction
When searching for a material with various applications and remarkable electrical, optical, thermal, and mechanical properties, graphene1 is the first to be considered.2 Despite its outstanding properties, the zero band gap of graphene and its inertness to reaction, make it poorly processable. Highly oxygenated graphene oxide (GO) facilitates the route to obtain functionalized graphene sheets, followed by a reduction step. Attaching specific polymers has led to the preparation of water soluble graphene hybrids.2,3 Recently, organic soluble graphene by physical or chemical functionalization of GO with organic moieties has been of great interest. Oxygen containing groups (e.g., –OH, –COOH, epoxy) on GO are the reaction points for modifications such as esterification, amidation, nucleophilic and isocyanate reactions.4 On the other hand, graphene 3D networks have gained great attention in recent years for energy storage5 and biological applications.6 Chemical crosslinking would be more preferable due to the strength of chemical bonds. Ou et al. have used multi-amine-containing molecules such as 1,4-diaminobenzene, benzidine, and 5,10,15,20-tetrakis(4-aminophenyl)-21H,23H-porphine to graft GO sheets to obtain films with excellent stability, controllable thickness and tunable electrical behaviors,7 while the GO-based benzimidazole-crosslinked network has shown high potential in gas sorption and as a supercapacitor.8 Dicarboxylic acids and diols have also been used as crosslinking agents for GO for ion separation. Since the introduction of click chemistry, it has met the need of researchers in different fields of science for a set of powerful, highly reliable, and selective reactions for the rapid synthesis of useful new compounds and combinatorial libraries.9 Click reactions, and above all Cu(I)-catalyzed Huisgen cycloaddition of azide and alkyne (CuAAC), have made their way into modification of polymers,10 nanoparticles,11 carbon nanomaterials,12–16 and proteins.17 GO nanosheets were assembled together through an azide–alkyne click reaction to obtain a highly permeable polypropylene membrane,18 while Lin et al. used an azoaromatic crosslinker to connect alkyne-containing GO sheets.19 In our recent study, we reported water soluble copolymers having tailored lower critical solution temperatures and a unique tube-like structure, in which a reversible addition–fragmentation transfer agent was attached to GO sheets via click chemistry.14Polyoligomeric silsesquioxanes (POSS) have a unique cage-like structure with eight organic functionalities, which make it suitable as a core or crosslinking molecule since it is soluble in a wide range of organic solvents. POSS has been used to modify polymers,20 carbon nanotubes,21 and nanoparticles.22 To date, the most common reaction applied for crosslinking POSS for capillary liquid chromatography application has been the thiol–ene reaction.23–26 POSS-based hybrid thermosets were prepared via photoinduced CuAAC.27 Alves et al. reported crosslinking vinyl-POSS and homotelechelic thiol polyethylene glycol di-ester macromonomers to obtain hydrogels with enhanced and widely varying physicochemical characteristics.28 Notable properties of graphene, such as electrical and sensing properties, and those of POSS, such as solubility, have caused researchers to graft them together. A nanocomposite of POSS/reduced GO (rGO) has been prepared by the solvothermal method for electrochemical sensing of nitrite.29 There are only a few reports on chemical grafting of POSS on GO. In the first study in 2012, amidation reation of GO with POSS–NH2 was reported and the addition of only 1 wt% of the resulted POSS–graphene into PMMA could increase the Tg of the resultant composite 11 °C.30 GO–POSS has also been used to improve the mechanical and thermal conductivity of polymers such as epoxy resin31 and polyimide.32 In addition, GO–POSS was used as a novel nanofiller of a non-conventional electrorheological nanofluid with high dispersion ability and improved electro-responsive behavior.33 Hydrophilic GO does not exhibit good compatibility with nonpolar polydimethylsiloxane (PDMS), but it is expected that GO functionalized with hydrophobic groups may show a better compatibility.
Rheology, the science of flow, has shown multifarious aspects of liquid-like and soft solid behaviors, which are used (among many other areas) to assess the structure and interactions of the different constituents of a polymer composite (a polymer with a solid filler) as well as the processing properties.34 While rheology of polymers with micro-fillers is a well-established topic, the rheological behavior of nano-sized fillers has only started to be investigated ca. 20 years ago as part of the development of nanoparticles in several areas. In comparison to classical microcomposites, nanocomposites show much stronger effects of the fillers at small concentrations, i.e. the percolation threshold – the concentration at which a rheologically relevant network is found to percolate through the sample – is significantly lower for nanoparticle than for microparticle-filled composites.35–37 This higher efficiency of nanofillers is primarily due to the much higher surface area of nanocomposites, partially immobilizing the polymer around it.38 In the early days of the investigations on nanocomposite rheology, the main systems were polymer nano-clay filled, while today much more interest lies in graphene sheet filled systems.39–42
In general, the introduction of fillers below the percolation threshold leads to an increased melt elasticity, while having rather little effect on the viscosity and this effect is mostly found at long times/low frequencies.37 At the percolation threshold, the system behaves similar to a critical gel, i.e. the storage modulus G′(ω) is approximately equal to the loss modulus G′′(ω) and consequently, the loss factor tan![[thin space (1/6-em)]](https://www.rsc.org/images/entities/char_2009.gif) δ(ω) ≈ 1, usually accompanied by a significant increase in viscosity.43 Above the percolation threshold, only few measurements were reported; this can be easily explained by the fact that in this regime, the rheological measurements are very difficult to be carried out as the percolation network prevents flow and depends highly on the mechanical history of the material.44,45 In this regime, in general, elasticity dominates the rheological behavior, G′(ω) > G′′(ω), as the fillers form a network, which effectively traps the polymer melt (or solution) in the pores of this network and thus prevents flow, particularly on large scales, i.e. at long times/low frequencies.
δ(ω) ≈ 1, usually accompanied by a significant increase in viscosity.43 Above the percolation threshold, only few measurements were reported; this can be easily explained by the fact that in this regime, the rheological measurements are very difficult to be carried out as the percolation network prevents flow and depends highly on the mechanical history of the material.44,45 In this regime, in general, elasticity dominates the rheological behavior, G′(ω) > G′′(ω), as the fillers form a network, which effectively traps the polymer melt (or solution) in the pores of this network and thus prevents flow, particularly on large scales, i.e. at long times/low frequencies.
To the best of our knowledge, crosslinking GO with POSS has not yet been reported. In this study, we developed the crosslinking of highly alkyne-functionalized GO with octa-azido POSS. First, GO was reacted with sodium chloroacetate to cover the surface of GO with the carboxylic acid group. Further functionalizing with propargyl alcohol (GO–alkyne) provided a maximum number of alkyne groups on GO sheets. Finally, GO–alkyne was clicked with octa(3-azidopropyl)POSS, leading to a hydrophobic rGO–POSS hybrid. Next, nanofluids of GO, rGO, and rGO–POSS with PDMS were prepared and their rheological properties were investigated.
Experimental
Materials
Graphite was purchased from Alpha Aesar (200 μm). The PDMS is Wacker Silicone Fluid AK 1000000. All other chemicals and solvents were of analytical grade, purchased from Shanghai Macklin Biochemical Co., Ltd., and used without further purification.Preparation of GO–alkyne
First, GO was prepared according to ref. 46: for carboxylation, 1.5 g of GO was tip sonicated in 750 mL of deionized (DI) water for 30 min to obtain a concentration of ∼2 mg mL−1. NaOH (5.0 g) was added and bath-sonicated for 2 h to open the epoxy groups. Next, chloroacetic acid (5.0 g) was added to the suspension and the mixture was bath-sonicated for 6 h to convert the –OH groups into –COOH via conjugation with acetic acid moieties to obtain GO–COOH. The resulting GO–COOH solution was neutralized and was then purified by repeated rinsing and centrifuging.47 For esterification of carboxylic acids with propargyl alcohol, 1.2 g of GO–COOH was sonicated in dry DMF (∼2 mg mL−1) for 30 min. Then, it was transferred to a three-neck round bottom flask. N,N′-Dicyclohexylcarbodiimide (10.0 g, 48.5 mmol) and 4-dimethylaminopyridine (2.0 g, 16.4 mmol) were added to the suspension in inert atmosphere. After stirring for 1 h at 0 °C, propargyl alcohol (5 mL, 86.6 mmol) was added dropwise and stirred at 0 °C for 1 h. It was then stirred at 60 °C for 48 h. After cooling, it was centrifuged (5000 rpm), washed with DMF, water and EtOH several times and dried in vacuo at 40 °C overnight.Synthesis of octa(3-azidopropyl)polyhedral oligomeric silsesquioxane (POSS–(N3)8)
POSS–(N3)8 was prepared via azidation of octa(3-chloropropyl)polyhedral oligomeric silsesquioxane (POSS–(C3H6Cl)8).48 Into a 100 mL round-bottom flask, NaN3 (6.5 g, 0.1 mol), POSS–(Cl)8 (3.0 g, 2.9 mmol), and DMF (50 mL) were added. The flask was then immersed into an oil bath. After stirring for 48 h at 120 °C, the solvent was removed at reduced pressure. Residues were dissolved in THF and passed through a neutral alumina column to remove residual sodium salts. A colorless viscous liquid was obtained after drying in vacuo overnight at room temperature. 1H NMR (CDCl3, δ, ppm, TMS): 0.78–0.81 (2H, Si–CH2), 1.74–1.75 (2H, Si–CH2CH2), 3.37–3.38 (2H, Si–CH2CH2CH2N3) (Fig. SI1†).Preparation of rGO–POSS
Herein, 1.0 g of GO–alkyne was tip sonicated in 500 mL of dry DMF for 30 min. After transferring to a three-neck round-bottom flask, the suspension was bubbled for 30 min to remove oxygen. Next, sodium ascorbate (0.07 g, 0.36 mmol) and CuSO4·5H2O (0.03 g, 0.12 mmol) were added and stirred for 30 min before adding 1.0 g of POSS–(N3)8. Every 6 h the stirring was stopped and the solution was placed in an ultrasonic bath for 10 min. After 72 h, the reaction mixture was centrifuged (5000 rpm), washed with DMF, water and EtOH and freeze-dried for 24 h.Preparation of GO, rGO, and rGO–POSS nanofluids
The nanofluids were prepared by the solvent evaporation transfer method. Herein, 1, 2, 4, 8, and 16 wt% solution of graphenic material with PDMS (total weight: 100 mg) was prepared in THF. First, a specific amount of PDMS solution in THF was heated to 67 °C and then a certain amount of graphenic material suspension was added dropwise. After stirring for 30 min at 67 °C, THF was fully evaporated and the dispersion was further dried at 80 °C for 24 h in vacuum to completely remove THF, and the final nanofluids were obtained.Materials characterization
The Fourier-transform infrared spectrum (FTIR) was conducted on a Nicolet 6700 (Thermo Scientific, USA). The samples were sputtered with gold and examined using thermal field emission scanning electron microscope (SEM; Hitachi, SU-70) at an activation voltage of 15.0 kV. Raman spectra were recorded from 500 to 3000 cm−1 on an inVia confocal Raman microscope (Renishaw, England), while X-ray diffraction (XRD) was measured on a Bruker D8 Advance system. The thermogravimetric analysis (TGA) was performed on a TA Q50 in a nitrogen atmosphere at a heating rate of 10 °C min−1 from RT to 700 °C.Rheological measurements
Rheological measurements were performed on a stress controlled rheometer, Anton Paar MCR 302 (Anton Paar GmbH, Germany) with 8 mm parallel-plate geometry. The use of cone and plate geometries is not possible, because for composites it tends to produce artefacts, due to the fact that agglomerates of particles can form a solid bridge between the plate and the (truncated) cone tip.After the sample was loaded on the geometry of the rheometer, the sample was squeezed with a normal force lower than 0.1 N. Before the measurements, the sample was left at rest for at least 30 minutes to allow complete relaxation of normal force within the force resolution limit. Linear oscillatory frequency sweeps were performed from 100 to 0.1 rad s−1 at an appropriate strain in the linear viscoelastic region. All experiments were conducted at 20 °C ± 0.1 °C.
Results and discussion
Characterization of rGO–POSS
As illustrated in Scheme 1, to fabricate covalently crosslinked rGO sheets with POSS, GO was first carboxylated with chloroacetic acid, and all the epoxy and hydroxyl groups were converted to carboxylic acid groups. The aim of this procedure was to maximize the number of binding points. GO–COOH was next reacted with propargyl alcohol to obtain the alkyne-containing side of the click reaction. On the other hand, POSS–(Cl)8 was prepared with the starting compound 3-chloropropyltrimethoxysilane, and then Cl groups were substituted by azide to obtain POSS–(N3)8 and in other words, the azide-containing side of click reaction. Finally, GO–alkyne was crosslinked with POSS–(N3)8 into a 3D network (rGO–POSS). Since sodium ascorbate is a green reducing agent for GO,49 reduction occurred during the click reaction as well and thus, the majority of possibly remaining oxygen functionalities were also removed. This is the reason for which we abbreviated it as rGO–POSS (Scheme 1).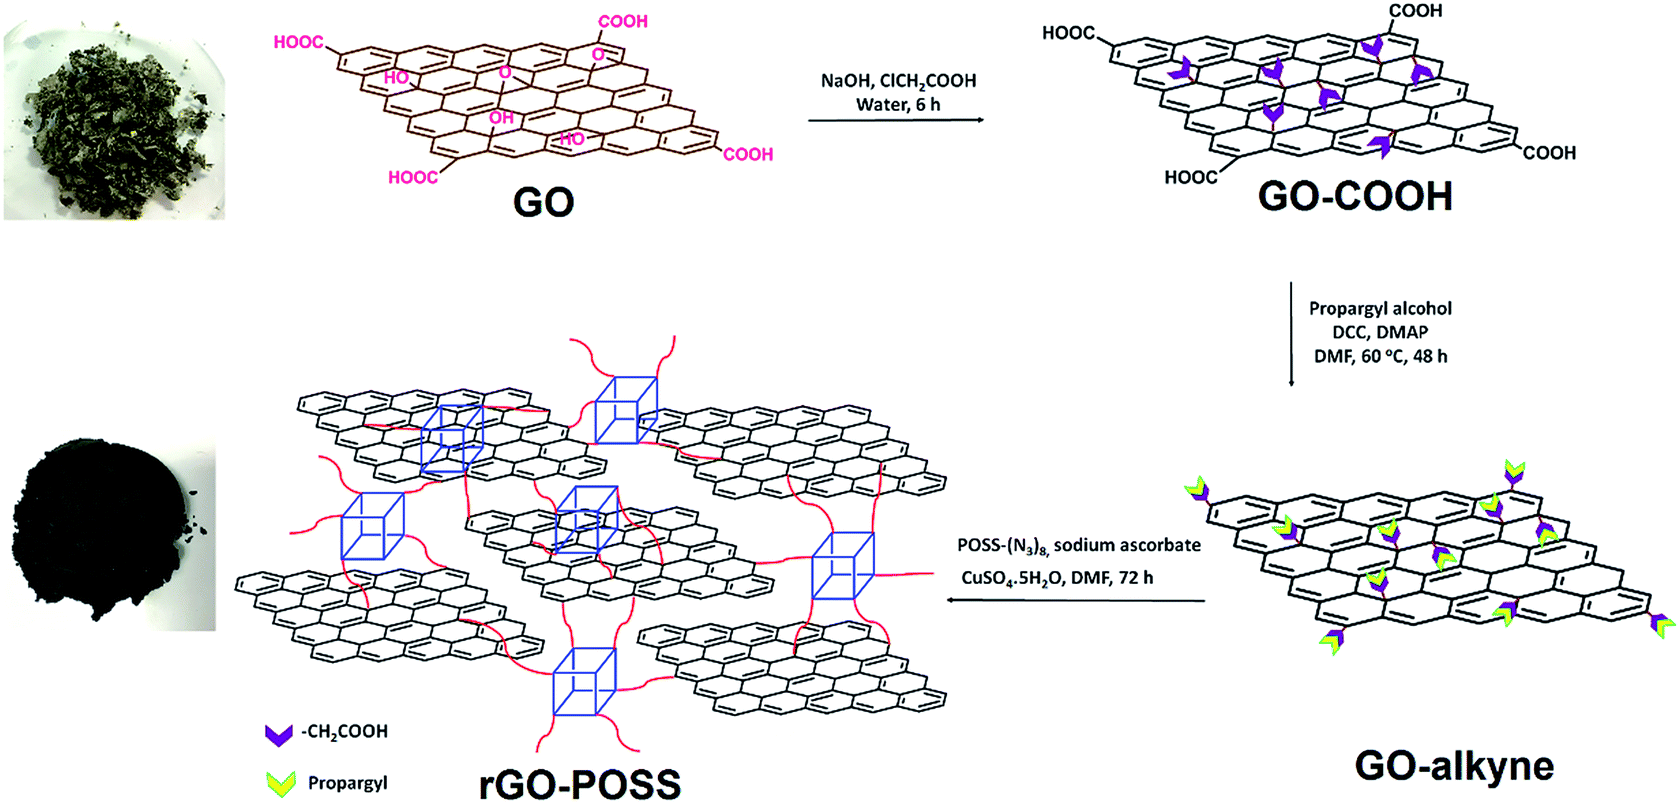 | ||
| Scheme 1 Synthesis of rGO–POSS. | ||
Fig. 1 shows the solubility of rGO–POSS in different organic solvents. GO is easily dispersed in water due to the presence of oxygen-containing groups. However, one of the main problems that restricts the application and processability of graphene is its insolubility in organic solvents.46 The linking of cage-linked bulky nanostructures to graphene made rGO–POSS highly soluble in organic solvents. As shown in Fig. 1 rGO–POSS was highly soluble in chloroform, THF, acetone, DMF, and toluene but showed low solubility in n-hexane. After 24 h (Fig. 1b), it precipitated in n-hexane and became less soluble in toluene.
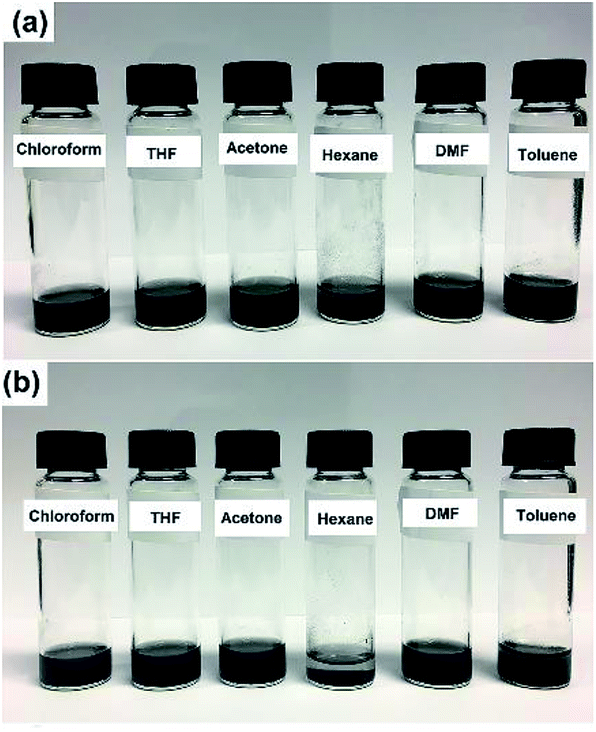 | ||
| Fig. 1 (a) Solubility of rGO–POSS in different organic solvents, (b) after 24 h. | ||
FTIR spectra of GO, GO–COOH, GO–alkyne and rGO–POSS are shown in Fig. 2a. GO showed five characteristic peaks related to C–O–C (1090 cm−1), C–OH (1390 cm−1), C![[double bond, length as m-dash]](https://www.rsc.org/images/entities/char_e001.gif) C (1630 cm−1), CO (1740 cm−1) and O–H (3450 cm−1) indicating the presence of epoxy, hydroxyl and carboxylic acid groups on GO sheets. Removal of oxygen functionalities of GO using sodium ascorbate is confirmed by a significant decrease in C–OH and almost complete disappearance of O–H groups.50 After the reaction of GO with base and chloroacetic acid, the above mentioned peaks reduced in intensity, and new peaks attributed to O–CH2 (1103 cm−1) and aliphatic hydrogens (2930 cm−1) appeared in the spectrum of GO–COOH. The presence of peaks at 2030 cm−1 and 3039 cm−1 was related to alkyne and acetylenic hydrogen, respectively. Click reaction between GO–COOH and POSS–(N3)8 led to the disappearance of peaks related to the alkyne moiety. In addition, introduction of a peak at 1118 cm−1 and 1790 cm−1 could be assigned to vibration stretching of Si–O–Si and triazole ring, respectively.31 This could be an evidence of the click reaction between GO–alkyne and POSS–(N3)8.
C (1630 cm−1), CO (1740 cm−1) and O–H (3450 cm−1) indicating the presence of epoxy, hydroxyl and carboxylic acid groups on GO sheets. Removal of oxygen functionalities of GO using sodium ascorbate is confirmed by a significant decrease in C–OH and almost complete disappearance of O–H groups.50 After the reaction of GO with base and chloroacetic acid, the above mentioned peaks reduced in intensity, and new peaks attributed to O–CH2 (1103 cm−1) and aliphatic hydrogens (2930 cm−1) appeared in the spectrum of GO–COOH. The presence of peaks at 2030 cm−1 and 3039 cm−1 was related to alkyne and acetylenic hydrogen, respectively. Click reaction between GO–COOH and POSS–(N3)8 led to the disappearance of peaks related to the alkyne moiety. In addition, introduction of a peak at 1118 cm−1 and 1790 cm−1 could be assigned to vibration stretching of Si–O–Si and triazole ring, respectively.31 This could be an evidence of the click reaction between GO–alkyne and POSS–(N3)8.
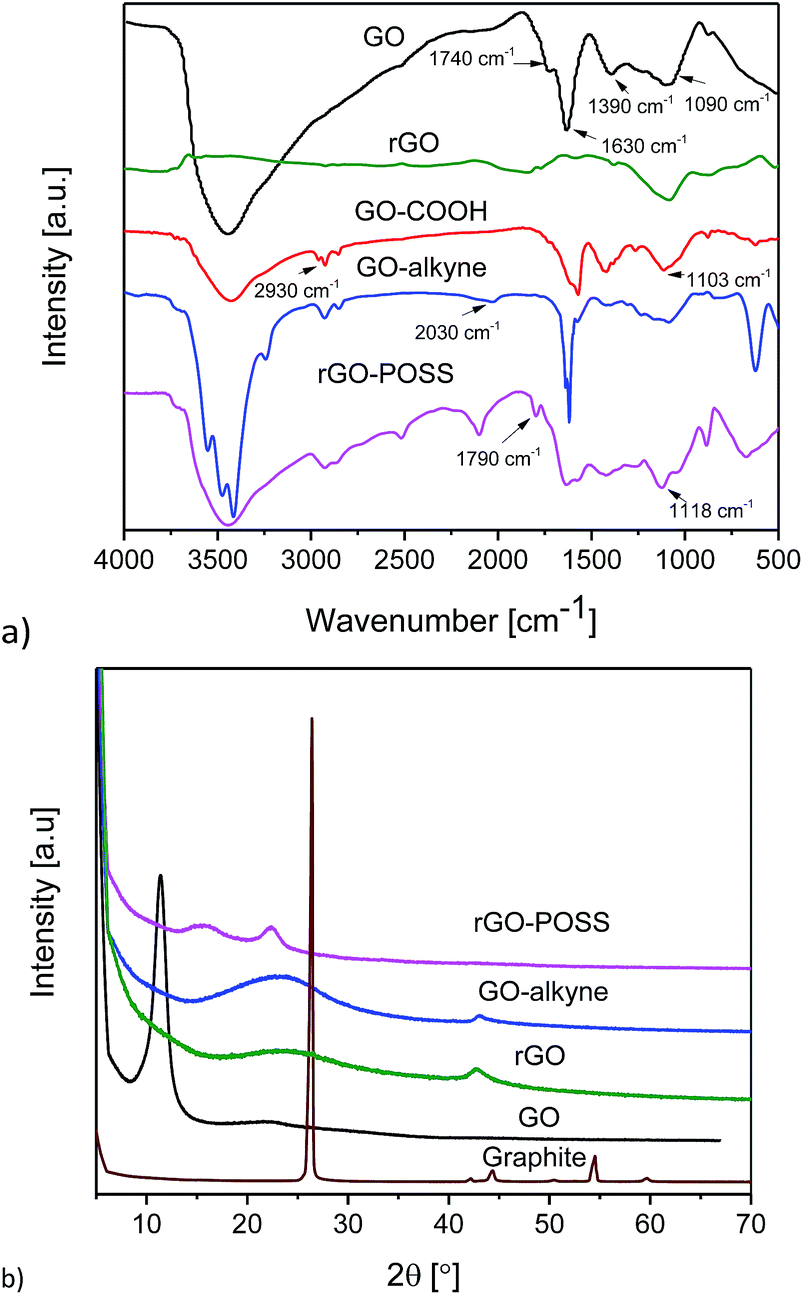 | ||
| Fig. 2 (a) FTIR spectra of GO, rGO, GO–COOH, GO–alkyne, and rGO–POSS and (b) XRD patterns of graphite, GO, rGO, GO–alkyne, and rGO–POSS. | ||
XRD patterns of graphite, GO, GO–COOH, and rGO–POSS are shown in Fig. 2b. Graphite showed a strong peak (002) at 2θ = 26.5° indicating a well-defined crystal structure, while after introducing oxygen-containing functionalities, this peak shifted to 11.46° in GO, and a clear change in intensity and broadness of the peak was observed. Reduction of GO results in a shift of its sharp peak to a higher 2θ value, with a maximum at around 24°; this reduction also results in a significant broadening of the peak due to the removal of functionalities.50 In the XRD pattern of GO–alkyne, the (001) peak of GO was not observed indicating exfoliation of GO sheets. In addition, it showed a broad peak at 2θ = 24° (d-spacing d ≈ 3.7 Å) due to the functionalization and graphene-like structure. This peak shifted to 2θ ∼ 15° (d ≈ 5.9 Å) in rGO–POSS, indicating that the incorporation of POSS increased the distance between the GO–alkyne sheets and induced ordered graphitic stacking of GO to well-disordered structures of rGO–POSS.42 While pristine POSS and even POSS–(Cl)8 are highly crystalline, POSS–(N3)8 is an amorphous viscous liquid. The peak of rGO–POSS at 22° suggested a disordered structure with low crystallinity. These results are consistent with the reports of POSS decorated GO.
Raman spectra of GO, GO–COOH, GO–alkyne, and rGO–POSS are shown in Fig. 3a. GO showed its D band at 1360 cm−1 ascribed to sp3 hybridization (C atoms of defects and disorder) in addition to the G band that was observed at 1586 cm−1, which originated from lattice distortion in sp2-hybridized carbon.
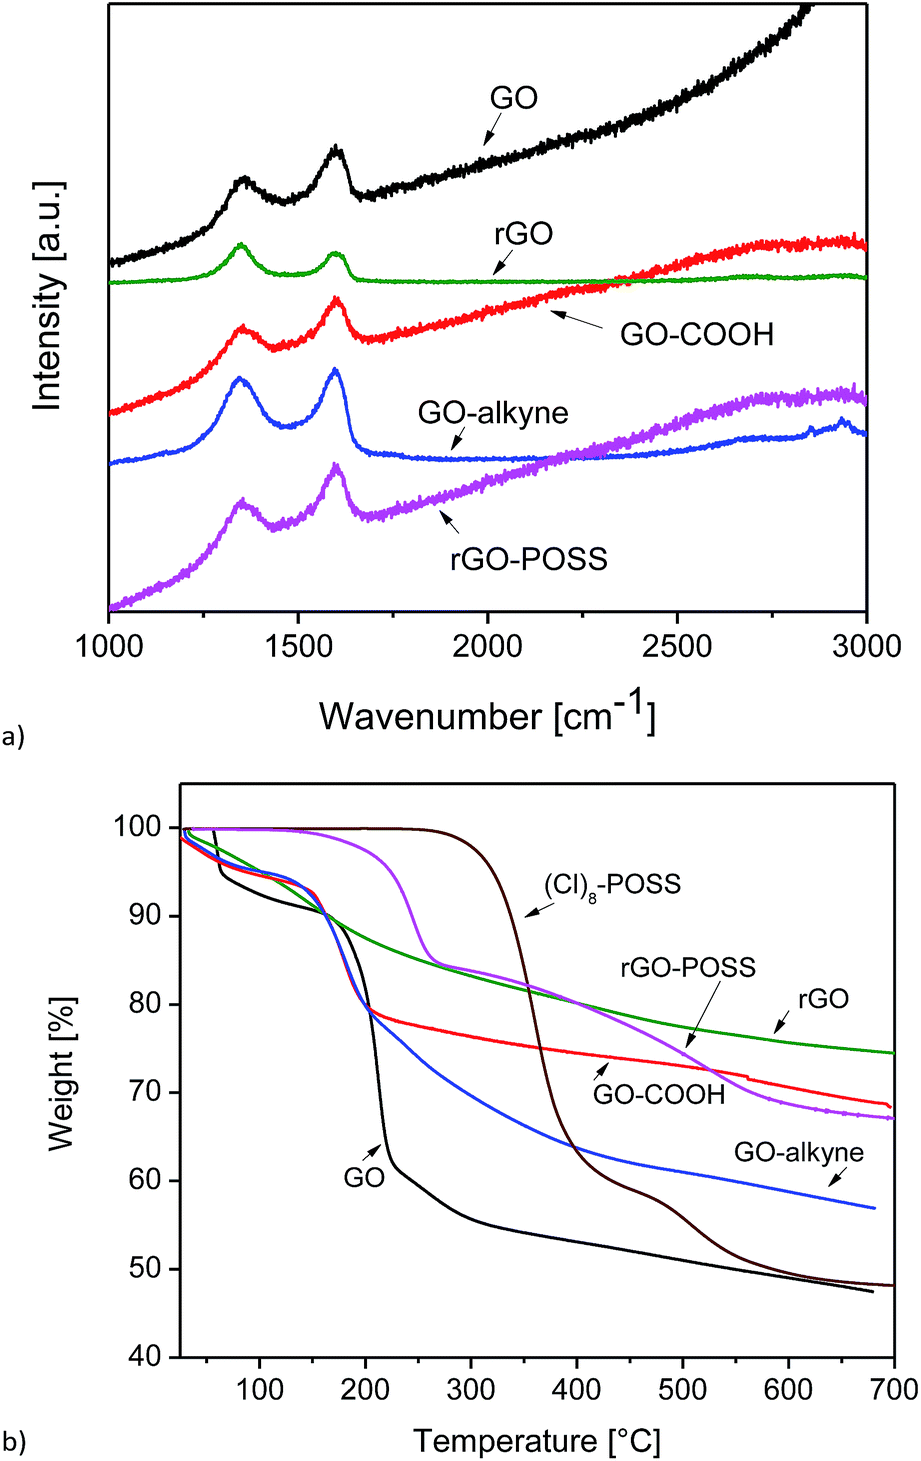 | ||
| Fig. 3 (a) Raman spectra of GO, rGO, GO–COOH, GO–alkyne, and rGO–POSS and (b) TGA curves of GO, rGO, GO–COOH, GO–alkyne, (Cl)8–POSS, and rGO–POSS. | ||
After reduction of GO, ID/IG of rGO increased from 0.85 to 1.03, which can be attributed to the formation of defects in addition to the removal of oxygen containing groups of GO.51 In graphitic materials, functionalization leads to a blue shift in G band and a red shift in D band, which are clearly observed in the spectra of GO–COOH and GO–alkyne. The shift in G band to higher wavenumbers could be due to the influence of defects and isolated double bonds produced by the reduction process of GO. A slight increase in ID/IG (Table 1) after functionalization was probably due to structural distortions induced by acetic acid and propargyl groups.30 However, a decrease was observed in ID/IG of rGO–POSS. As stated in previous reports, introducing POSS onto GO sheets by covalent bonding led to a structural distortion,30 but in our 3D network, crosslinking GO sheets resulted in a relatively ordered structure.19
| Material | D-band [cm−1] | G-band [cm−1] | ID/IG |
|---|---|---|---|
| GO | 1390 | 1586 | 0.85 |
| rGO | 1340 | 1582 | 1.03 |
| GO–COOH | 1355 | 1595 | 0.92 |
| GO–alkyne | 1343 | 1596 | 0.97 |
| rGO–POSS | 1354 | 1594 | 0.84 |
Different structural compositions lead to a different thermal behavior, which can be investigated by TGA. While it would be desirable to use POSS–(N3)8 for the TGA-measurements, its high reactivity prevented this since it could result in explosion when exposed to high temperature. Instead, (Cl)8–POSS was used because its molar mass is slightly lower (1032 g mol−1 vs. 1088 g mol−1 for POSS–(N3)8, 5.1% lower), and it is safe to be measured by TGA. The theoretical residual inorganic masses of these two compounds (POSS/Si8O12R8) are 41.1% and 38.9%, respectively, assuming that the silicon atoms are saturated by hydrogen (R = H).
TGA also enables us to quantify the amount of grafted molecule on GO. As seen in Fig. 3b, GO showed an initial ∼10% weight loss up to 150 °C associated with evaporation of physically adsorbed water onto hydrophilic GO sheets, followed by a major step occurring at ∼200 to 300 °C (35%) due to the decomposition of oxygen-containing groups. GO–COOH showed a significant weight loss ∼100 to 200 °C related to the decomposition of acetic acid groups, while after functionalization with propargyl alcohol, this step started around the same temperature but ended up around 300 °C, indicating the decomposition of propargyl groups located on the surface and edges.42 After crosslinking hydrophilic GO–COOH with POSS–(N3)8, it changes to a very hydrophobic rGO–POSS. No thermal desorption of physically adsorbed water was observed below 100 °C, indicating the hydrophobicity of the material. In addition, introducing POSS to GO has led to a remarkably thermally stable material associated with the thermally stable cubic Si–O–Si core. The first weight loss (∼15%) at 130–280 °C could be attributed to the decomposition of triazole rings. The second step could be assigned to the oxidative decomposition of POSS and combustion of bulk carbon.33 In addition, at 700 °C the weight losses of (Cl)8–POSS, rGO, and rGO–POSS are 52%, 25%, and 33%, respectively. Hence, we conclude that 700 °C is not sufficient to completely remove all organic groups from (Cl)8–POSS. When we consider that POSS–(N3)8 was used for the reaction, we have to assume that the residual mass is ca. 2% lower for this compound than that measured for (Cl)8–POSS. Thus, the rGO–POSS network is estimated to contain about 28 wt% POSS.
The morphology of GO, GO–alkyne, and rGO–POSS was investigated by FESEM. Large wrinkled sheets are characteristic of GO (Fig. 5a). Reduction of GO without the click chemistry groups and POSS resulted in intensely wrinkled and randomly aggregated rGO sheets (Fig. 5b). For GO–alkyne (Fig. 4c), the sheets were closely packed, but after click reaction, POSS–(N3)8 intercalated between the sheets and while crosslinking the sheets, led to an increase in the distance between the layers. The sheets became rough after functionalization, which can be clearly observed in Fig. 4d. EDX of GO–alkyne and rGO–POSS are shown in Fig. SI2.† The presence of Si confirms the modification of GO–alkyne with POSS.
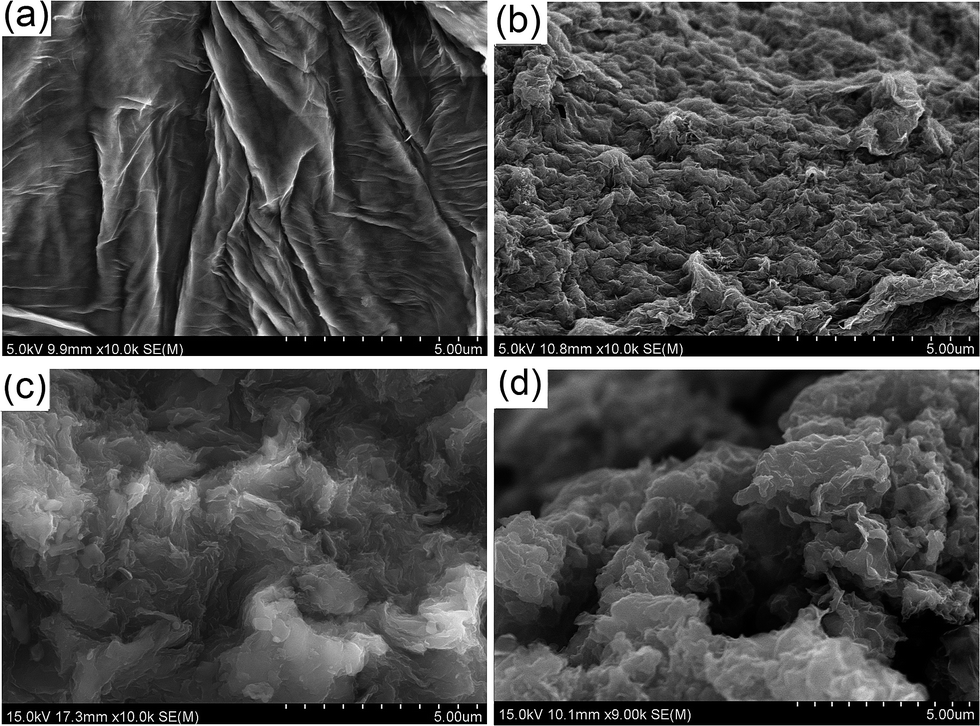 | ||
| Fig. 4 FESEM images of (a) GO, (b) rGO, (c) GO–alkyne, (d) rGO–POSS. | ||
Carbon nanofillers have attracted great attention in polymer nanocomposites52 to improve their mechanical, thermal, and electronic properties. Recent research shows that graphene has an advantage over carbon nanotubes owing to its planar structure and the aspect ratio provided during the loading process.
Rheological studies of GO/PDMS
 | ||
| Fig. 5 Dynamic viscoelastic curves of the storage modulus (G′) and loss modulus (G′′) as a function of frequency for the GO/PDMS (a), the rGO/PDMS (b), the rGO–POSS/PDMS (c) at different GO, rGO, rGO–POSS concentrations. | ||
At high concentrations, an almost perfectly elastic solid like behavior with G′(ω) > G′′(ω) was observed (c ≥ 4 wt% (GO), c ≥ 8 wt% (rGO, rGO–POSS)), which is typically found for materials dominated by entrapment of the liquid in compartments created by the filler.53 In an intermediate range of concentrations, which, however, is only observed for 6 wt% rGO and to some degree for 4 wt% rGO–POSS, a transition between the liquid-like behavior found at low filler contents and the solid-like behavior for highly filled materials can be observed. This intermediate behavior is approximately equivalent to the behavior of a critical gel with δ(ω) being relatively constant around 45°, i.e. G′(ω) ≈ G′′(ω).
The same data is plotted as δ(|G*|)-plot in Fig. 6. It is clear that the data for 0%, 1 wt% filler content as well as 4 wt% rGO-content follow the typical shape for polydisperse linear polymer melts,54,55 while for the composites with 8 and 16 wt% filler content, very low phase angles are found, which are below ca. δ = 30°, indicating a very high elasticity of these systems. It is clear that the phase angle δ for these samples shows no indication of an upturn towards low frequencies/low moduli |G*|. For filler contents between these two extremes, a behavior was found that resembles the one of a polydisperse material for high frequencies/high moduli |G*|, followed by a peak. After that, a downturn in δ is found again, which – just like for the composites with a higher filler content – shows no indication of a change in curvature, indicating that the material still behaves like a liquid for very long times/very low frequencies.
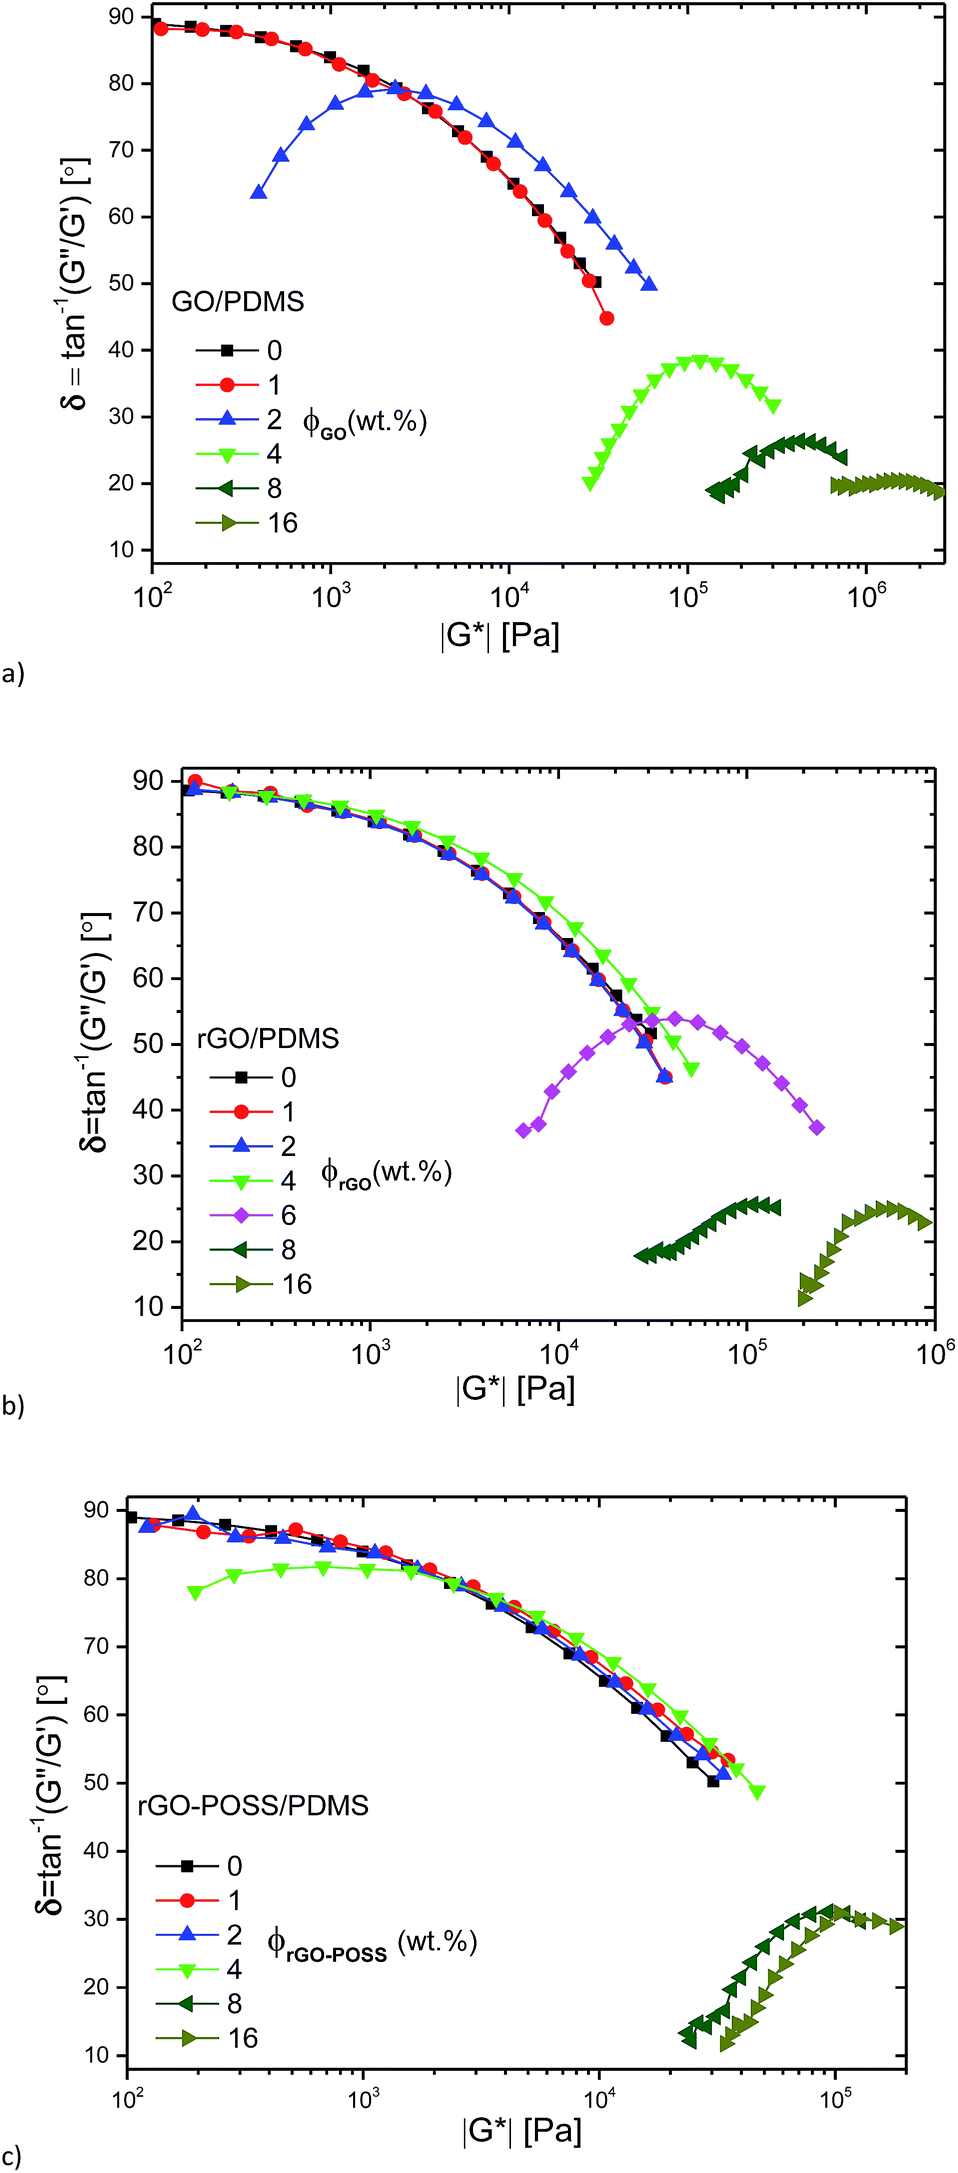 | ||
| Fig. 6 δ(|G*|)-plots for the GO/PDMS (a), the rGO/PDMS (b), the rGO–POSS/PDMS (c) at different GO, rGO, rGO–POSS concentrations. | ||
The curve shapes for the data in the intermediate and low concentration regime as defined above are in close agreement with the data published by Abdel-Goad et al.41 for nanocomposites with expanded graphite, suggesting that our nanofillers are significantly more efficient in this aspect than classical graphitic fillers. The data are also quite similar to nanocomposites with surface polystyrene grafted graphene.39,40,56
Fig. 7a–c shows the loss factor tanδ for the 6 lowest frequencies measured as a function of filler concentration. It is clear that the data for the three families of nanocomposites have a system-specific crossover at ca. 1.7 wt%, 5.5 wt%, and 3.5 wt% for GO, rGO, and rGO–POSS as filler, respectively. This plot has been proposed as an alternative method to assess the gelation point43,57,58 and has been successfully applied to nanocomposites as well.59 However, unlike for some previous literature reports, the crossover of the different frequencies does not occur at tanδ ≈ 1 but at tanδ ≈ 6–8, particularly for GO and rGO–POSS. This could indicate that the graphene based nanocomposites synthesized here have a significant bonding tendency even at very low concentration, while the behavior is still to a large extent dominated by the matrix.
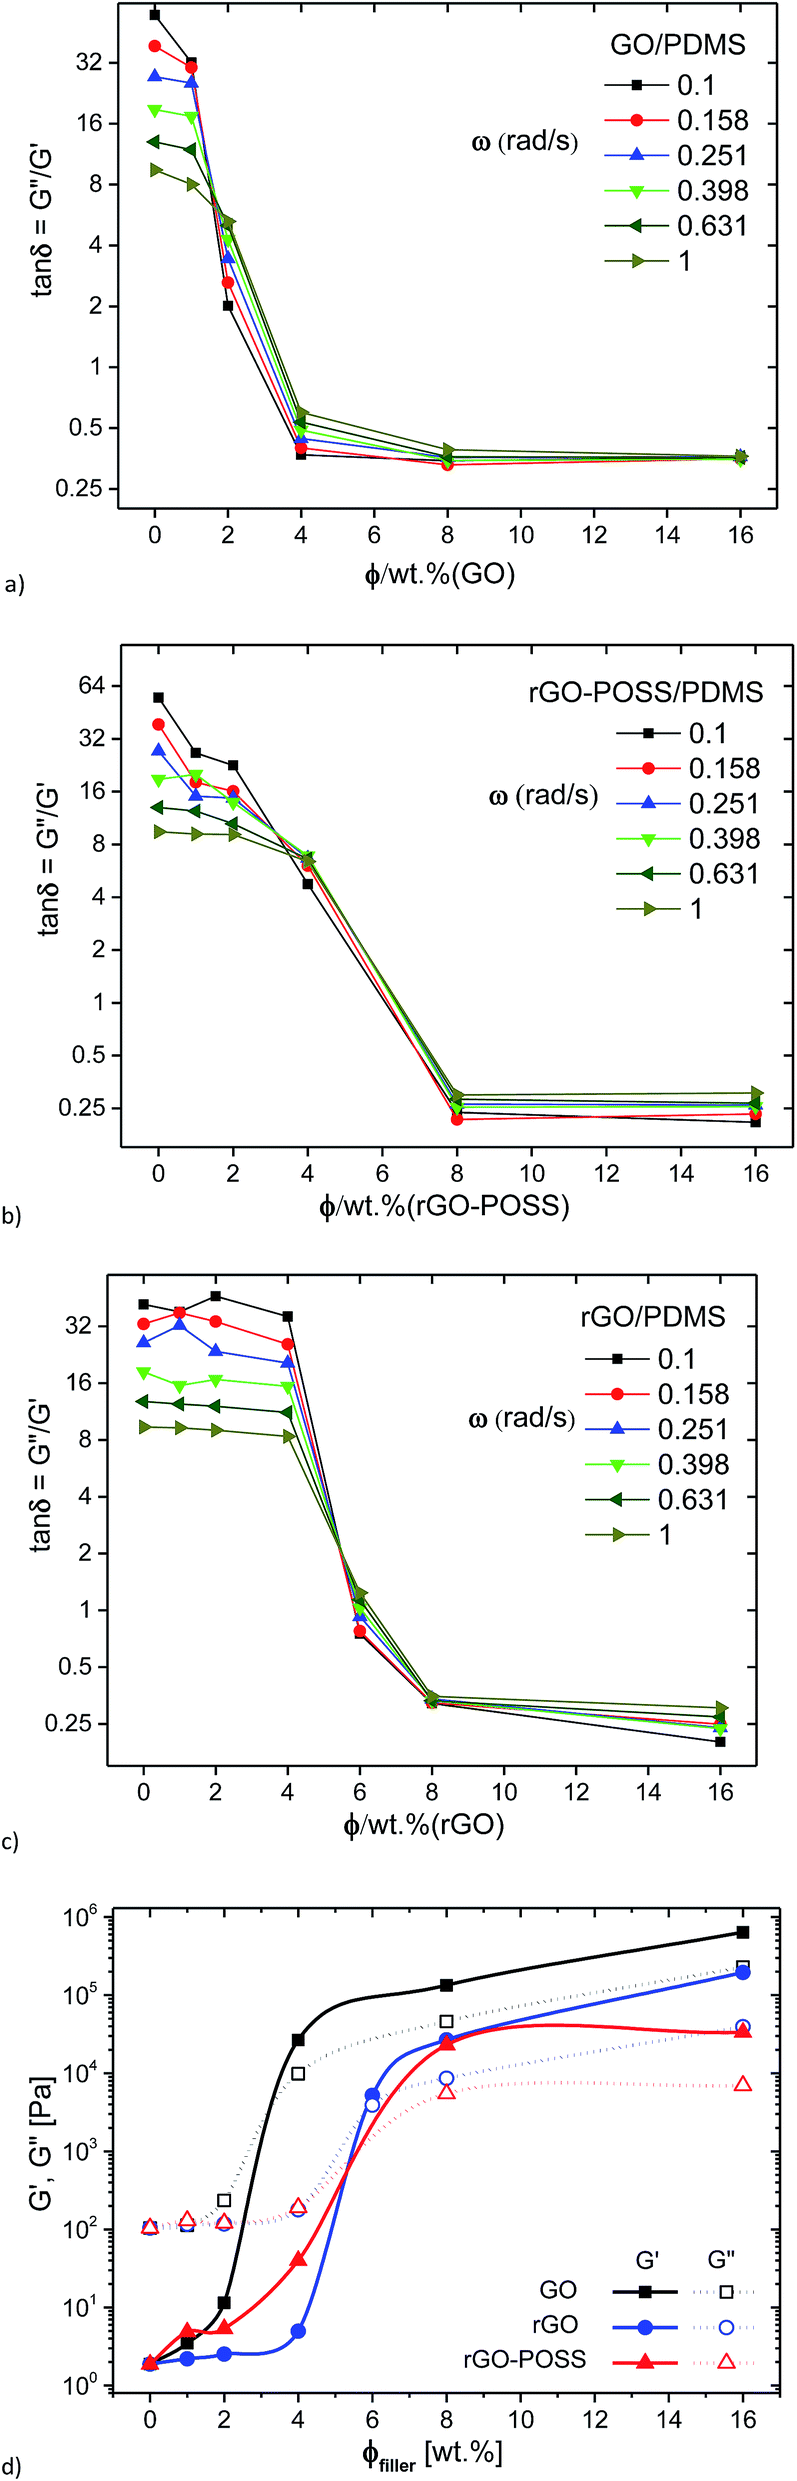 | ||
| Fig. 7 Dynamic viscoelastic curves of the loss factor tanδ as a function of concentration for the GO/PDMS (a), the rGO/PDMS (b), the rGO–POSS/PDMS (c) at different GO, rGO, rGO–POSS concentrations; and G′, G′′ (ω = 0.1 rad s−1) as function of GO, rGO, rGO–POSS filler weight concentration (d) (T = 20 °C). | ||
For comparison, the G′(ω = 0.1 rad s−1) and G′′(ω = 0.1 rad s−1) are plotted as a function of filler content in Fig. 7d. For GO, a clear upturn is found for G′ and G′′ between GO-contents of 2 and 4 wt%, suggesting that the rheological percolation threshold is between these two concentrations. The behavior for the rGO-system is quite similar to that of the GO-system, but herein the percolation is found between 4 and 8 wt% with 6 wt% showing the intermediate critical gel structure mentioned before with G′ ≈ G′′. As an additional finding, the modulus for the GO-system at high concentrations is higher than that of the rGO-system at the same concentrations. One might attribute this to the lower percolation threshold of the former. On normalizing the behavior by creating a difference in percolation concentration by an approximate factor of 2, it becomes clear that the data overlap each other approximately. Hence, we can say that the hydrophilic GO is twice as effective as a filler as the hydrophobic rGO when embedded in the hydrophobic matrix PDMS. For the rGO–POSS-system, the data look relatively similar to those for the rGO-case, but the data are more smeared out in comparison, i.e. the transition between liquid- and solid-like behavior is much more gradual than for the simpler rGO-system.
Hence, the crossover concentrations with these 2 methods (tanδ(ω) vs. c) and G′(ω = 0.1 s−1)/G′′(ω = 0.1 s−1) = (tanδ(ω = 0.1 s−1) = 1 vs. c) lead to different values with the frequency dependent crossover method (Fig. 7a–c), leading to lower percolation concentrations. This suggests that the percolation of the nanofillers actually occurs before their dynamics completely take over the mechanical response of the nanocomposites. Such a behavior could be indicative of the formation of a labile long-range order – too weak to completely dominate the behavior but strong enough to be measurable even at lower concentration.
As we know, the two-dimensional GO nanosheets contain numerous oxygen containing functional groups such as epoxy, carboxyl, and hydroxyl groups,60 and hence GO has a poor compatibility in non-polar silicone oil (PDMS) and, consequently, the GO-sheets tend to interact with each other more strongly than rGO and rGO–POSS. However, the oxygen groups on the GO-surface prevent a restacking as happens partially for graphene species with less oxygen and without sterically hindering groups, disturbing the ideal 2D-structure of graphene. Hence, it is unlikely to get a graphite-like structure from GO but at the same time, the hydrophobicity of the PDMS leads to a thermodynamic tendency of GO to self-assemble, which could be part of the reason why the rheological percolation limit is lower for GO than for rGO and rGO–POSS.
However, another reason also certainly plays a role in the percolation limit. It is well-known that the chemical reduction of GO leads to a reduction of the size of the rGO-sheets (in comparison to unreduced GO). Clearly, it is statistically more likely to reach a neighboring graphene sheet when the size in 2D is larger. However, at the same time the number of particles is also lower. Hence, this argument is opposite for 2D-materials and classical 3D fillers, where the percolation threshold is decreased for larger particles.
The phase separation inevitably occurs, which might enhance the mechanical properties. As for rGO nanosheets, they possess good dispersion stability in PDMS due to fewer hydrophilic groups on the nanosheets after reducing, and the POSS modified rGO sheets have better dispersion stability in PDMS due to the good compatibility of POSS and PDMS;61 therefore, it is not easy for rGO and rGO–POSS nanosheets to stack together and aggregate to network structure in PDMS. Particle size of GO is large due to stacking or aggregation, while the particle sizes of rGO (Fig. SI3†) and rGO–POSS are very small due to their high dispersability in PDMS. Particularly for rGO–POSS, the interlayer distance of its composites is larger because of larger molecules of POSS grafted onto the rGO sheet due to the crosslinking.
Conclusions
A hydrophobic GO-based silsesquioxane-crosslinked network was prepared by clicking azide-modified POSS and alkyne-decorated GO. To achieve maximum crosslinking points, all the oxygen functionalities of GO were converted to alkyne moieties. The crosslinking was confirmed by various characterization methods such as FTIR, Raman, TGA, SEM, and XRD. This novel network has remarkably higher thermal stability than GO, and the absence of weight loss due to adsorbed water in TGA of rGO–POSS as well as its high solubility in organic solvents such as THF, chloroform, acetone, and DMF indicates the hydrophobicity of this nanohybrid.The rheological behavior of the rGO–POSS composites in PDMS was compared with those of GO and rGO. While GO shows a much stronger network forming tendency, the rGO-composites are less willing to form a network, hence, leading to a higher percolation threshold, respectively. The differences in percolation threshold can be explained by 2 effects. First, GO sheets are larger than rGO sheets since reducing agents also break the GO-sheets apart in smaller fragments as a side effect.62 Furthermore, the hydrophilicity of the GO-sheets gives them a stronger self-aggregation tendency in highly hydrophobic media, such as PDMS. The fact that rGO–POSS composites show a stronger tendency to percolate rheologically suggests that the functionalization with POSS has a positive effect on the filler efficiency. After all, one has to remember that ca. 28 wt% POSS (including the organic linking groups and side groups) is contained in rGO–POSS. Hence, 28 wt% less rGO-sheets are present for rGO–POSS composites than for rGO-composites with the same filler content. Nevertheless, the rheological data clearly show that rGO–POSS is rheologically more efficient than rGO. The conclusion from this is that rGO–POSS possesses advantages over rGO as a filler. Most likely, the POSS-particles roughening the rGO-surface in rGO–POSS lead to a reduced tendency to restack into graphite-like structures, which ultimately would mean going from a nanocomposite to a microcomposite. This is in agreement with previous reports on interactions between fillers and polymers, which also suggests that the dispersion of the fillers (GO, rGO, rGO–POSS) is rather good, considering that the effects are found at a significantly lower concentration than they would be found for microfillers. For example, Schmidt and Münstedt37 found that suspensions of 35 vol% glass spheres with 1.2 μm diameter in polyisobutylene have an impact on rheological properties somewhat less than 4 wt% rGO–POSS. However, looking at reports on graphene polymer composites, such as that by Ratzsch et al.,59 it becomes clear that the effects occur in the same range, thus, indicating a good dispersion.
In summary, the synthesis of nanohybrids of rGO and POSS has led to nanoparticles with interesting novel properties, which have the clear advantage of being easily dispersible in comparison to classical graphenic nanofillers due to the POSS-induced surface roughness, preventing aggregation.
Acknowledgements
The authors would like to thank the National Science Foundation of China (21574086), the Nanshan District Key Lab for Biopolymers and Safety Evaluation (No. KC2014ZDZJ0001A), the Shenzhen Sci & Tech research grant (ZDSYS201507141105130) and the Shenzhen City Science and Technology Plan Project (JCYJ20140509172719311) for financial support.References
- K. S. Novoselov, A. K. Geim, S. V. Morozov, D. Jiang, Y. Zhang, S. V. Dubonos, I. V. Grigorieva and A. A. Firsov, Science, 2004, 306, 666–669 CrossRef CAS PubMed.
- V. Georgakilas, J. N. Tiwari, K. C. Kemp, J. A. Perman, A. B. Bourlinos, K. S. Kim and R. Zboril, Chem. Rev., 2016, 116, 5464–5519 CrossRef CAS PubMed.
- E. Araque, R. Villalonga, M. Gamella, P. Martínez-Ruiz, A. Sánchez, V. García-Baonza and J. M. Pingarrón, ChemPlusChem, 2014, 79, 1334–1341 CrossRef CAS.
- D. R. Dreyer, S. Park, C. W. Bielawski and R. S. Ruoff, Chem. Soc. Rev., 2010, 39, 228–240 RSC.
- X. Zhang, A. Ciesielski, F. Richard, P. Chen, E. A. Prasetyanto, L. De Cola and P. Samorì, Small, 2016, 12, 1044–1052 CrossRef CAS PubMed.
- Y.-Q. Li, T. Yu, T.-Y. Yang, L.-X. Zheng and K. Liao, Adv. Mater., 2012, 24, 3426–3431 CrossRef CAS PubMed.
- X. Ou, P. Chen, L. Jiang, Y. Shen, W. Hu and M. Liu, Adv. Funct. Mater., 2014, 24, 543–554 CrossRef CAS.
- Y. Cui, Q.-Y. Cheng, H. Wu, Z. Wei and B.-H. Han, Nanoscale, 2013, 5, 8367–8374 RSC.
- H. C. Kolb, M. G. Finn and K. B. Sharpless, Angew. Chem., Int. Ed., 2001, 40, 2004–2021 CrossRef CAS PubMed.
- U. Tunca, J. Polym. Sci., Part A: Polym. Chem., 2014, 52, 3147–3165 CrossRef CAS.
- M. Namvari and H. Namazi, Int. J. Environ. Sci. Technol., 2014, 11, 1527–1536 CrossRef CAS.
- M. Namvari and H. Namazi, Carbohydr. Res., 2014, 396, 1–8 CrossRef CAS PubMed.
- M. Namvari and H. Namazi, J. Mater. Sci., 2015, 50, 5348–5361 CrossRef CAS.
- M. Namvari, C. S. Biswas, M. Galluzzi, Q. Wang, B. Du and F. J. Stadler, Sci. Rep., 2017, 7, 44508 CrossRef CAS PubMed.
- M. Namvari and H. Namazi, Int. J. Environ. Sci. Technol., 2016, 13, 599–606 CrossRef CAS.
- M. Namvari and H. Namazi, Polym. Int., 2014, 63, 1881–1888 CrossRef CAS.
- W. Tang and M. L. Becker, Chem. Soc. Rev., 2014, 43, 7013–7039 RSC.
- Z.-B. Zhang, J.-J. Wu, Y. Su, J. Zhou, Y. Gao, H.-Y. Yu and J.-S. Gu, Appl. Surf. Sci., 2015, 332, 300–307 CrossRef CAS.
- H. Lin, S. Yuyang, J. Guixiang, L. Wei, H. Huili, F. Qianhua, R. Junxiao, Y. Yujie, W. Yongchao, S. Jinjin and Z. Zhenzhong, Nanotechnology, 2016, 27, 315105 CrossRef PubMed.
- Y. Xue, H. Wang, D. Yu, L. Feng, L. Dai, X. Wang and T. Lin, Chem. Commun., 2009, 6418–6420, 10.1039/b911509a.
- S. K. Yadav, S. S. Mahapatra, H. J. Yoo and J. W. Cho, Nanoscale Res. Lett., 2011, 6, 122 CrossRef PubMed.
- Y. Xue, H. Wang, Y. Zhao, L. Dai, L. Feng, X. Wang and T. Lin, Adv. Mater., 2010, 22, 4814–4818 CrossRef CAS PubMed.
- F. Alves, P. Scholder and I. Nischang, ACS Appl. Mater. Interfaces, 2013, 5, 2517–2526 CAS.
- I. Nischang, O. Brüggemann and I. Teasdale, Angew. Chem., Int. Ed., 2011, 50, 4592–4596 CrossRef CAS PubMed.
- H. Lin, J. Ou, Z. Liu, H. Wang, J. Dong and H. Zou, J. Chromatogr. A, 2015, 1379, 34–42 CrossRef CAS PubMed.
- S. Shen, F. Ye, C. Zhang, Y. Xiong, L. Su and S. Zhao, Analyst, 2015, 140, 265–271 RSC.
- I. Arslan and M. A. Tasdelen, Des. Monomers Polym., 2016, 19, 155–160 CrossRef CAS.
- F. Alves and I. Nischang, Polym. Chem., 2015, 6, 2183–2187 RSC.
- W. Bai, Q. Sheng and J. Zheng, Talanta, 2016, 150, 302–309 CrossRef CAS PubMed.
- Y. Xue, Y. Liu, F. Lu, J. Qu, H. Chen and L. Dai, J. Phys. Chem. Lett., 2012, 3, 1607–1612 CrossRef CAS PubMed.
- P. Zong, J. Fu, L. Chen, J. Yin, X. Dong, S. Yuan, L. Shi and W. Deng, RSC Adv., 2016, 6, 10498–10506 RSC.
- W.-H. Liao, S.-Y. Yang, S.-T. Hsiao, Y.-S. Wang, S.-M. Li, C.-C. M. Ma, H.-W. Tien and S.-J. Zeng, ACS Appl. Mater. Interfaces, 2014, 6, 15802–15812 CAS.
- L. Yizhuo, G. Yanqing, L. Yang, Y. Jianbo and Z. Xiaopeng, Nanotechnology, 2016, 27, 195702 CrossRef PubMed.
- J. Dealy and J. Wang, Melt Rheology and its Applications in the Plastics Industry, Springer, 2013 Search PubMed.
- Y. H. Hyun, S. T. Lim, H. J. Choi and M. S. Jhon, Macromolecules, 2001, 34, 8084–8093 CrossRef CAS.
- B. Hoffmann, C. Dietrich, R. Thomann, C. Friedrich and R. Mulhaupt, Macromol. Rapid Commun., 2000, 21, 57–61 CrossRef CAS.
- M. Schmidt and H. Münstedt, Rheol. Acta, 2002, 41, 193–204 CrossRef CAS.
- H. Muenstedt, N. Katsikis and J. Kaschta, Macromolecules, 2008, 41, 9777–9783 CrossRef CAS.
- F. Beckert, C. Friedrich, R. Thomann and R. Mulhaupt, Macromolecules, 2012, 45, 7083–7090 CrossRef CAS.
- F. Beckert, A. Held, J. Meier, R. Mulhaupt and C. Friedrich, Macromolecules, 2014, 47, 8784–8794 CrossRef CAS.
- M. Abdel-Goad, P. Pötschke, D. H. Zhou, J. E. Mark and G. Heinrich, J. Macromol. Sci., Part A: Pure Appl.Chem., 2007, 44, 591–598 CrossRef CAS.
- D. Zhou, Q.-Y. Cheng, Y. Cui, T. Wang, X. Li and B.-H. Han, Carbon, 2014, 66, 592–598 CrossRef CAS.
- H. H. Winter and M. Mours, Adv. Polym. Sci., 1997, 134, 165–234 CrossRef CAS.
- A. GhavamiNejad, S. Hashmi, H. I. Joh, S. Lee, Y. S. Lee, M. Vatankhah-Varnoosfaderani and F. J. Stadler, Phys. Chem. Chem. Phys., 2014, 16, 8675–8685 RSC.
- S. Hashmi, A. GhavamiNejad, F. J. Stadler and D. Wu, Soft Matter, 2015, 11, 1315–1325 RSC.
- K. P. Loh, Q. Bao, P. K. Ang and J. Yang, J. Mater. Chem., 2010, 20, 2277–2289 RSC.
- K.-W. Park, J. Mater. Chem. A, 2014, 2, 4292–4298 CAS.
- Z. Ge, D. Wang, Y. Zhou, H. Liu and S. Liu, Macromolecules, 2009, 42, 2903–2910 CrossRef CAS.
- J. Zhang, H. Yang, G. Shen, P. Cheng, J. Zhang and S. Guo, Chem. Commun., 2010, 46, 1112–1114 RSC.
- D. Konios, M. M. Stylianakis, E. Stratakis and E. Kymakis, J. Colloid Interface Sci., 2014, 430, 108–112 CrossRef CAS PubMed.
- G. T. S. How, A. Pandikumar, H. N. Ming and L. H. Ngee, Sci. Rep., 2014, 4, 5044 CAS.
- G. Mittal, V. Dhand, K. Y. Rhee, S.-J. Park and W. R. Lee, J. Ind. Eng. Chem., 2015, 21, 11–25 CrossRef CAS.
- R. Niu, J. Gong, D. H. Xu, T. Tang and Z. Y. Sun, Polymer, 2014, 55, 5445–5453 CrossRef CAS.
- S. Trinkle and C. Friedrich, Rheol. Acta, 2001, 40, 322–328 CrossRef CAS.
- F. J. Stadler and T. Mahmoudi, Korea Aust. Rheol. J., 2011, 23, 185–193 CrossRef.
- F. Beckert, A. M. Rostas, R. Thomann, S. Weber, E. Schleicher, C. Friedrich and R. Mülhaupt, Macromolecules, 2013, 46, 5488–5496 CrossRef CAS.
- M. Dumitras and C. Friedrich, J. Rheol., 2004, 48, 1135–1146 CrossRef CAS.
- Y. Aoki, L. Li and M. Kakiuchi, Macromolecules, 1998, 31, 8117–8123 CrossRef CAS.
- K. F. Ratzsch, V. Cecen, F. Tolle, K. A. Wartig, R. Thomann, R. Mulhaupt and C. Friedrich, Macromol. Mater. Eng., 2014, 299, 1134–1144 CAS.
- W. Cai, R. D. Piner, F. J. Stadermann, S. Park, M. A. Shaibat, Y. Ishii, D. Yang, A. Velamakanni, S. J. An and M. Stoller, Science, 2008, 321, 1815–1817 CrossRef CAS PubMed.
- J. Yin, R. Chang, Y. Kai and X. Zhao, Soft Matter, 2013, 9, 3910–3914 RSC.
- Z. Bo, X. Shuai, S. Mao, H. Yang, J. Qian, J. Chen, J. Yan and K. Cen, Sci. Rep., 2014, 4, 4684 Search PubMed.
Footnote |
| † Electronic supplementary information (ESI) available. See DOI: 10.1039/c7ra02764h |
| This journal is © The Royal Society of Chemistry 2017 |