
 Open Access Article
 This Open Access Article is licensed under a Creative Commons Attribution-Non Commercial 3.0 Unported Licence
Palladium–nickel catalysts based on ordered titanium dioxide nanorod arrays with high catalytic peformance for formic acid electro-oxidation†
Shangfeng Jiangab,
Baolian Yia,
Qing Zhaoab,
Hongmei Yu *a and
Zhigang Shao*a
*a and
Zhigang Shao*a
aFuel Cell System and Engineering Laboratory, Dalian Institute of Chemical Physics, Chinese Academy of Sciences, 457 Zhongshan Road, Dalian 116023, PR China. E-mail: hmyu@dicp.ac.cn; zhgshao@dicp.ac.cn
bUniversity of Chinese Academy of Sciences, Beijing 100039, PR China
First published on 16th February 2017
Abstract
Ordered titanium dioxide nanorod arrays are prepared by a hydrothermal method and applied to the catalyst supports of the palladium–nickel catalysts (Pd2Ni3–TiO2) for formic acid oxidation. Due to the three-dimensional catalytic structure and alloying effect, the Pd2Ni3–TiO2 exhibits superior mass activity and long-term stability than those of Pd–TiO2 and commercial PdC catalysts. The present work opens a new approach to design catalysts with superior catalytic performance and durability for direct formic acid fuel cells with three-dimensional catalytic structure.
Introduction
Direct formic acid fuel cells (DFAFCs) have potential to serve as promising power sources for portable electronics, due to their relatively high power density, low fuel crossover, and low pollutant emission.1,2 However, the development of DFAFCs is hindered by the sluggish formic acid electro-oxidation (FAO) and low durability of catalysts.3,4 It is known that the Pt-based catalysts are not suitable as the catalysts of FAO, because the catalysts are easily poisoned by CO during the FAO. Pd-based catalysts are believed to be more suitable for FAO due to their lower adsorption of CO intermediates in catalyzing formic acid.5–7 Nevertheless, the electrochemical activity and stability of Pd-based catalysts should be improved. Increasing the activity of Pd-based catalysts will lead to a low dosage of Pd in practical utilization.Previous studies have proven that controlling the sizes and morphologies of Pd-based catalysts is an effective way to improve the catalytic performance for FAO. Several Pd-based catalysts have been demonstrated, such as Pd nanowires,8 Pd nanorods,9 and the combination of Pd with transition metals (e.g., Ni, Co, Fe, Cu), Ag or P to form bimetallic compounds.10–16 Nevertheless, the catalytic structure and the support material also have an impact on the catalytic activity of the electrocatalysts.17 Metal oxides can be used as the support materials in fuel cells, due to their high corrosion resistance, reasonable surface area, and mechanical strength.18,19 Among them, Ti-based oxides has been applied as the catalyst support material of fuel cells. Subramanian et al. applied anodized TiO2 nanotubes (T_NT) as the Pt support for simultaneous FAO and photo-assisted FAO, which generates around 39-fold higher current density than that of the pure T_NT.20 Xing et al. investigated the fine-tuned pore structured TiO2–C as the Pt or Pd catalyst supports for the electro-oxidation of methanol or formic acid, which showed a much superior catalytic performance than that of the carbon support.21
Based on the above considerations, we present TiO2 NRs as the catalyst supports of Pd-based catalysts. To the best of our knowledge, the Pd-based alloy nanoparticles supported on the TiO2 NRs are rarely reported as the catalysts toward FAO. The advantages of this approach are listed: (1) high transport rate of HCOOH; (2) high electrochemical surface area (ECSA) and high utilization of electrocatalysts; (3) direct charge carrier transport pathways. More importantly, we combine high catalytic activity and advanced catalytic structure to show the highest electrochemical activity. Compared with the commercial PdC catalyst and pure Pd–TiO2 catalysts, the Pd2Ni3–TiO2 catalyst exhibited higher electrochemical activity and stability.
Experimental
Preparation of TiO2 NRs
Oriented TiO2 NRs were hydrothermally grown on carbon fibers by a seed-assisted method and the details of the preparation process are shown in the previous report.22,23 There are two key points for the formation of the oriented TiO2 NRs, which are exactly controlling the concentration of the titanium(IV) chloride aqueous solution and tetrabutyl titanate (TBT) solution.Preparation of the PdNi–TiO2 and Pd–TiO2
For the preparation of the PdNi–TiO2 electrode, Ni and Pd catalysts were sputtered onto the TiO2 NRs by physical vapor deposition (PVD) in a row and the whole sputtering time was maintained for 15 min and 6 min, respectively. After that, to increase the crystal size of the catalysts, the as-prepared samples were heat-treated at 300 °C under 5% H2/Ar gas for 2 h. For the preparation of Pd–TiO2 NRs, the preparation process was similar to that of PdNi–TiO2 NRs without Ni deposition.Physical characterization
Field-emission scanning electron microscopy (FESEM, Zeiss supra 55) and transmission electron microscopy (TEM, JEM-2000EX) are employed to observe the morphology of the as-prepared samples. High-resolution transmission electron microscopy (HRTEM, JEM-2100F) characterization and energy-dispersive X-ray (EDX) analysis were conducted using FEITecani G2F30 microscopy operating at 300 kV. The crystal phases of the samples were monitored by X-ray diffraction (XRD, BrukerD8, Cu Kα radiation). X-ray photoelectron spectroscopy (XPS, Thermo Scientific ESCALab 250 Xi spectrometer, Al Kα in twin anode) was used to measure the chemical state of all the samples. Inductively coupled plasma-optical emission spectroscopy (ICP-OES, PerkinElmer 7300DV, USA) was applied to determine the metal loadings in the samples.Electrochemical characterization
The electrochemical properties of all the samples were measured using a conventional three-electrode cell at room temperature. The PdNi–TiO2 NRs, Pd–TiO2 NRs, and a commercial PdC (BASF, 20% PdC) based electrode were used as the working electrodes. A saturated calomel electrode (SCE) and a Pt-foil served as the reference electrode and the counter electrode, respectively. The PdNi–TiO2 NRs and Pd–TiO2 NRs are directly used as the working electrode without additional Nafion ionomer. The commercial PdC based electrode was prepared by spraying the commercial PdC and Nafion ionomer (I/C = 0.5) on a commercial gas diffusion layer (GDL). Prior to all the experiments, the mixture was saturated with N2 gas. Cyclic voltammetry (CV) and chronoamperometric (CA) experiments were carried out in a mixture including 0.5 M H2SO4 + 0.5 M HCOOH. CV curves were tested at the potential window between 0–1.0 V (vs. SCE) with the sweeping rate of 50 mV s−1. CA curves were recorded at 0.55 V (vs. SCE) and maintained for 4000 s.Results and discussion
TiO2 NRs were directly grown on carbon paper by a hydrothermal method.22–24 PdNi–TiO2 NRs and Pd–TiO2 NRs were deposited onto the TiO2 NRs by PVD and heat-treated in 5% H2/Ar gas. Here the carbon paper is employed as a current collector, and the as-prepared electrodes can potentially be used as an anodic electrode of DFAFCs directly.The XRD analysis was first applied to monitor the corresponding crystal phase of all the samples and is displayed in Fig. 1. The as-prepared products are mainly composed of rutile TiO2 phases according to JCPDS 21-1276. The Ti 2p XPS spectrum of the as-prepared sample is shown in Fig. S2.† The binding energies of Ti 2p1/2 and Ti 2p3/2 are 458.58 eV and 464.38 eV, respectively. Since the binding energy of Ti4+ is 458.5 eV, the XPS data prove the presence of TiO2. After deposition of the Pd and PdNi nanoparticles, the (111) peak for the Pd–TiO2 and PdNi–TiO2 is obviously in the XRD pattern (Fig. 1). Due to the low metal content in the products, the diffraction peaks of the (200), and (220) planes of the Pd-based catalysts are not specified in the XRD patterns.
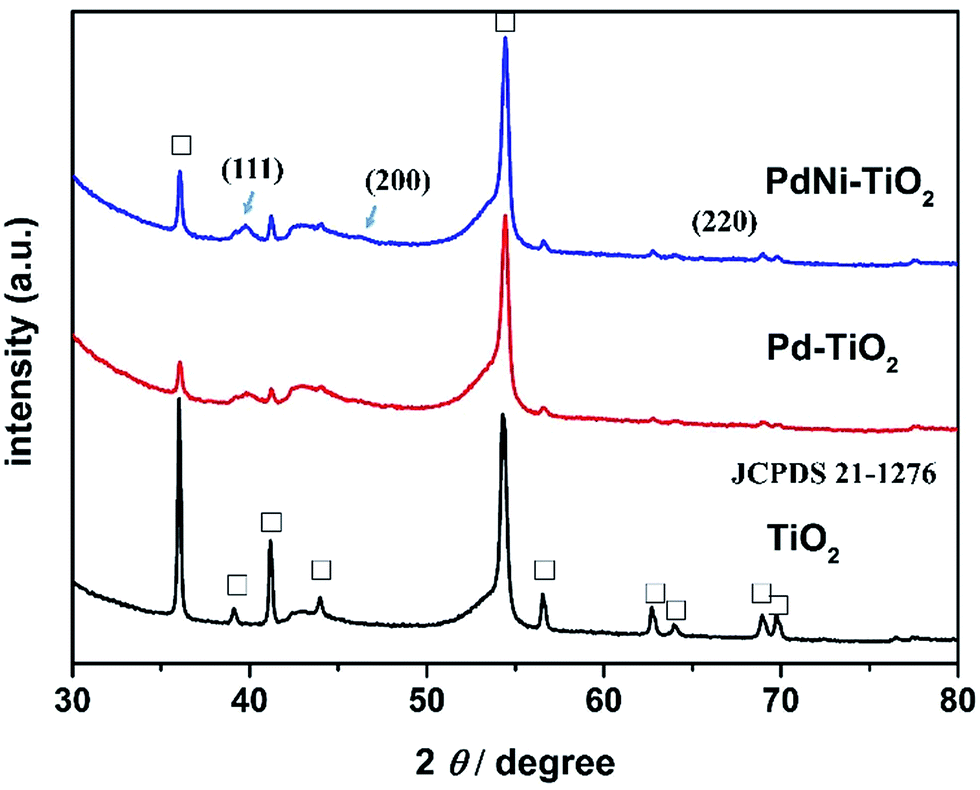 | ||
| Fig. 1 XRD patterns of TiO2, Pd–TiO2, and PdNi–TiO2. | ||
FESEM images of Pd–TiO2 NRs and PdNi–TiO2 NRs grown on carbon paper are shown in Fig. 2a and b (inset). The oriented TiO2 nanorods grew on the surface of carbon fibres, and the mean diameters of the TiO2 nanorods are about 120 nm (Fig. S1†). After deposition of the Pd-based catalysts onto the TiO2 NRs, the resulting samples are heat-treated in 5% H2/Ar gas at 300 °C for 2 h. The morphology and structure of the as-prepared samples are not obviously changed compared with that of TiO2 NRs. The TEM image of a TiO2 nanorod shows that the surface of the TiO2 nanorod is smooth (Fig. 2c). The Pd nanoparticles and PdNi nanoparticles are dispersed on the TiO2 nanorod (Fig. 2d and e) and the size distributions of the Pd and PdNi nanoparticles are shown in Fig. 2d and e (inset) and S3.† Fig. 2d and e show that the mean sizes of the Pd and PdNi catalysts are about 3.52 nm and 4.24 nm, respectively. However, the sizes of some other PdNi particles are about 20 nm (Fig. S3†), which are larger than Pd nanoparticles. The average sizes of the Pd and PdNi catalysts according to XRD are 6.09 nm and 7.53 nm, respectively, which are larger than the particle sizes of the Pd-based catalysts. Since the general detection depth of XRD measurements is around 10 nm, the composition detected by XRD indicates both surface and bulk atoms of the Pd-based catalysts.
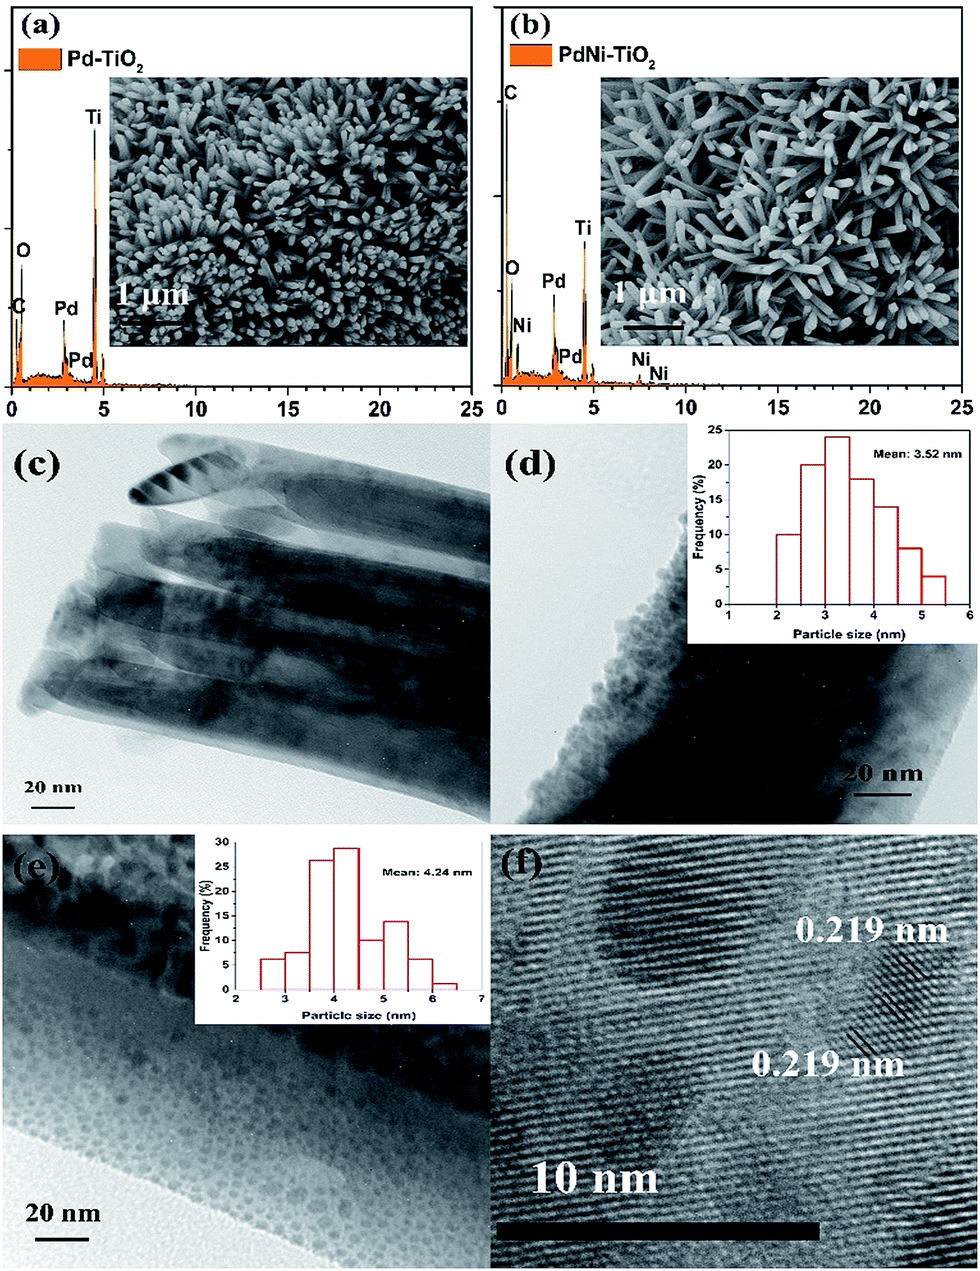 | ||
| Fig. 2 FESEM images and EDX spectra of Pd–TiO2 NRs (a) and PdNi–TiO2 NRs (b); TEM images of TiO2 (c), Pd–TiO2 (d) and PdNi–TiO2 (e); and HRTEM image of PdNi–TiO2. The inset pictures in (d) and (e) are the size distributions of Pd and PdNi catalysts, respectively. | ||
The HR-TEM image reveals that the PdNi particles are crystalline and the lattice structure is clear (Fig. 2f). The (111) lattice spacing of the PdNi nanoparticles was measured to be 0.219 nm, which is between that of Pd (0.223 nm) and Ni (0.20 nm), confirming the formation of PdNi alloy in the as-prepared samples.25 EDX analysis was also carried out to measure the composition of the PdNi–TiO2 catalysts. The spectrum confirms that Pd and Ni elements exist in the PdNi nanoparticles and their atomic ratio is 1![[thin space (1/6-em)]](https://www.rsc.org/images/entities/char_2009.gif) :1.72 (Fig. S4†). In addition, the Pd and Ni content in the as-prepared samples is estimated by ICP-OES, and the results are 40.55 μg cm−2 and 14.4 μg cm−2, respectively. Thus, the atomic ratio of Pd and Ni in the PdNi–TiO2 catalysts is 1:1.55 according to the result of ICP-OES, which is consistent with the EDX data. Thus, the PdNi–TiO2 catalysts can be named as Pd2Ni3–TiO2 according to the data of ICP-OES. Meanwhile, the Pd loading of the Pd–TiO2 NRs is measured as 29.7 μg cm−2.
:1.72 (Fig. S4†). In addition, the Pd and Ni content in the as-prepared samples is estimated by ICP-OES, and the results are 40.55 μg cm−2 and 14.4 μg cm−2, respectively. Thus, the atomic ratio of Pd and Ni in the PdNi–TiO2 catalysts is 1:1.55 according to the result of ICP-OES, which is consistent with the EDX data. Thus, the PdNi–TiO2 catalysts can be named as Pd2Ni3–TiO2 according to the data of ICP-OES. Meanwhile, the Pd loading of the Pd–TiO2 NRs is measured as 29.7 μg cm−2.
XPS was applied to analyze the chemical states and electronic states of Pd and Ni in the as-prepared samples. The Pd 3d spectra for the PdNi–TiO2 NRs and Pd–TiO2 NRs are shown in Fig. 3a. The Pd 3d XPS spectra of Pd–TiO2 NRs show the binding energies of Pd0 3d (3d5/2 = 335.26 eV; 3d3/2 = 340.53 eV, Fig. 3a), which are slightly higher than those of bulk Pd (3d5/2 = 334.90 eV; 3d3/2 = 340.15 eV).26 The slight shift of binding energies of Pd0 to higher ones may be attributed to the significant interaction between Pd nanoparticles and TiO2 supports. Meanwhile, after the formation of PdNi alloys, the Pd 3d binding energy of Pd2Ni3–TiO2 NRs is shifted to a more negative position than that of Pd–TiO2 NRs. This shift may be attributed to the difference of the electronegativity between Pd and Ni, resulting in a partial electron transfer from Ni to Pd, which would change the penetration of outer electron density of Pd.27 Fig. 3b shows that Ni(OH)2 and NiOOH with obvious shake-up peaks can be seen at higher binding energies than those of the high-energy band (Ni 2p3/2) and the low-energy band (Ni 2p1/2).25
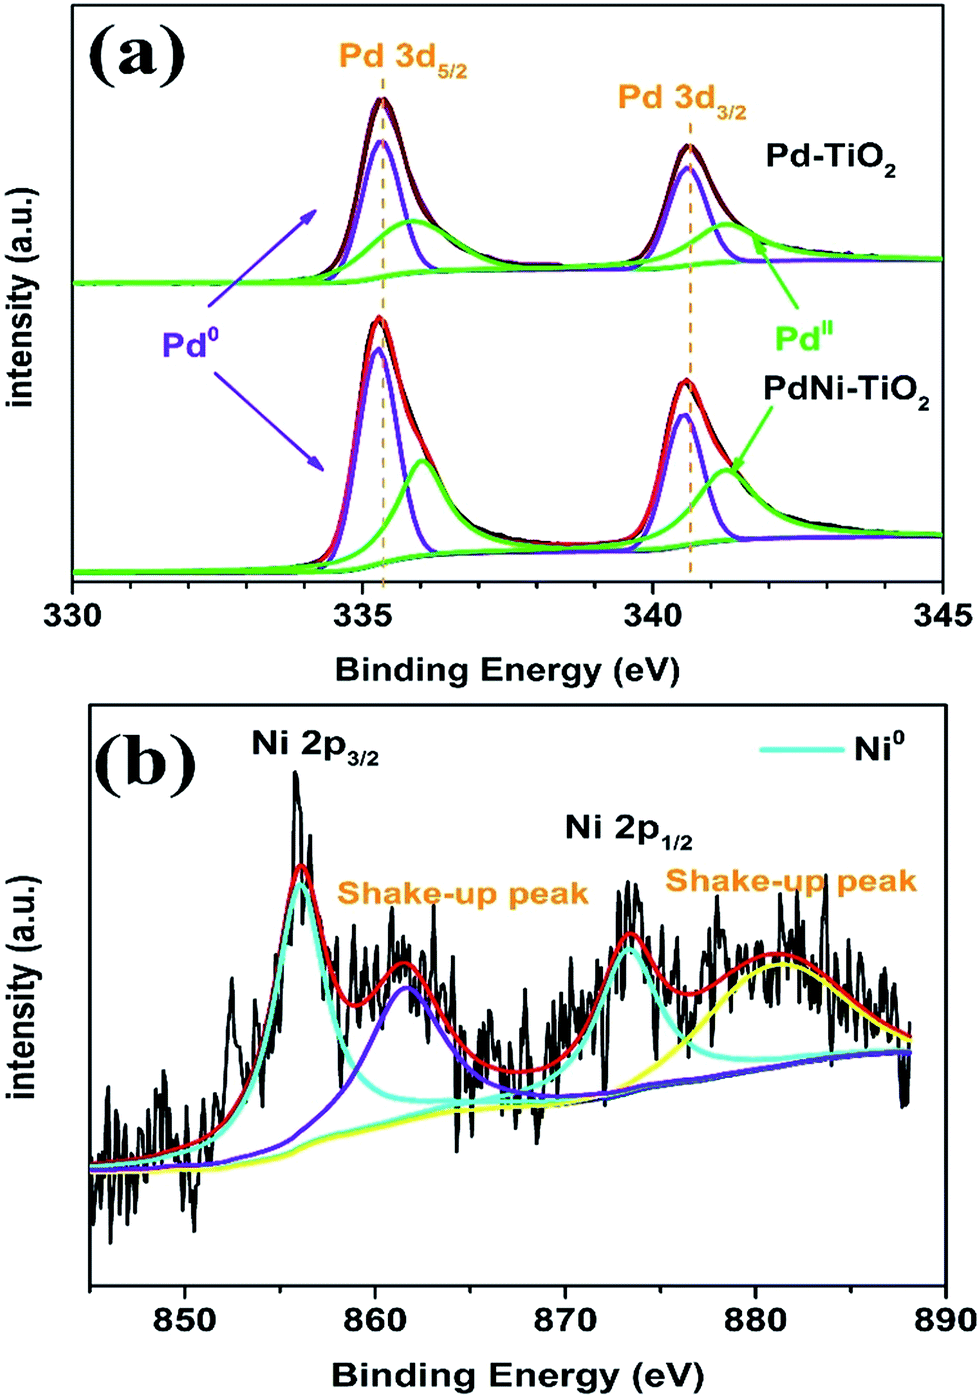 | ||
| Fig. 3 XPS spectra of (a) Pd 3d carried out on the Pd–TiO2 NRs and PdNi–TiO2 NRs and (b) Ni 2p carried out on the PdNi–TiO2 NRs. | ||
To investigate the electronic activity of the as-prepared Pd2Ni3–TiO2 NRs, we employed FAO as the model system, comparing with pure Pd–TiO2 NRs and commercial PdC. Typical Pd electrochemical behaviours of all the Pd-based electrocatalysts and the TiO2 sample were observed in 0.5 M H2SO4 (Fig. 4a and S5†). The ECSA was estimated according to the area of hydrogen adsorption peaks and the calculation equation is according to that previously reported.17,28,29 The CVs of Pd–TiO2, and Pd2Ni3–TiO2 are shown in Fig. 4a. The calculated ECSAs of Pd–TiO2, Pd2Ni3–TiO2, and commercial PdC are 53.6 m2 g−1, 43.6 m2 g−1, and 37.6 m2 g−1, respectively. Since some PdNi nanoparticles are larger than the Pd nanoparticles at the surface of the TiO2 nanorods, the ECSA of the Pd2Ni3–TiO2 NRs is smaller than that of the Pd–TiO2.
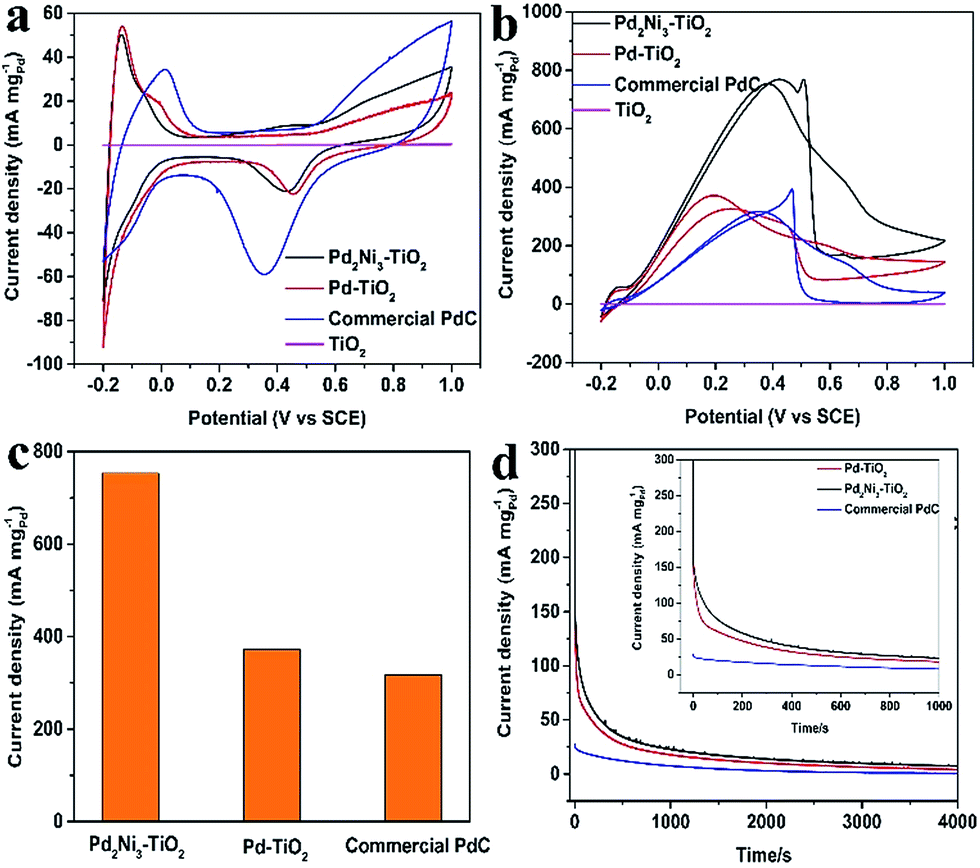 | ||
| Fig. 4 (a) CVs of Pd–TiO2, Pd2Ni3–TiO2, and commercial PdC in the 0.5 M H2SO4 solution at a sweeping rate of 50 mV s−1; (b) CVs of FAO of all samples in 0.5 M H2SO4 solution + 0.5 M HCOOH at the scan rate of 50 mV s−1; (c) the mass activity of different catalysts at the peak position; (d) CA curves of all samples in 0.5 M H2SO4 solution + 0.5 M HCOOH at 0.25 V. The unit of current density of the TiO2 sample is mA cm−2. | ||
The electrocatalytic properties of the Pd2Ni3–TiO2 catalysts towards FAO were investigated in a 0.5 M H2SO4 + 0.5 M HCOOH mixture. The electrocatalytic properties of the Pd–TiO2 and the commercial PdC toward FAO were measured for comparison. Fig. 4b shows the CV curves of FAO of different catalysts. All the current densities of FAO of different samples were normalized by Pd loading (mass activity). The TiO2 samples show no catalytic performance in the 0.5 M H2SO4 and 0.5 M H2SO4 containing 0.5 M HCOOH mixture (Fig. 4a, b, S5a and S4b†). Meanwhile, after deposition of Pd nanoparticles, the as-prepared Pd–TiO2 catalyst exhibits high catalytic activity as its mass density is 371.87 mA mg−1, which is around 1.17-fold higher than that of commercial PdC (Fig. 4c). The enhancement of the onset potential of the as-prepared Pd–TiO2 catalysts compared with the commercial PdC for FAO might be explained by the formation of a three-dimensional catalytic structure. The performance will be further improved by adding Ni element to Pd. Many studies shows that the highest FAO performance of a PdNi catalyst is when the atomic ratio of Pd and Ni is around 1:1.10,25,30 After alloying with Ni, the catalytic activity of Pd2Ni3–TiO2 is further improved (753.42 mA mgPd−1, Fig. 4b), indicating the electronic structure modification after Pd alloying with Ni, as demonstrated in the XPS analysis, which has been observed in many other Pd-based alloys.31 The FAO reaction occurs over the surface atom layer of the Pd-based catalysts for the test samples. With a similar amount of Pd–TiO2, Pd2Ni3–TiO2 shows better catalytic activity toward the FAO than Pd–TiO2. Ni element does not catalyze the FAO reaction, thus the Ni must be improving the catalytic activity of the Pd element toward FAO in such a way that the FAO rate is increased consequently.32 One possible effect is that the Pd surface electronic structure is perturbed by Ni.33 The d-band center of the catalysts will be altered and the electronic structure of the Pd surface layer will be affected by the formation of the PdNi alloy.34 During the FAO reaction, the HCOOad (HCOO–Pd) is formed firstly through breaking the O–H bond of HCOOH.35 The possible reaction steps are listed as follows.35,36
| HCOOH + Pd → HCOO–Pd + H+ + e− | (1) |
| HCOO–Pd → Pd–H + CO2 | (2) |
| Pd–H → Pd + H+ + e− | (3) |
After the Pd d-band center is shifted to an optimum value, the Pd-adsorbate bond strength will be optimized.32 We believe that the Pd d-band center is shifted to an optimum value after alloying with Ni, thus Pd2Ni3–TiO2 shows the best catalytic activity toward FAO. At the same time, the strong interactions between TiO2 and metals (strong metal–support interaction, SMSI) have been shown in previous research,37 thus the stability of the catalysts will be enhanced. Compared with the oxidation peak potential of formic acid in the literature,38 Pd2Ni3–TiO2 did not show excellent catalytic activity for FAO with a more positive oxidation peak potential, and the possible reason is the low electronic conductivity of TiO2 though oriented TiO2 NRs, which were hydrothermally grown on carbon fibers. Meanwhile, compared with the similar state-of-the-art Pd-based electrocatalysts, the as-prepared Pd2Ni3–TiO2 exhibits higher mass activity than most of them (Table S1†).
To further evaluate the surface poisoning, CA curves of Pd–TiO2, Pd2Ni3–TiO2, and commercial PdC were investigated in 0.5 M H2SO4 + 0.5 M HCOOH with the potential of 0.25 V for 4000 s during the measurements (Fig. 4d). It is obvious that the decrease in current density for the FAO on the Pd2Ni3–TiO2 NRs is slower than that of the Pd–TiO2 NRs and commercial PdC, which indicates its higher tolerance to the intermediaries during FAO. The improvement of the catalytic performance is possibly attributed to the alloying effect and the advanced catalytic structure.
Conclusions
In conclusion, we have designed and synthesized a three-dimensional catalytic structure based on TiO2 NRs. We found that Pd2Ni3–TiO2 catalysts show higher mass activity and higher durability than Pd–TiO2 catalysts and commercial PdC catalysts. Moreover, the improved catalytic activity of the Pd2Ni3–TiO2 catalyst is taking advantage of its unique three-dimensional structure and the alloying effect during FAO. In addition, this work provides a new avenue to design electrocatalysts with superior catalytic activity and stability for DFAFCs and they can be used as an electrode directly.Acknowledgements
We are thankful to the National Basic Research Program of China (973 program no. 2015CB932304), and the National Natural Science Foundations of China (no. 91434106, 21473197, 91434131, 61433013 and 21406218) for financial support.Notes and references
- X. Yu and P. G. Pickup, J. Power Sources, 2008, 182, 124–132 CrossRef CAS
.
- V. Mazumder and S. Sun, J. Am. Chem. Soc., 2009, 131, 4588–4589 CrossRef CAS PubMed
- E. Antolini, Energy Environ. Sci., 2009, 2, 915–931 CAS
- J. Tiwari, R. Tiwari, G. Singh and K. S. Kim, Nano Energy, 2013, 2, 553–578 CrossRef CAS
- L. Ying Zhang, Z. L. Zhao and C. M. Li, Nano Energy, 2015, 11, 71–77 CrossRef
- M. Rezaei, S. H. Tabaian and D. F. Haghshenas, J. Mater. Chem. A, 2014, 2, 4588–4597 CAS
- P. Kannan, T. Maiyalagan and M. Opallo, Nano Energy, 2013, 2, 677–687 CrossRef CAS
- J. Wang, Y. Chen, H. Liu, R. Li and X. Sun, Electrochem. Commun., 2010, 12, 219–222 CrossRef CAS
- T. C. An, W. B. Zhang, X. H. Zhu, Y. Xiong, G. Y. Sheng and J. M. Fu, Chin. J. Catal., 2003, 24, 338–342 CAS
- C. Du, M. Chen, W. Wang and G. Yin, ACS Appl. Mater. Interfaces, 2011, 3, 105–109 CAS
- K. C. Poon, B. Khezri, Y. Li, R. D. Webster, H. Su and H. Sato, Chem. Commun., 2016, 52, 3556–3559 RSC
- Y. Lu and W. Chen, J. Phys. Chem. C, 2010, 114, 21190–21200 CAS
- R. Li, Z. Wei, T. Huang and A. Yu, Electrochim. Acta, 2011, 56, 6860–6865 CrossRef CAS
- V. Mazumder, M. Chi, M. N. Mankin, Y. Liu, O. Metin, D. Sun, K. L. More and S. Sun, Nano Lett., 2012, 12, 1102–1106 CrossRef CAS PubMed
- L. Chen, H. Guo, T. Fujita, A. Hirata, W. Zhang, A. Inoue and M. Chen, Adv. Funct. Mater., 2011, 21, 4364–4370 CrossRef CAS
- Y. She, Z. Lu, W. Fan, S. Jewell and M. K. H. Leung, J. Mater. Chem. A, 2014, 2, 3894–3898 CAS
- Y. Zhou, X.-C. Hu, Q. Fan and H.-R. Wen, J. Mater. Chem. A, 2016, 4, 4587–4591 CAS
- W. Xu, S. Zhu, Z. Li, Z. Cui and X. Yang, Electrochim. Acta, 2013, 114, 35–41 CrossRef CAS
- H. An, H. Cui, D. Zhou, D. Tao, B. Li, J. Zhai and Q. Li, Electrochim. Acta, 2013, 92, 176–182 CrossRef CAS
- N. Mojumder, S. Sarker, S. A. Abbas, Z. Tian and V. Subramanian, ACS Appl. Mater. Interfaces, 2014, 6, 5585–5594 CAS
- Q. Lv, K. Li, C. Liu, J. Ge and W. Xing, Carbon, 2016, 98, 126–137 CrossRef CAS
- S. F. Jiang, B. L. Yi, C. K. Zhang, S. Liu, H. M. Yu and Z. G. Shao, J. Power Sources, 2015, 276, 80–88 CrossRef CAS
- S. F. Jiang, B. L. Yi, H. J. Zhang, W. Song, Y. Z. Bai, H. M. Yu and Z. G. Shao, ChemElectroChem, 2016, 3, 734–740 CrossRef CAS
- S. F. Jiang, B. L. Yi, Q. Zhao, H. J. Zhang, Y. Su, H. M. Yu and Z. G. Shao, RSC Adv., 2016, 6, 82370–82375 RSC
- D. Bin, B. Yang, F. Ren, K. Zhang, P. Yang and Y. Du, J. Mater. Chem. A, 2015, 3, 14001–14006 CAS
- R. Zhao, Y. Liu, C. Liu, G. Xu, Y. Chen, Y. Tang and T. Lu, J. Mater. Chem. A, 2014, 2, 20855–20860 CAS
- J. Chang, L. Feng, C. Liu, W. Xing and X. Hu, Angew. Chem., Int. Ed., 2014, 53, 122–126 CrossRef CAS PubMed
- C. X. Guo, L. Y. Zhang, J. Miao, J. Zhang and C. M. Li, Adv. Energy Mater., 2013, 3, 167–171 CrossRef CAS
- H. Zhao, J. Yang, L. Wang, C. Tian, B. Jiang and H. Fu, Chem. Commun., 2011, 47, 2014–2016 RSC
- W. Wang, S. Ji, H. Wang and R. Wang, Fuel Cells, 2016, 6, 1129–1133 Search PubMed
- M. Wang, W. Zhang, J. Wang, A. Minett, V. Lo, H. Liu and J. Chen, J. Mater. Chem. A, 2013, 1, 2391–2394 CAS
- S. Hu, F. Munoz, J. Noborikawa, J. Haan, L. Scudiero and S. Ha, Appl. Catal., B, 2016, 180, 758–765 CrossRef CAS
- S. Hu, L. Scudiero and S. Ha, Electrochem. Commun., 2014, 38, 107–109 CrossRef CAS
- A. Ruban, B. Hammer, P. Stoltze, H. L. Skriver and J. K. Nørskov, J. Mol. Catal. A: Chem., 1997, 115, 421–429 CrossRef CAS
- Y. Wang, Y. Qi, D. Zhang and C. Liu, J. Phys. Chem. C, 2014, 118, 2067–2076 CAS
- K. Jiang, H.-X. Zhang, S. Zou and W.-B. Cai, Phys. Chem. Chem. Phys., 2014, 16, 20360–20376 RSC
- C. Zhang, H. Yu, Y. Li, Y. Gao, Y. Zhao, W. Song, Z. Shao and B. Yi, ChemSusChem, 2013, 6, 659–666 CrossRef CAS PubMed
- H. Wan, Q. Dong, G. Zhu, G. Yu, T. Yin and M. Huang, Int. J. Hydrogen Energy, 2015, 40, 14179–14186 CrossRef CAS
Footnote |
| † Electronic supplementary information (ESI) available. See DOI: 10.1039/c7ra00194k |
| This journal is © The Royal Society of Chemistry 2017 |