 Open Access Article
Creative Commons Attribution 3.0 Unported Licence
Aqueous solutions of random poly(methyl methacrylate-co-acrylic acid): effect of the acrylic acid content†
Anna Y. Gyurova *a,
Sylvia Halachevab and
Elena Milevaa
aRostislaw Kaischew Institute of Physical Chemistry, Bulgarian Academy of Sciences, Acad. G. Bonchev str., bl. 11, 1113 Sofia, Bulgaria. E-mail: any_gyurova@abv.bg
bUniversity of Bolton, Deane Road, Bolton, BL3 5AB, UK
First published on 27th February 2017
Abstract
Aqueous solutions from two types of PMMA–AA polymers (PMMA–25AA and PMMA–50AA) are investigated. The aim is to outline the effect of AA content on the bulk solution and air/solution interface properties. The experiments include dynamic light scattering, surface tension and interfacial rheology measurements. The drainage kinetics and stability of microscopic foam films are also investigated. It is established that at similar conditions (pH = 10, temperature 20 °C) the polymer molecules have almost the same mean molecular weight and size distribution of the bulk globules. Dynamic and equilibrium surface tension measurements reveal systematically higher values for PMMA–50AA as compared to PMMA–25AA. These outcomes are related to higher bulk electrophoretic mobility in the PMMA–50AA case and the overall more stretched configuration of the polymer at the air/solution interface. Surface dilational rheology characteristics are particularly sensitive to the polymer structural peculiarities: while no significant changes are registered in the case of PMMA–25AA, the solutions of PMMA–50AA exhibit a pronounced maximum in surface dilational elasticity for the concentration ∼1 × 10⁻⁴ mol L−1. This observation is a clear sign of specific bulk and/or interfacial (structure) transition which has to be investigated in further studies. Microscopic foam films provide additional evidence for the effect of fine-tuning the AA content of the copolymer. All microscopic films are stable which is due predominantly to the overwhelming electrostatic repulsion effects. The obtained results add new knowledge to the structure–property relationships of the PMMA–AA based aqueous formulations. They give valuable hints for further fine-tuning opportunities of these systems, that have high innovative potential for various applications.
1. Introduction
The adsorption of amphiphilic polymers at interfaces and their performance in the bulk of fluid media are of great importance for understanding and tuning the properties and the stability of colloidal systems. Furthermore, study of the structure–property relationships can provide valuable information of fundamental interest and can determine the range of technical applications of these polymers. That is why the interfacial and bulk solution behavior of amphiphilic polymers has attracted the attention of researchers for many years.1–6The polymer self-assembly in aqueous media is a topic of high interest on its own.7–13 Among other major factors (electrostatic and van der Waals interactions, hydrogen bonding, etc.), the hydrophobic interactions are of key importance for the onset of energetically favorable inter- and intra-associations of the amphiphilic polymers in water. Aside from the onset of typical spherical polymer micelles (hydrophobic core/hydrophilic shell(s)),11–13 more complex structures based on loops and cross-linking of the chains can occur in the solution bulk. Besides, if a coordinated network of cross-links is built between the macromolecules, the viscosity of the system increases. As the hydrophobic portion of the macromolecule increases, second and third order polymer architectures are possible to form (unimolecular flower-like micelles, collapsed unimolecular micelles, etc.).8 Thus the self-association phenomena in aqueous media are always related to the type and chemical structure of amphiphilic polymers. The macromolecule self-assembly depends also on factors such as pH, ionic strength, temperature, polymer concentration, etc. Despite the conceptual similarity to common surfactant self-assemblies, the polymer micelles are distinguished by their structural rigidity, larger size, lower critical micellization concentration (CMC) and kinetically frozen (static) equilibrium in the solution as opposed to the dynamic exchange of structural units with the medium in the case of low molecular mass amphiphiles. Polymeric macromolecules can leave the associates only when the conditions in the solutions are changed.8–10
Self-assemblies of amphiphilic polymers have found a broad range of applications. Among the most popular examples are the so-called polymer hydrogels which can be used as drug/protein carriers for controlled or prolonged release and in situ curing gels in tissue engineering. They are actually hydrophilic networks which swell upon changing certain conditions, such as solution pH, ionic concentration, temperature, charge distribution, magnetic field, enzyme presence, etc.14–17
Poly(methyl methacrylates) (PMMA) are among the most studied polymers since the beginning of 20th century because of their specific performance. The transparency and thermal stability of the polymer determines important applications as a lighter alternative to glass, transparent coatings, bone cement for medical and dental purposes, etc.18,19 Recent investigations on Langmuir adsorption layer equilibrium properties and dilational rheology behavior have reported evidence of quasi 2D-fluid to soft-glass transition at air–solution interface (with transition temperature ∼298.15 K).20,21 The basic outcome of these studies is that the air–water interfacial region acts as a poorer solvent for the polymer. This conclusion has to be accounted for when combined bulk and interfacial studies are performed and when smart fluid phase formulations are developed based on PMMA types of polymers.
The modifications of PMMA not only improve the properties of PMMA systems but also may imply the onset of new characteristics. This has evoked considerable scientific and industrial interest in PMMA-based polymers. Thus, the copolymerization of PMMA with acrylic acid (AA) has been studied intensively and a variety of materials with useful performance features have been obtained.19,22–26 For instance, random PMMA–AA copolymers of various compositions have been used to prepare hollow cross-linked gel particles with potential medical application for regeneration of soft tissues.26 It has been established that when the molar percentage of AA in PMMA–AA decreases, pH at which the copolymer can be dissolved in water shifts to higher values.22 It has also been established that the AA-component increases the interaction between PMMA–AA and charged montmorillonite nanoparticles.19 The study of the impact of AA on the aggregation behavior of poly(n-butyl acrylate)-g-poly(acrylic acid) Pn BuA-g-PAA reveals that the lower molar fraction of the side chains corresponds to a higher degree of micellization of the grafted copolymer.7
Recently novel random copolymers – PMMA–AA – have been synthesized by free radical polymerization.26,27 Despite the limitations, such as the broad molecular weight distribution and uncertainty in the positions of the side chains,14 this polymerization methodology is widely used because of the relatively easy synthetic procedure. The specific properties of this type of amphiphilic polymer are expected to be dependent on the types and relative contents of hydrophobic and hydrophilic portions, as well as on the sequence of the monomer distribution.8
In the present study, the interfacial and bulk behavior of two specific modifications of the random copolymers PMMA–25AA and PMMA–50AA are investigated in aqueous solutions. The aim is to understand and evaluate the effect of the AA content on the aqueous solution properties of these copolymers.
2. Materials
2.1. Synthesis and characterization of the materials
All chemicals are purchased from Sigma-Aldrich, unless otherwise stated, and used as received. The PMMA–25AA and PMMA–50AA polymers are synthesized via free radical polymerization of the appropriate mixtures of MMA and AA, using 2,2′-azobis(2-methylpropionitrile) (AIBN) as an initiator.26,27 The structural formula of the resulting copolymers is given in Fig. 1. The abbreviation codes are derived from the molar percentages of each component. For example, PMMA–50AA contains 50 mol% MMA and 50 mol% AA units. The copolymers are characterized by GPC and 1H NMR. The GPC analyses have given monomodal molar mass distributions with polydispersity values of 1.69 and 1.92 (Fig. S1, ESI†). The 1H NMR spectra have been used for the determination of the copolymers' structural compositions by examining the relative ratios of signal intensities of the methoxyl protons of MMA groups and the methylene protons of AA groups (Fig. S2, ESI†). The experimental values obtained by 1H NMR are in good agreement with the theoretical values (Table 1).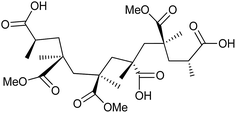 | ||
| Fig. 1 Structure of the poly(methyl methacrylate-co-acrylic acid) (PMMA–AA) copolymers used in this study. | ||
2.2. Preparation of polymer aqueous solutions
Due to its hydrophobic backbone, the copolymer PMMA–AA is poorly soluble in aqueous media. An experimental procedure has been developed to overcome this problem. The key approach is to perform the experiments at relatively high pH of 10.The following procedure is applied to both PMMA–25AA and PMMA–50AA in order to eliminate possible differences in the results caused by variations in method of preparation. First, PMMA–AA is mixed with a buffer of pH = 10 ± 0.02 (Na2B4O7/NaOH, provided by Fluka) at constant magnetic stirring of 500 rpm (J. P. Selecta) and temperature 20 °C. The duration of the mixing process depends on the copolymer concentration: 15 minutes for the low concentration range of Cp = 10−7 to 10−6 mol L−1 and 1–1.5 hours for Cp = 10−4 mol L−1 and higher polymer concentrations. The stirring is performed in a closed vessel to avoid evaporation. Second, the solution is placed into an ultrasonic bath (Bandelin electronic GmbH & Co. KG) and sonificated at a frequency of 35 kHz for 15 minutes. Finally, the solution is filtered through a 0.45 μm sterile microfilter (Millex) using a sterile syringe.
The concentration range of PMMA–50AA in the experiments varies within Cp = 1 × 10⁻⁶ to 5 × 10⁻⁴ mol L−1, while that of PMMA–25AA is between Cp = 1 × 10⁻⁷ to 1 × 10⁻⁴ mol L−1. The upper concentration limits are determined by the conditions for the onset of turbidity because turbid solutions could not be reliably investigated. It is established that at Cp = 1 × 10⁻³ mol L−1 for PMMA–50AA and Cp = 5 × 10⁻⁴ mol L−1 for PMMA–25AA, the aqueous solutions become turbid. In all experiments the temperature is kept at 20 ± 0.1 °C and the pH-value is maintained at pH = 10.
3. Methods
3.1. Dynamic light scattering
“Nano ZS” device (Malvern Instruments Ltd.) is used for the measurement of the sizes and the electrophoretic mobility of the copolymer structures in the solution bulk. The light source is ‘red’ laser (633 nm) and the regime of backward scattering angle (173°) is applied. This angle is considered as suitable for size measurements in the range of 0.6 nm to 6 μm. In addition, backwards scattering has the advantage of decreasing the effect of multiple scattering and larger dust particles (the large particles scatter mainly in forward direction). The device combines the methods of Dynamic Light Scattering (DLS) for the determination of the diffusion coefficient and the hydrodynamic diameter of particles, Electrophoresis28 and Laser Doppler Velocimetry29 to obtain the zeta potential and the electrophoretic mobility. Size distribution data by intensity of the scattered light and by number are obtained. The initial results present the intensity size distribution and the other quantities are recalculated using Mie theory.30 It is worthy to mention the basic assumption set in the DLS technique – the model recalculations are applied for the simplest conjecture about the spherical shape of the particles. As long as the particle size is small enough to correspond to the limitations of the Rayleigh approximation31 this method provides reliable results. A detailed characterization of the DLS technique can be found elsewhere in the literature.313.2. Profile analysis tensiometer (PAT)
The values of the dynamic and equilibrium surface tension, as well as the surface dilational elasticity and viscosity are recorded by Profile Analysis Tensiometer – PAT (Sinterface, Berlin, Germany).32,33 The bubble regime is chosen as more suitable for the dilute solution measurements. Dynamic surface tension is followed within a period of 24 hours. For the determination of the surface dilational rheology low-frequency oscillations (0.005–0.2 Hz) of the air bubble are performed. The resulting response of the surface tension is recorded and Fourier analysis is applied to calculate the corresponding values of the surface dilational elasticities and viscosities. The temperature is maintained at 20 ± 0.1 °C by a thermostat.3.3. Microinterferometric thin liquid film technique
The microinterferometric method of Scheludko–Exerowa allows the investigation of the film drainage and stability, determination of film thicknesses and their time evolution.34,35 In our case, the so-called ‘common cell’ is used and the experiments are carried out at constant capillary pressure. The copolymer solutions are placed in the measuring cell and kept in a thermostatic chamber for 2 hours before the beginning of the measurements. The visualization of the foam films is ensured by a digital camera connected to a high quality inverted microscope (Axiovert 200 MAT, Carl Zeiss). For every copolymer concentration, at least two experimental sets are obtained. Each set consists of about 60–70 foam films and their time evolution is recorded and analyzed.4. Results and discussion
4.1. Size and electric properties of PMMA–25AA and PMMA–50AA in the bulk of aqueous solutions
In order to characterize the properties of the copolymers in the bulk of aqueous solutions, we have studied the size distribution and the electrophoretic mobility applying the methods of DLS, Electrophoresis and Laser Doppler Velocimetry. The DLS measurements are performed at the highest concentrations of the copolymers that are used in the surface tension and microscopic foam films experiments. The data are presented in Table 2. The electrophoretic mobilities confirm that PMMA–50AA is about twice as charged as PMMA–25AA and the sign of the charge is negative.| Copolymer | Size by intensity, nm | Size by number, nm | Electrophoretic mobility, μm cm V−1 s−1 |
|---|---|---|---|
| PMMA–25AA | 15.6 ± 9.5 | 4.19 ± 3.53 | −1.7 ± 0.68 |
| PMMA–50AA | 3.122 ± 1.39 (peak 1) | 2.77 ± 1.71 | −3.45 ± 0.55 |
| 255 ± 144 (peak 2) |
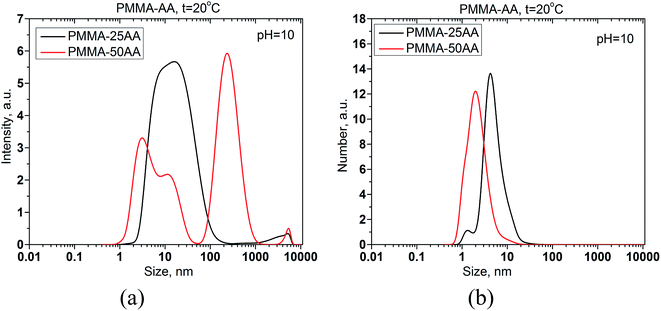
The size distributions by intensity and by number of PMMA–25AA and PMMA–50AA are compared in Fig. 2a and b.
The size of PMMA–50AA in the bulk of aqueous solutions is slightly smaller than that of PMMA–25AA. An additional peak appears in intensity distributions of PMMA–50AA at ∼255 nm (Fig. 2a). This course of the intensity curve might be related to possible deflection of the polymer species from the globular conformation due to the higher density of the electric charges in the macromolecule and the resulting tendency toward uncoiling. However, the fraction of the species possessing a hydrodynamic diameter within this range is insignificant and does not sensibly show up in the distribution by number (Fig. 2b). The results are in conformity with the GPC data about the similar mean molecular mass distributions of both polymers as presented in Fig. S1 of the ESI.†
The slightly larger size of PMMA–25AA units in aqueous solutions as compared to PMMA–50AA, might be related to the lower number of AA units in the macromolecules and the slightly longer (hydrophobic) backbone, while the molecular weights of both copolymers (Mw) remains quite similar (see Table 1). It is also probable that a mixture of monomers and micelles and/or premicelles might be present in PMMA–25AA solutions (two peaks in Fig. 2b). For the case of PMMA–50AA solution the monomodal size distribution by number clearly shows that no self-assemblies are detected at these concentration values (Fig. 2b).
An additional factor that can influence the dimensions is the critical micellization concentration (CMC) of polymers, at which micelles presence should be expected in the solution. The parameter has been studied for both PMMA–25AA and PMMA–50AA and the results are presented in 4.2.
4.2. Adsorption layer properties of PMMA–25AA and PMMA–50AA at air/solution interface
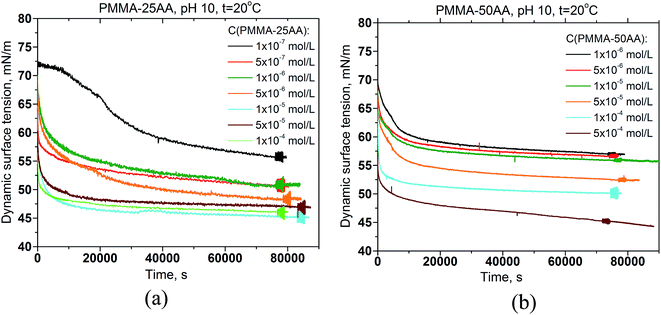
The dynamic surface tension data of PMMA–25AA and PMMA–50AA solutions, measured over the course of 24 hours, are represented in Fig. 3a and b, respectively. Both polymers possess surface activity. The dynamic surface-tension values drop down substantially at the initial stages of the measurements (up to 1–1.5 h), followed by a smooth and gradual decrease. This is a typical behavior for amphiphilic polymers and is usually interpreted as diffusion governing the initial stages of the adsorption process, followed by a reorganization of the adsorbed polymer at the air/solution interface. Here a specific run of the curve is recorded for the lowest experimental concentration (1 × 10⁻⁷ mol L−1) of PMMA–25AA (Fig. 3a) where a prolonged induction time of ∼5500 s precedes the major drop in the surface tension values. The result is probably related to the extremely low number density of the macromolecules in the solution.Additional information about the interfacial properties of the solutions may be extracted by plotting the equilibrium surface tension values against the polymer concentration. Fig. 4 shows a comparison of the surface tension isotherms for both polymers: PMMA–25AA and PMMA–50AA. In the case of PMMA–25AA the bulk CMC-value is at Cp ∼ 1 × 10⁻⁶ mol L−1; at higher concentrations a plateau region is registered. This might be interpreted as the adsorption layer at the air/solution interface being densely packed so that the addition of new amounts of polymer results only in bulk self-assembly. The solution becomes turbid at Cp ∼ 5 × 10⁻⁴ mol L−1.
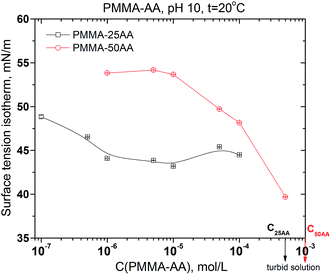 | ||
| Fig. 4 Equilibrium surface tension of aqueous solutions of PMMA–25AA and PMMA–50AA vs. concentration. Temperature is 20 °C; pH = 10. | ||
The curve for PMMA–50AA is characterized by a distinct plateau at concentrations Cp ∼ 1 × 10⁻⁶ to 1 × 10⁻⁵ mol L−1. At higher polymer quantities (Cp > 1 × 10⁻⁵ mol L−1), the equilibrium surface tension of PMMA–50AA sharply decreases as Cp increases. Considering the solution becoming turbid at Cp ∼ 1 × 10⁻³ mol L−1, it is not possible to determine the CMC-value in this case. So, the results show that generally PMMA–25AA has higher surface activity as compared to PMMA–50AA.
To relate this data to the size measurements (4.1.), it should be pointed out that at the particular concentrations of polymers in the solutions used in DLS experiments, PMMA–25AA has long reached its CMC but PMMA–50AA has not. This might have contributed to the slightly bigger hydrodynamic radius of PMMA–25AA despite the aqueous medium is poorer solvent for it compared to PMMA–50AA.
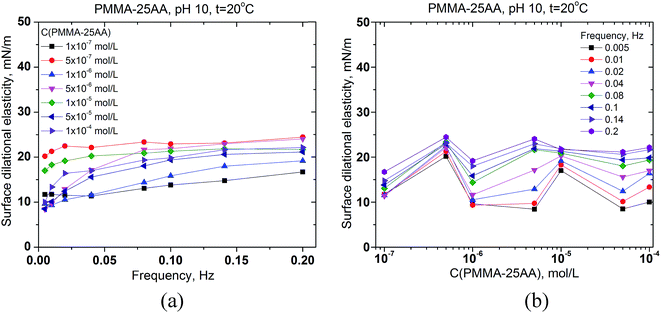
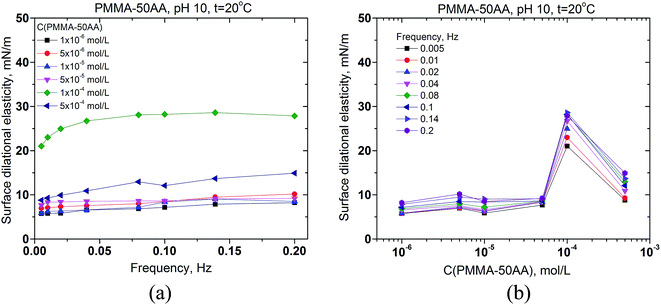
The interfacial rheology has also been studied in order to obtain more information for the properties of the adsorption layer at the air/solution interface. The surface dilational elasticities of PMMA–25AA and PMMA–50AA are presented as a function of the frequency of oscillation of the bubble surface area (Fig. 5a and 6a) and against the copolymers' concentration (Fig. 5b and 6b). The frequency range used in our experiments is within 0.005–0.2 Hz. In Fig. 5a it is shown that for each Cp the dilational elasticity rises slightly upon the frequency increase, reaching plateau. On the other hand, the elasticity values are only weakly dependent on the polymer concentration (Fig. 5b).
The values of surface dilational elasticities are slightly lower in the case of PMMA–50AA as compared to the PMMA–25AA solutions; this parameter does not vary essentially against the frequency. Concerning the concentration dependences of the dilational elasticity, the run of the curves is definitely smoother than in the case of PMMA–25AA. However, there is a remarkable exception for Cp = 1 × 10⁻⁴ mol L−1 (Fig. 6a) where the dilational elasticities are sharply enhanced and there are distinct maxima in the course of the concentration curves at Cp = 1 × 10⁻⁴ mol L−1 (Fig. 6b). At this polymer quantity the respective values are of a similar order of magnitude as in the case of PMMA–25AA for Cp = 1 × 10⁻⁴ mol L−1 (compare Fig. 5b and 6b). The result might support the hypothesis that at this particular polymer concentration complexation (gelation) events occur in the solution bulk.
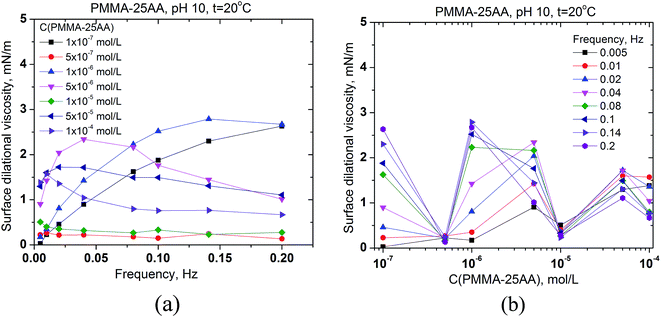
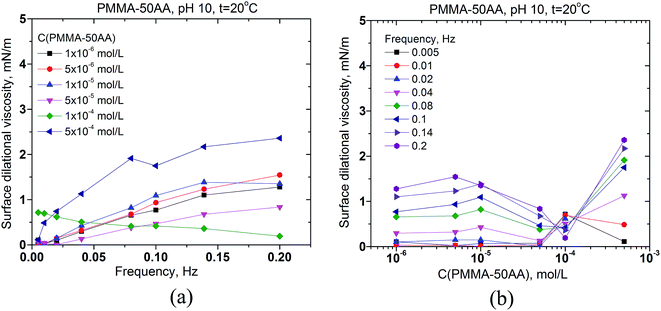
The surface dilational viscosities of PMMA–25AA and PMMA–50AA are also plotted against the bubble oscillation frequencies and vs. the polymer concentration (Fig. 7 and 8). Obviously the values are quite low and of the same order of magnitude for both polymers, with being just slightly lower in the case of PMMA–50AA.
The results demonstrate that both polymers impose predominantly an elastic behavior of the adsorbed layers at the air/solution interface.
4.3. Microscopic foam films from aqueous solutions of PMMA–25AA and PMMA–50AA
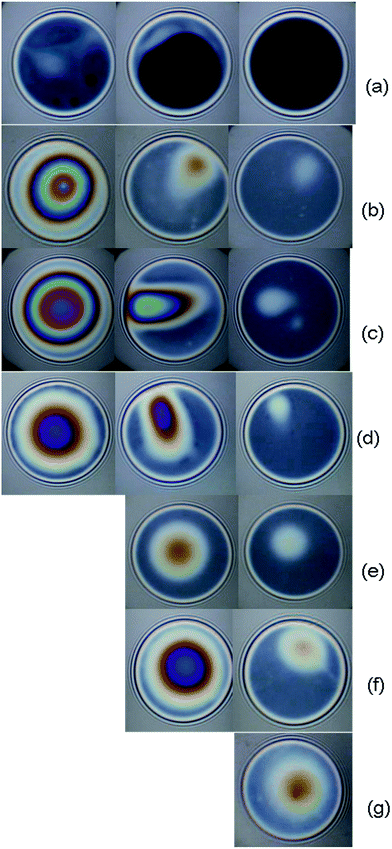
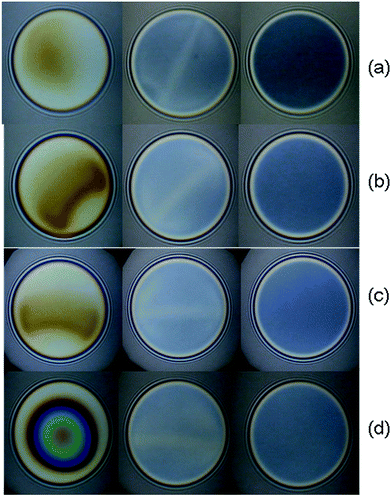
Characteristic snapshots of foam films from aqueous solutions of PMMA–25AA and PMMA–50AA and their time evolution for different concentrations are presented in Fig. 9 and 10.The microscopic foam films from both PMMA–25AA and PMMA–50AA, are stable (their lifetimes are longer than 5 minutes) within the investigated concentration ranges. Dimple formation is observed in all films from PMMA–25AA except for the lowest concentration investigated (Cp = 1 × 10⁻⁷ mol L−1) (Fig. 9a). The dimples are slowly squeezed out until a significantly smaller white area/spot is left (Fig. 9b–d). At Cp = 1 × 10⁻⁷ mol L−1 of PMMA–25AA, common black films (CBFs) are obtained (Fig. 9a). Besides, little black dots appear at the initial stages of the drainage process. The dots grow fast, develop into spots and within ∼50 s the whole film area becomes black.
In the case of PMMA–50AA, the film drainage goes smoothly through the onset of channels (Fig. 10) until the so-called “gray” films of homogeneous thickness are obtained. No significant dimples are observed except at the early stages of the film drainage process at Cp = 5 × 10⁻⁵ mol L−1, but in the latter case they are again squeezed out quickly (Fig. 10d).
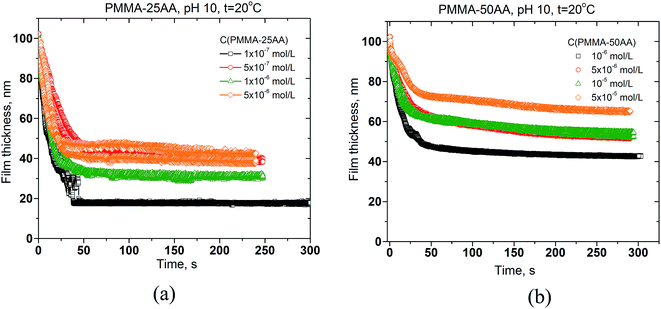
The drainage kinetics is presented by the changes of film thickness against the time of film thinning. The results are shown in Fig. 11a and b, respectively for both copolymers.
All films drain until reaching equilibrium thickness. The drainage time is essentially lower for PMMA–25AA (Fig. 11a). At Cp > 5 × 10⁻⁷ mol L−1 for PMMA–25AA there is no significant change in the film drainage times. In the case of PMMA–50AA solutions, the film drainage curves run more gradually with time for all investigated concentration.
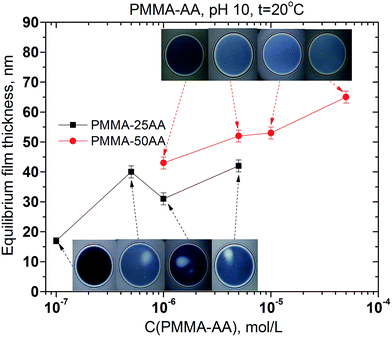
The comparison between the runs of equilibrium film thickness versus the concentration for PMMA–25AA and PMMA–50AA, respectively, is presented in Fig. 12.
The film equilibrium thickness generally increases with time for PMMA–50AA, while it remains in the range of ∼30–40 nm for the concentrations Cp > 5 × 10⁻⁷ mol L−1 of PMMA–25AA.
5. Discussion
The investigation of aqueous solutions from two types of PMMA–AA copolymers (PMMA–25AA and PMMA–50AA) shows that the acrylic acid content of the co-polymers has a significant effect on the bulk and air/solution interface properties of the investigated aqueous systems.First, the surface activity of the polymer macromolecules is related to their amphiphilic nature and depends predominantly on the hydrophobic/hydrophilic (PMMA/AA) molar ratio. Because the mean molecular weight of both polymers is similar (see Fig. S1 in the ESI†), the data from surface tension measurements of the solutions are determined by the molar ratio of the hydrophilic AA against the MMA portions of the respective macromolecules. Therefore, as is to be expected, the results show higher surface activity of PMMA–25AA at the air/solution interface and the CMC-value is reached at a lower polymer concentration. The surface tension values of PMMA–50AA remain generally higher and a significant shift in CMC (if any) to higher values is expected. The polymer concentration at the onset of turbidity in the solution bulk is also shifted to higher values for PMMA–50AA, as compared to PMMA–25AA solutions (Fig. 4). The surface dilational rheology measurements exhibit no specific characteristics and are typical for amphiphilic substances. The only exception is the surface dilation elasticity of solutions from PMMA–50AA at Cp = 1 × 10⁻⁴ mol L−1 where there is a well-defined maximum. This concentration performance is evidence for additional structural reorganization in the bulk of the solutions.
Second, the data from the microscopic foam film measurements give ample evidence about the electrostatic stabilization of the films. In our experiments pH is maintained at 10. As the two film interfaces with the adsorbed layers get closer during the film drainage, the negatively charged AA groups provoke the onset of electrostatic repulsive forces and lead to the formation of stable microscopic foam films of equilibrium thicknesses. One interesting observation is that the equilibrium film thickness in the case of PMMA–25AA is systematically lower than that for the same molar concentrations of PMMA–50AA (Fig. 12). While there is no significant difference in the mean sizes of the polymer globules, in the cases of PMMA–25AA and PMMA–50AA (Fig. 2b) and the mean molecular weight (Table 1), the relative amount of the charged AA chains is about 50% lower for PMMA–25AA (Table 2). Therefore, the electrostatic repulsive interactions between the adsorbed polymer molecules at the film surfaces is less than in the case of PMMA–50AA. Consequently, the interfaces of the films formed from PMMA–25AA solutions experience weaker repulsion forces and, therefore, this would result in thinner foam films. In contrast, PMMA–50AA should supposedly acquire more stretched configurations in the adsorbed state because of the electric repulsions between the AA groups of the macromolecule. This invokes stronger electrostatic repulsive interactions between the two adsorbed layers of PMMA–50AA due to the denser electrostatic charges at the film interfaces which keep them at larger distance apart (thicker films).
The above explanations presume that the adsorbed polymer layers are densely packed but in a stretched configuration and with similar number density of the adsorbed macromolecules within the investigated concentration range. This might also be deduced from the dynamic surface tension results and the performance of the surface dilational elasticities against the polymer concentration (Fig. 5b and 6b). However, the equilibrium surface tension isotherms advance another factor as well, namely the formation of polymer (pre)micelles in the case of PMMA–25AA (Fig. 4). This may lead to the onset of bulk charged entities which also have an impact on the specific film thicknesses of the equilibrium films. These micelles reduce the number density of the charged entities in the equilibrium films from the PMMA–25AA solutions and are swept into the film meniscus region in the course of the film drainage. So, the electrostatic interactions in the foam films are further reduced and the film-thickness values are lower than in the case of PMMA–50AA. As already stated, CMC cannot be registered for the PMMA–50AA solutions within the investigated concentration range. Due to the more extended configuration of the macromolecules, however, gel-like structures might also form both in the film bulk and/or at the film interfaces. Evidence for such a possibility is the sluggish drainage process of foam film drainage as shown in Fig. 11. Unlike the PMMA–25AA case, the film thinning proceeds slowly, passing through stages of regular thickness within the draining films and even after ∼5 min the drainage still moves ahead towards attaining the resulting equilibrium foam films which are without thickness irregularities (no white spots and/or channels).
6. Concluding remarks
The investigation of aqueous solutions from two types of PMMA–AA copolymers – PMMA–25AA and PMMA–50AA – results in the outline of the following relationships:• It is established that under similar conditions (pH = 10, temperature 20 °C) the polymer molecules have almost the same mean molecular weight and size distribution of the bulk globules. For the polymer with lower AA content (i.e. PMMA–25AA), CMC of the amphiphilic polymer is established to be at Cp ∼ 1 × 10⁻⁶ mol L−1, while no CMC can be found for aqueous solutions of PMMA–50AA.
• Dynamic surface tension measurements reveal systematically higher values for PMMA–50AA as compared to PMMA–25AA. Equilibrium surface tension data are also systematically higher for the case of PMMA–50AA as compared to the polymer with the lower AA content, PMMA–25AA. These outcomes might be related to higher bulk electrophoretic mobility in the case of PMMA–50AA and the overall more stretched configuration of the polymer at the air/solution interface. The electrostatic repulsions prevent the formation of denser adsorption layers in the case of PMMA–25AA.
• Surface dilational rheology characteristics are particularly sensitive to the polymer structural peculiarities and result in the most striking difference between the two polymers: while no significant changes are registered in the case of PMMA–25AA, the solutions of PMMA–50AA exhibit a pronounced maximum in surface dilational elasticity for the concentration of Cp ∼ 1 × 10⁻⁴ mol L−1. This fact is a clear sign of specific bulk and/or interfacial (structure) transition which has to be investigated in further studies.
• Microscopic foam films provide additional evidence for the effect of regulating the AA content of the copolymer. All microscopic films are stable which is due predominantly to the overwhelming electrostatic repulsion effects. However, the structure of PMMA–25AA seems more suitable in view of foam film stabilization: the equilibrium foam films are thinner and a lower quantity of polymer is needed in order to attain film stability.
The obtained results add new knowledge to the structure–property relationships of the PMM-AA based aqueous formulations. They give valuable hints for further fine-tuning opportunities of these systems, that have high innovative potential for various applications.
Abbreviations
| PMMA | Poly(methyl methacrylate) |
| AA | Acrylic acid |
| DLS | Dynamic light scattering |
| CMC | Critical micellar concentration |
| GPC | Gel permeation chromatography |
| 1H NMR | Proton nuclear magnetic resonance |
References
- K. Holmberg, B. Jonsson, B. Kronberg and B. Lindman, Surfactants and Polymers in Aqueous Solution, John Wiley & Sons, England, 2003, ch. 11–12 Search PubMed.
- G. J. Fleer, M. A. Cohen Stuart, J. M. H. M. Scheutjens, T. Cosgrove and B. Vincent, Polymers at Interfaces, Chapman & Hall, London, 1st edn, 1993 Search PubMed.
- Y. V. Rojas, C. M. Phan and X. Lou, Dynamic surface tension studies on poly(N-vinylcaprolactam/N-vinylpyrrolidone/N,N-dimethylaminoethyl methacrylate) at the air–liquid interface, Colloids Surf., A, 2010, 355, 99–103 CrossRef CAS.
- T. Gilanyi, I. Varga, M. Gilanyi and R. Meszaros, Adsorption of poly(ethylene oxide) at the air/water interface: a dynamic and static surface tension study, J. Colloid Interface Sci., 2006, 301, 428–435 CrossRef CAS PubMed.
- N. Wu and J. Parris, Interaction of water-soluble acrylic polymers with alcohols in aqueous solutions, Colloids Surf., A, 2000, 167, 179–187 CrossRef CAS.
- S. T. A. Regismond, Z. Policova, A. W. Neumann, E. D. Goddard and F. M. Winnik, Static and dynamic surface tension of dilute polyelectrolyte solutions, Colloids Surf., A, 1999, 156, 157–162 CrossRef CAS.
- H. Mori and A. H. E. Mueller, New polymeric architectures with (meth)acrylic acid segments, Prog. Polym. Sci., 2003, 28, 1403–1439 CrossRef CAS.
- S.-i. Yusa, Self-Assembly of Cholesterol-Containing Water-Soluble Polymers, Int. J. Polym. Sci., 2012, 2012, 1–10 CrossRef.
- K. Kataoka, A. Harada and Y. Nagasaki, Block Copolymer Micelles for Drug Delivery: Design, Characterization and Biological Significance, Adv. Drug Delivery Rev., 2001, 47, 113–131 CrossRef CAS PubMed.
- H. Cölfen, Double-Hydrophilic Block Copolymers: Synthesis and Application as Novel Surfactants and Crystal Growth Modifiers, Macromol. Rapid Commun., 2001, 22, 219–252 CrossRef.
- S. E. Webber, Polymer micelles: an example of self-assembling polymers, J. Phys. Chem. B, 1998, 102, 2618–2626 CrossRef CAS.
- Y. Morishima, Unimolecular micelles of hydrophobically modified polyelectrolytes, in Solvents and Self-Organization of Polymers, ed. S. E. Webber, D. Tuzar and P. Munk, Kluwer Academic Publishers, Dordrecht, The Netherlands, 1996, pp. 331–358 Search PubMed.
- A. Halperin, M. Tirrell and T. P. Lodge, Tethered chains in polymer microstructures, Adv. Polym. Sci., 1991, 100, 30–71 Search PubMed.
- S. J. Grainger and M. E. H. El-Sayed, Stimuli-sensitive particles for drug delivery, in Biologically-responsive hybrid biomaterials, ed. E. Jabbary and A. Khademhosseini, World Scientific Publishing, New Jersey, London, Singapore, 2010, pp. 171–190 Search PubMed.
- H. Tai, D. Howard, S. Takae, W. Wang, T. Vermonden, W. E. Hennink, P. S. Stayton, A. S. Hoffman, A. Endruweit, C. Alexander, S. M. Howdle and K. M. Shakesheff, Photo-Cross-Linked Hydrogels from Thermoresponsive PEGMEMA-PPGMA-EGDMA Copolymers Containing Multiple Methacrylate Groups: Mechanical Property, Swelling, Protein Release, and Cytotoxicity, Biomacromolecules, 2009, 10, 2895–2903 CrossRef CAS PubMed.
- Q. Hou, P. A. De Bank and K. M. Shakesheff, Injectable scaffolds for tissue regeneration, J. Mater. Chem., 2004, 14, 1915–1923 RSC.
- S.-C. Han, W.-D. He, J. Li, L.-Y. Li, X.-L. Sun, B.-Y. Zhang and T.-T. Pan, Reducible Polyethylenimine Hydrogels with Disulfide Crosslinkers Prepared by Michael Addition Chemistry as Drug Delivery Carriers: Synthesis, Properties, and In Vitro Release, J. Polym. Sci., Part A: Polym. Chem., 2009, 47, 4074–4082 CrossRef CAS.
- M. Arora, E. K. S. Chan, S. Gupta and A. D. Diwan, Polymethylmethacrylate bone cements and additives: A review of the literature, World J. Orthop., 2013, 4, 67–74 CrossRef PubMed.
- A. A. Silva, K. Dahmouche and B. G. Soares, The effect of addition of acrylic acid and thioglycolic acid on the nanostructure and thermal stability of PMMA–montmorillonite nanocomposites, Appl. Clay Sci., 2010, 47, 414–420 CrossRef CAS.
- A. Maestro, F. Ortega, R. G. Rubio, J. Krägel and R. Miller, Rheology of poly(methyl methacrylate) Langmuir monolayers: Percolation transition to a soft glasslike system, J. Chem. Phys., 2011, 134, 104704–104712 CrossRef CAS PubMed.
- A. Maestro, E. Guzmán, R. Chuliá, F. Ortega, R. G. Rubio and R. Miller, Fluid to soft-glass transition in a quasi-2D system: thermodynamic and rheological evidences for a Langmuir monolayer, Phys. Chem. Chem. Phys., 2011, 13, 9534–9539 RSC.
- A. A. Barba, A. Dalmoro, F. De Santis and G. Lamberti, Synthesis and characterization of P(MMA-AA) copolymers for targeted oral drug delivery, Polym. Bull., 2009, 62, 679–688 CrossRef CAS.
- F. Sayar, G. Gueven and E. Piskin, Magnetically loaded poly(methyl methacrylate-co-acrylic acid) nano-particles, Colloid Polym. Sci., 2006, 284, 965–978 CAS.
- M. A. S. Oliveira, J. J. Moraes and R. Faez, Impedance studies of poly(methylmethacrylate-co-acrylic acid) doped polyaniline films on aluminum alloy, Prog. Org. Coat., 2009, 65, 348–356 CrossRef CAS.
- C.-C. Shih, K.-H. Wu, T.-C. Chang and H.-K. Liu, Characterization, chain mobility, and thermal properties of the hydrophilic poly(methylmethacrylate-co-acrylic acid) colloids, Polym. Compos., 2008, 29, 37–44 CrossRef CAS.
- S. S. Halacheva, D. J. Adlam, E. K. Hendow, T. J. Freemont, J. Hoyland and B. R. Saunders, Injectable Biocompatible and Biodegradable pH-Responsive Hollow Particle Gels Containing Poly(acrylic acid): The Effect of Copolymer Composition on Gel Properties, Biomacromolecules, 2014, 15, 1814–1827 CrossRef CAS PubMed.
- K. Yoncheva, M. Kondeva-Burdina, V. Tzankova, P. Petrov, M. Laouani and S. S. Halacheva, Curcumin delivery from poly(acrylic acid-co-methyl methacrylate) hollow microparticles prevents dopamine-induced toxicity in rat brain synaptosomes, Int. J. Pharm., 2015, 486, 259–267 CrossRef CAS PubMed.
- J. Lyklema, Fundamentals of Interface and Colloid Science, Academic Press, London, 1995, vol. 2 Search PubMed.
- L. E. Drain, The Laser Doppler Technique, J. Wiley & Sons, New York, 1980 Search PubMed.
- G. Mie, Beiträge zur Optik trüber Medien, speziell kolloidaler Metallösungen, Ann. Phys., 1908, 330, 377–445 CrossRef.
- L. Øgendal, Light Scattering Demystified: Theory and Practice, University of Copenhagen, 2013 Search PubMed.
- G. Loglio, P. Pandolfini, R. Miller, A. Makievski, F. Ravera, M. Ferrari and L. Liggieri, Drop and bubble shape analysis as a tool for dilational rheological studies of interfacial layers, in Novel Methods to Study Interfacial Layers, ed. D. Moebius and R. Miller, Elsevier, Amsterdam, 2001, pp. 439–483 Search PubMed.
- L. Liggieri and R. Miller, Relaxation of surfactants adsorption layers at liquid interfaces, Curr. Opin. Colloid Interface Sci., 2010, 15, 256–263 CrossRef CAS.
- D. Exerowa and P. Kruglyakov, Foam and Foam Films, Elsevier, Amsterdam, 1998 Search PubMed.
- A. Scheludko, Thin Liquid films, Adv. Colloid Interface Sci., 1967, 1, 391–464 CrossRef.
Footnote |
| † Electronic supplementary information (ESI) available. See DOI: 10.1039/c7ra00180k |
| This journal is © The Royal Society of Chemistry 2017 |

![[thin space (1/6-em)]](https://www.rsc.org/images/entities/char_2009.gif) 730
730