
 Open Access Article
 This Open Access Article is licensed under a Creative Commons Attribution-Non Commercial 3.0 Unported Licence
The interaction of CO molecules on Au–Rh bimetallic nanoclusters supported on a thin film of Al2O3/NiAl(100)†
Hsuan Leea,
Zhen-He Liaoa,
Po-Wei Hsua,
Ting-Chieh Hunga,
Yu-Cheng Wua,
Yuwei Linb,
Jeng-Han Wang*b and
Meng-Fan Luo *a
*a
aDepartment of Physics, National Central University, 300 Jhongda Road, Jhongli 32001, Taiwan. E-mail: mfl28@phy.ncu.edu.tw
bDepartment of Chemistry, National Taiwan Normal University, Taipei, Taiwan. E-mail: jenghan@ntnu.edu.tw
First published on 27th February 2017
Abstract
The interaction of CO molecules adsorbed on Au–Rh bimetallic nanoclusters supported on an ordered thin film of Al2O3/NiAl(100) was studied, primarily with infrared reflection absorption spectroscopy and density-functional-theory calculations. The bimetallic clusters, grown by sequential deposition of vapor Au and Rh onto the Al2O3/NiAl(100) surface at 300 K, had diameters of 1.2–3.0 nm and heights of 0.4–1.2 nm; they had a fcc phase and grew in the orientation (100). The infrared absorption line for CO adsorbed on Au sites (COAu) of the bimetallic clusters at 110 K was narrow (centered about 2100 cm−1) and intense, which results largely from the small adsorption energy and large dipole moment of COAu, whereas that on Rh sites (CORh) was broad (1880–2100 cm−1) and weak, which contrasts also with its counterpart on pure Rh clusters. Upon increasing the temperature to remove COAu, the absorption line for CORh narrowed and the intensity increased; at 300 K, the line width decreased by 30–40% and the absorption intensity was enhanced by 40–60%. The former arose, after the desorption of COAu, from a decreased CO–CO interaction and inhomogeneous broadening; the latter corresponded to an enhanced dipole moment of CORh, attributed to a promoted charge transfer from the CORh-binding Rh to the neighboring Au and consequently increased charge donated from CORh to Rh. The varied IR absorption for adsorbed CO can thus serve as an indicator for the charge transfer between the components in bimetallic clusters.
1. Introduction
The adsorption of CO on solid surfaces and its chemical bonds with those surfaces have been extensively studied because CO is involved in many important reactions, such as dehydrogenation of methanol,1–8 water–gas-shift reaction,9–11 CO oxidation12–15 and the Fischer–Tropsch process;16–22 CO also commonly serves as a probe molecule to investigate surface structures.23–36 A comparison of infrared (IR) stretching wavenumbers between metal carbonyls and chemisorbed CO molecules on solid surfaces indicates the highly localized nature of the surface chemical bonds. A few theoretical models based on the local description have been used to understand the IR observations.37,38 With simple molecular-orbital considerations, a correlation between the wavenumber of a bond-stretching vibration and the number of metal atoms involved in the bonding has been established. Regions of stretching wavenumbers are classified into linear, bridged and hollowed molecules for CO adsorbed on transition-metal surfaces.38,39 Measured IR absorption wavenumbers can be assigned to specific adsorption geometries and accordingly reveal the surface structures. IR absorption intensities of CO on low-coordinate metal atoms, those with metal–metal coordination less than surface atoms in regular, low-index surfaces, have been found to be significantly enhanced relative to those on regular surface sites.38,40 This effect allows us to explore further the varied coordination of CO-binding metal atoms and hence the evolution of surface structures, as demonstrated previously in the alloying of supported bimetallic clusters.40 The present work shows that the varied IR absorption intensity of CO on surfaces can also reflect altered electronic states of CO-binding surface atoms. We demonstrate a significant CO–CO interaction via a charge transfer between the CO-binding atoms on bimetallic clusters.We recorded the IR absorption of CO on Au–Rh bimetallic nanoclusters supported on an ultra-thin film of Al2O3 grown on a NiAl(100) substrate, under ultrahigh vacuum (UHV) and with infrared reflection absorption spectroscopy (IRAS). The bimetallic clusters were prepared on depositing sequentially Au and Rh vapors onto Al2O3/NiAl(100) at 300 K; CO was adsorbed at 110 K and annealed stepwise to selected temperatures. The oxide thin film was used as it both resembles various physical properties characteristic of the bulk oxide and allows the use of electron-based surface-probe techniques.41–45 Au–Rh nanoclusters are investigated primarily with an objective to improve the performance of catalysts in a fuel cell for methanol oxidation.1,3,4,6,46 The morphology and structure of the bimetallic clusters were characterized with scanning tunneling microscopy (STM) and reflection high-energy electron diffraction (RHEED); temperature-programmed desorption (TPD) of CO on the bimetallic clusters was also performed as a comparison. Furthermore, we used calculations based on density-functional theory (DFT) to investigate the origin of the varied absorption lines and intensities for CO on the bimetallic clusters.
The results show that on the Au–Rh nanoclusters, formed with metal deposition in either order, the IR absorption intensity of CO on Rh sites (CORh) was significantly attenuated by CO on Au sites (COAu). The absorption line for CORh was broad and weak at 110 K, in contrast with its counterpart on pure Rh clusters and also that for COAu. With increased temperature, which induced desorption of COAu, the absorption line for CORh became evidently narrowed and more intense. The changes in the orientation of CORh and in the surface components of the bimetallic clusters, driven either by increased temperature or co-adsorbed CO species, are excluded to account for the altered absorption. Our DFT calculations have considered adsorbate (CO-coverage dependence), electronic (surface composition) and structural (coordination of CO-binding metals) effects on the adsorption energy, vibrational wavenumber and charge distribution of COAu and CORh. The simulation indicates that the interaction between COAu and CORh proceeded largely through a charge transfer between CO-binding Au and Rh; COAu suppressed the charge transfer from neighboring Rh to COAu-binding Au, so the desorption of COAu relieved the suppression and promoted the charge donation from CORh to Rh, which led to an increased dipole moment of CORh. The increased dipole moment reflects likely an increased dynamic dipole moment and thus IR absorption.38,47 The results imply that the varied IR absorption for adsorbed CO can serve as a probe of the charge transfer between the components in bimetallic clusters.
2. Methods
2.1 Experimental section
Our experiments were performed in UHV chambers with a base pressure in a 10−10 Torr regime. A NiAl(100) sample (MaTeck GmbH) was polished to a roughness less than 30 nm and an orientation accuracy better than 0.1°. The sample underwent alternative cycles of sputtering and subsequent annealing before each experiment. The cleanliness of the sample was monitored with Auger electron spectroscopy, low-energy electron diffraction and STM. An ultra-thin θ-Al2O3 film was formed on oxidation of a NiAl(100) alloy surface at 1000 K; the formation of Al2O3 thin films is described elsewhere.42,43,45,48 To achieve a homogeneous crystalline Al2O3 surface with no NiAl facets,49,50 we refrained from protracted post-oxidation annealing of the oxide films. The amorphous oxide surface was also negligible. The grown θ-Al2O3 thin film had thickness 0.5–1.0 nm.42,43,45,48 The sample was then quenched to 300 K for vapor deposition of Rh and Au from ultra-pure Rh rod and Au wires (in a molybdenum crucible) heated by electron bombardment in commercial evaporators (Omicron EFM 3). The rate of deposition of metal was fixed about 0.17 ML per min and 0.25 ML per min for Rh and Au respectively, calculated according to the coverage prepared at 300 K. The coverage was estimated from the volume of the Rh (or Au) clusters observed with STM; 1.0 ML corresponds to density 1.39 × 10¹⁵ (1.2 × 10¹⁵) atoms per cm2 of fcc Rh(100) (Au(100)) surface atoms. After the deposition, the sample was cooled to the desired adsorption temperature (110 K, unless specified). CO gas was dosed by a doser pointing to the sample, with a background pressure 2–5 × 10⁻⁹ Torr. We reported CO exposures in Langmuir units (1.0 L = 10−6 Torr s−1).STM images (recorded with a RHK UHV 300 unit), constant-current topographies, were obtained at 90 K with a sample bias voltage typically 2.4–2.8 V and a tunneling current 0.8–1.2 nA. The STM tip consisted of an electrochemically etched tungsten wire. RHEED was performed with an incident electron beam of energy 30 keV at a grazing angle 2–3° to the surface. TPD measurements were performed by ramping the sample at 3 K s−1 and monitoring the various masses on a quadruple mass spectrometer (Hiden), which was shielded and placed close (about 2 mm) to the sample. IRAS spectra were collected using a Fourier transform infrared spectrometer (FTLA 2000) with external optics aligned for an incident angle 75° from the sample normal, and a liquid nitrogen-cooled MCT detector. The IRAS spectra are presented as the ratio of sample and oxide surface (or clusters) data measured at the same surface temperature (110 K), and are typically the average of 256 scans at resolution 4 cm−1.
2.2 Computational method
The calculations for structural optimization, energy, vibrational frequency and Bader charge were all performed using the Vienna Ab initio Simulation Package (VASP).51–53 The computational was at the GGA-PW91 level54–56 as the exchange–correlation function was treated by the generalized gradient approximation (GGA) with Perdew-Wang 1991 (PW91) formulation. The electron–ion interaction was modeled by the projector-augmented wave method (PAW),57,58 combining the accuracy of augmented plane waves with the cost-effective pseudopotentials. The kinetic cutoff energy of plane-wave basis was set at 600 eV. The Brillouin-Zone (BZ) integration was sampled by Monkhorst–Pack scheme59 at 0.05 × 2 (Å−1) interval in the reciprocal space. All the structural optimization was performed by quasi-Newton method with an energetic convergence of 1 × 10⁻⁴ eV and a gradient convergence of 1 × 10⁻² eV. The parameter settings, balanced between the computational cost and precision, were examined by comparing the computed adsorption energies to those derived from a greater cutoff energy (800 eV) and more rigorous criteria for energetic (10−6 eV) and gradient (10−3 eV) convergences; the comparison showed limited energetic differences, <±0.1 eV. The activation energy calculation for CO diffusion were calculated using Nudged Elastic Band (NEB) method60 at the same energetic and gradient convergences.Three types of metallic structures, the extended surface M(100), stepped surface Mstep and round-shaped cluster M38, were employed for the calculations to investigate the structural effect on the adsorption of CO. The extended surfaces Au(100) and Rh(100) were modeled by a supercell comprising a 3 × 3 slab of six atomic layers, with the bottom two layers fixed and top four layers allowed to relax; an equivalent five-layer vacuum space was used to limit the artificial interaction between distinct adsorbates and slabs. The stepped surfaces Austep and Rhstep were modeled by removing half of the top layer at Au(100) and Rh(100), respectively, to create steps on the surfaces. The round shaped clusters Au38 and Rh38 were modeled by the stable clusters with 38 metallic elements and a diameter ca. 0.9 nm. The details of the models can be found in our previous studies.7,8 Additionally, four atoms at the surfaces of Au(100) and Rh(100) were substituted by Rh and Au atoms, respectively to model Rh/Au(100) and Au/Rh(100) to exam the electronic effect on the Au–Rh bimetallic clusters.
The vibrations of adsorbed CO were analyzed by the finite displacement approach, in which the Hessian matrix (force constant matrix) was derived by slightly displacing atoms from their optimized positions. The Hessian matrix was truncated due to the finite size of the super cell and decayed rapidly to zero with increasing inter-atomic separation. The vibrational frequency of adsorbed CO was obtained from the diagonalization of Hessian matrix and computed at the Γ-point of the Brillouin zone.61,62 The convergence for the frequency calculation was examined with more rigorous conditions: k-point meshes of 0.03 × 2 (Å−1), a cutoff energy of 800 eV, an energetic convergence of 10−6 eV, and greater numbers of steps and step sizes; the result showed a negligible variation in the frequency (≤4 cm−1, smaller than the experimental resolution). The van der Waals correction by DFT-D2 method has been included for the calculation of high CO coverage. The calculated frequencies are utilized to explain the experimental observation qualitatively. The charge distribution of the adsorbed CO were obtained by Bader charge analysis63–65 at the optimized structures. Some numerical differences between the current and other charge analyses (e.g. the Mulliken charge analysis) were expected; nevertheless, these charge analyses provide qualitatively similar trends.
3. Results and discussion
3.1 Morphology and structure of supported Au–Rh bimetallic clusters
The Au–Rh bimetallic nanoclusters were formed on sequential deposition of vapors of Au and Rh onto an ordered thin film of Al2O3/NiAl(100) at 300 K. Our series of STM measurements show that, for vapor deposition of first Au and then Rh, only a proportion of subsequently deposited Rh metal joined the pregrown Au clusters and formed bimetallic clusters (denoted as Rh/Au bimetallic clusters); this proportion increased with the pre-deposited Au coverage and became dominant at Au coverage ≥1.0 ML. In the present experiments, Rh/Au bimetallic clusters were prepared with the deposition of 1.0 ML Au and 1.0 ML Rh; nearly 85% of subsequently deposited Rh was incorporated into the pregrown Au clusters. Fig. 1 exemplifies a STM image of the bimetallic clusters. After the deposition of Rh, both the cluster density (from 1.24 × 10¹³ to 1.49 × 1013 cm−2) and the diameter increased slightly. In contrast, for vapor deposition in the reverse order, all subsequently deposited Au joined the pregrown Rh clusters (denoted as Au/Rh bimetallic clusters). The disparate behaviors arose because the diffusion length and the critical size for nucleation66 differ for Au and Rh on the oxide surface. The Au/Rh bimetallic clusters for the present experiments were prepared with 1.0 ML Rh clusters incorporating subsequently deposited 1.0 ML Au. Regardless of the order of metal deposition, the alloying in the clusters was active and proceeded toward a structure with a Rh core and a Au shell.67,68 For Rh clusters incorporating deposited Au, Au atoms decorated the surface of the bimetallic clusters; for Au clusters incorporating deposited Rh, Au atoms remained at the cluster surface, as the deposited Rh atoms exchanged positions with the underlying Au atoms.67,68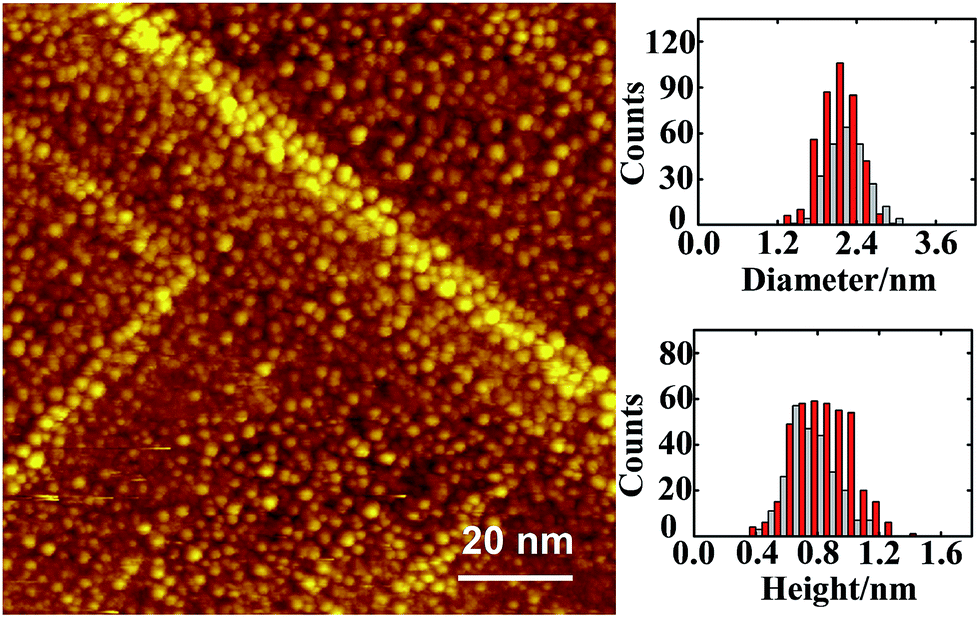 | ||
| Fig. 1 STM image from 1.0 ML Au and subsequently 1.0 ML Rh deposited on thin-film Al2O3/NiAl(100) at 300 K. The insets show histograms of diameter and height of the clusters. The grey bars in the histograms correspond to the STM image; the red bars in the histograms are from that for 1.0 ML Au, and are shown side by side to demonstrate the variation of the size distribution. | ||
The structures of the present Au–Rh bimetallic clusters were resolved with RHEED measurements. Our results show that either Rh/Au or Au/Rh bimetallic clusters were structurally ordered; they had a fcc phase, and grew with their (100) facets parallel to the θ-Al2O3(100) surface and [110] axes along direction [010] of the oxide surface, Au–Rh(100)[110]//Al2O3(100)[010]. Fig. 2 exemplifies the observed RHEED patterns. The patterns are comparable to or even sharper than those from structurally ordered 1.0 ML Rh clusters, indicating the dominance of structurally ordered bimetallic clusters on the surface. Their structures are governed by Rh atoms, even for the Rh/Au bimetallic clusters formed with a smaller proportion of Rh incorporated into Au clusters. Both the orientation and lattice parameters of the bimetallic clusters resembled those of Rh clusters supported on Al2O3/NiAl(100).7 The lattice parameters of the bimetallic clusters formed on the deposition of 1.0 ML Au and 1.0 ML Rh (either order of deposition) were 4.05 ± 0.04 Å, similar to the value of 1.0 ML Rh clusters (4.04 ± 0.06 Å) but different from that of 1.0 ML Au clusters (4.2 ± 0.1 Å).7,69
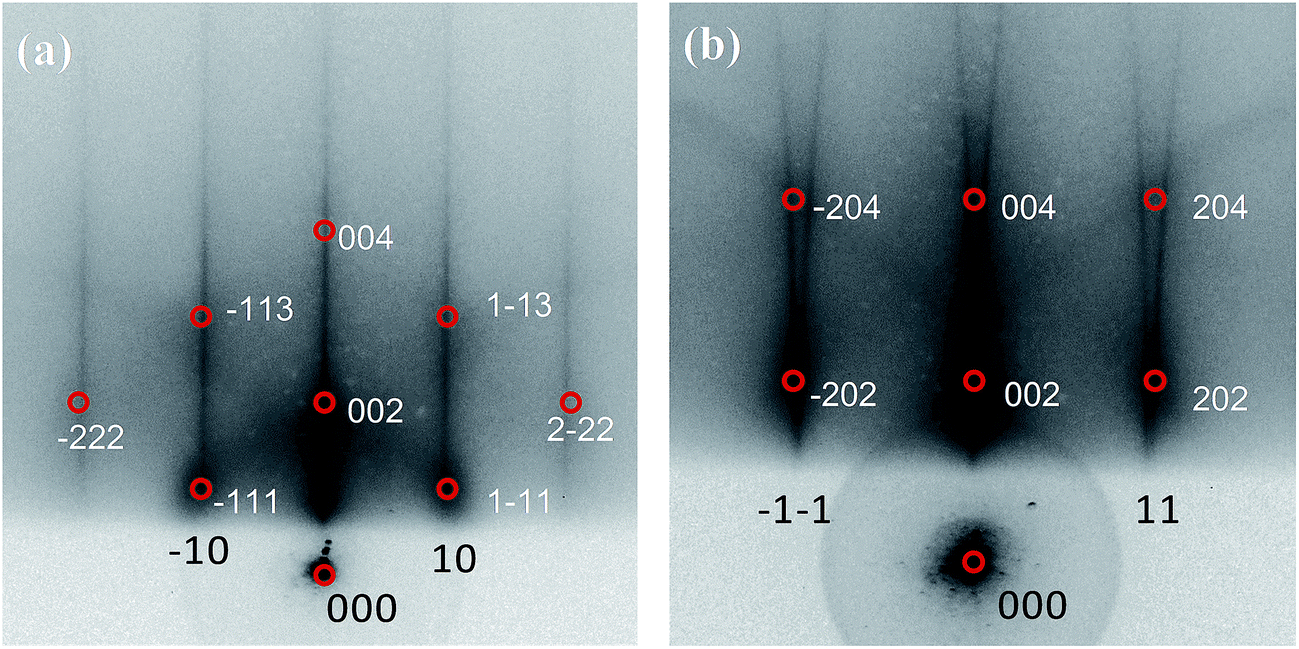 | ||
| Fig. 2 RHEED patterns for 1.0 ML Au and subsequently 1.0 ML Rh deposited on thin-film Al2O3/NiAl(100) at 300 K. (a) and (b) show patterns obtained at azimuth [0−10] and [0−11] respectively. Red circles denote reciprocal-lattice points for the bimetallic clusters Au–Rh (100)[110]//Al2O3(100)[010]. | ||
3.2 Adsorption and interaction of CO on Au–Rh bimetallic clusters
Fig. 3a shows the CO IRAS spectra of 5.0 L CO adsorbed on Au/Rh bimetallic clusters at 110 K and annealed stepwise to selected temperatures. 5.0 L CO is sufficient to saturate the cluster surface. The absorption feature centered about 2100 cm−1 is assigned to the C–O stretching mode (νCO) for CO linearly bonded to low-coordinate Au;40,69–75 at 110 K, no CO adsorbed on terrace Au.70–73 With increased temperature, the absorption signals decreased—the signals became highly attenuated above 200 K and nearly vanished above 350 K; the decrease of the signals is ascribed to the desorption of CO as the characteristic temperatures agree with the thermal desorption for CO on Au sites of Au–Rh bimetallic clusters (denoted as COAu), shown in ESI.† The absorption line for CO on Rh sites (denoted as CORh) at 110 K is less intense but much broader, centered about 2019 cm−1, in a range from 1880 to 2100 cm−1, shown in Fig. 3b (rescaled CO IRAS spectra).8,26,76–78 The CO also adsorbed on top of the Rh atoms, as no absorption feature for CO on bridge or hollow sites, expected in the regime 1770–1900 cm−1,26,76–78 was observed. The much greater absorption intensity from COAu does not correspond to much more numerous Au sites on the bimetallic clusters, but to the greater dipole moment for COAu on the more electronegative Au, as indicated in the DFT calculation below. The TPD experiments with CO as a probe show that the desorption signals from COAu were comparable to those from CORh; 1.0 ML Au did not cover entirely the 1.0 ML Rh clusters (Fig. S1, ESI†). Also, the absorption intensity of COAu is strongly enhanced through a local field effect.38 For CO bound to a regular terrace, the neighboring metal atoms embedded in the metal surface were directly involved in the screening of the dipole moment of the adsorbed CO, whereas, for CO bound to a low-coordinate metal, the CO-binding metal had no altered electronic density and the CO bond decoupled from other metal atoms embedded in the metal surface.38 Such decoupling contributes to the intensity enhancement. The enhancement thus depends on the coordination of the CO-binding metal atom. In the present case, CO adsorbed only on the low-coordinate Au sites, whereas CO adsorbed atop the Rh sites of all kinds. Accordingly, the absorption signals for COAu became evidently more intense.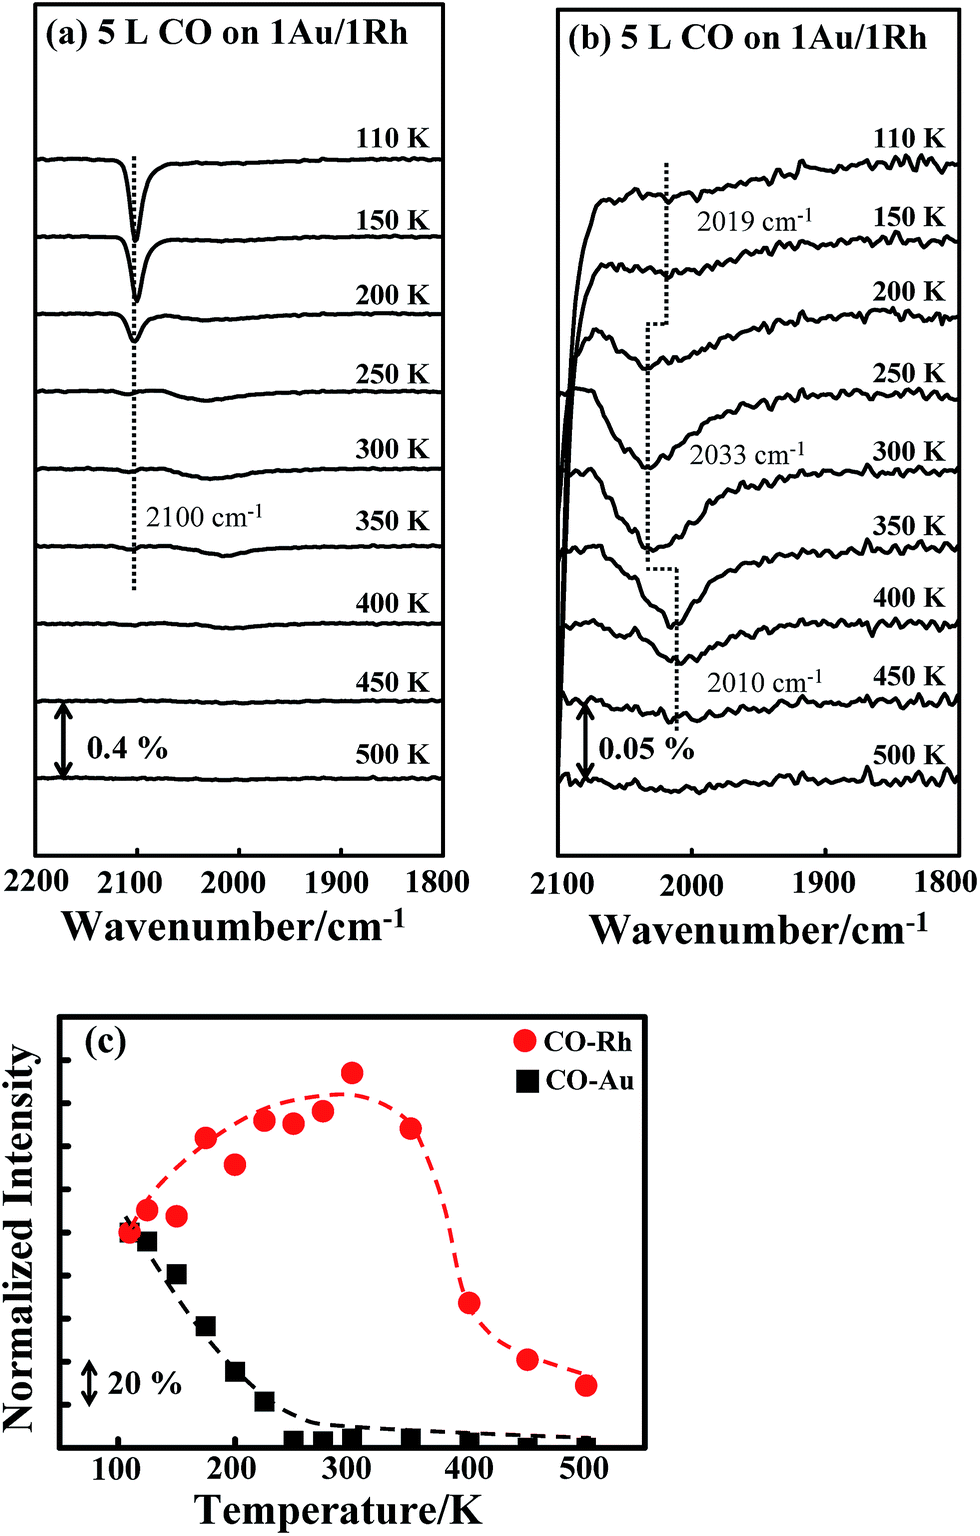 | ||
| Fig. 3 (a) CO IRAS spectra for 5.0 L CO adsorbed on Au/Rh bimetallic clusters at 110 K and annealed to selected temperatures, as indicated; (b) rescaled spectra between wavenumbers 2100 and 1800 cm−1; (c) plot of the integrated absorption intensities for CO on Au (black squares) and Rh (red circles) sites as a function of temperature. The bimetallic clusters were formed on deposition of first 1.0 ML Rh and then 1.0 ML Au onto Al2O3/NiAl(100) at 300 K. | ||
The absorption line for CORh responded to the increased temperature in a manner disparate from that for COAu. The absorption line narrowed and the integrated intensity increased with temperature, up to 300 K; at 300 K, the absorption line narrowed by about 40% (in a range between 1930 and 2070 cm−1), and the intensity increased by 60%. Above 300 K, the absorption signals became less intense with increasing temperature and vanished about 500 K. The decreased signals above 300 K are rationalized with desorption of CORh, as CORh began to desorb above 300 K; the desorption was complete about 500 K, according to our TPD experiments (Fig. S1, ESI†). The narrowing absorption line likely resulted because the effect of inhomogeneous broadening was decreased, as COAu desorbed and the CO dipole–dipole interaction attenuated; with decreased CO concentration on the clusters, the absorption at the large wavenumber side evidently declined. Our DFT calculations shown below indicate the effect of the absorbate–adsorbate interaction on the wavenumber, and support this argument. The integrated absorption intensities for COAu (black squares) and CORh (red circles) as a function of temperature are plotted in Fig. 3c. Both intensities are normalized to those at 110 K. The intensity for CORh grew, relative to that at 110 K, with temperature below 350 K; concurrently, the intensity for COAu decreased to nearly zero at 250–300 K.
A similar effect was observed for CO on Rh/Au bimetallic clusters, shown in Fig. 4a and b. The absorption line (νCO) for COAu, centered about 2100 cm−1, decreased with temperature (Fig. 4a), whereas that for CORh, about 1930–2100 cm−1, continued to narrow and to have increased intensity up to 300 K (Fig. 4b). The plot of the integrated absorption intensities confirms the same trend (Fig. 4c): the intensity for CORh increases by about 40% at 300 K, accompanied by the decreased intensity for COAu. The intensity increase is slightly smaller than that for Au/Rh bimetallic clusters (Fig. 3c), likely because some separate Rh clusters existed—no suppressed absorption was observed for CO on pure Rh clusters, shown below.
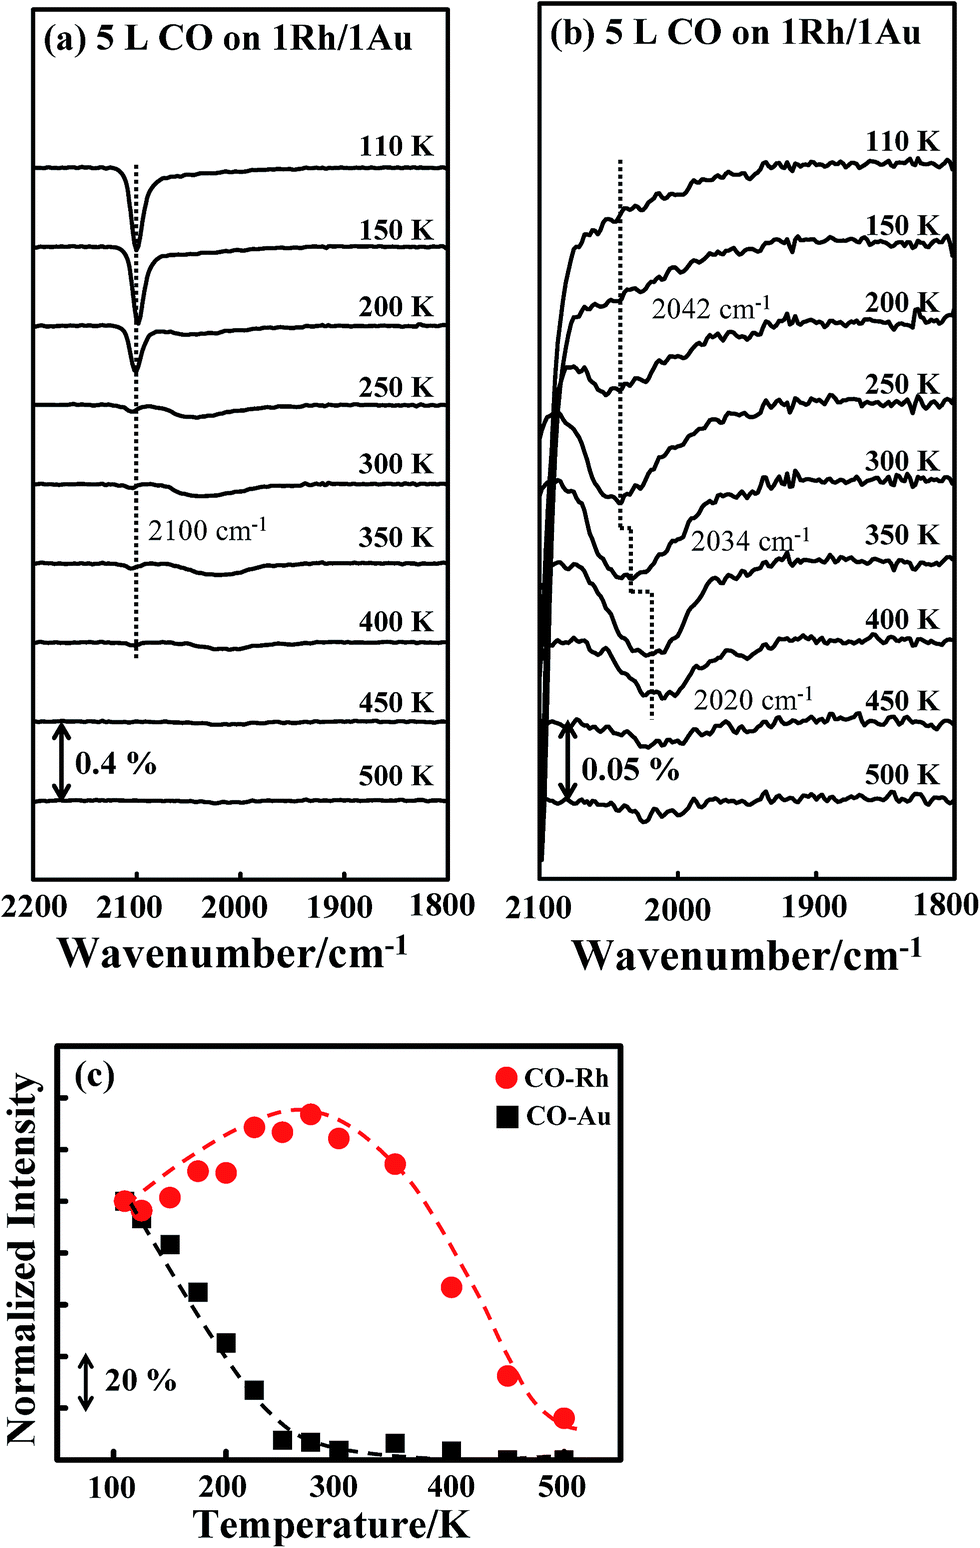 | ||
| Fig. 4 (a) CO IRAS spectra for 5.0 L CO adsorbed on Rh/Au bimetallic clusters at 110 K and annealed to selected temperatures, as indicated; (b) rescaled spectra between wavenumbers 2100 and 1800 cm−1; (c) plot of the integrated absorption intensities for CO on Au (black squares) and Rh (red circles) sites as a function of temperature. The bimetallic clusters were formed on deposition of first 1.0 ML Au and then 1.0 ML Rh onto Al2O3/NiAl(100) at 300 K. | ||
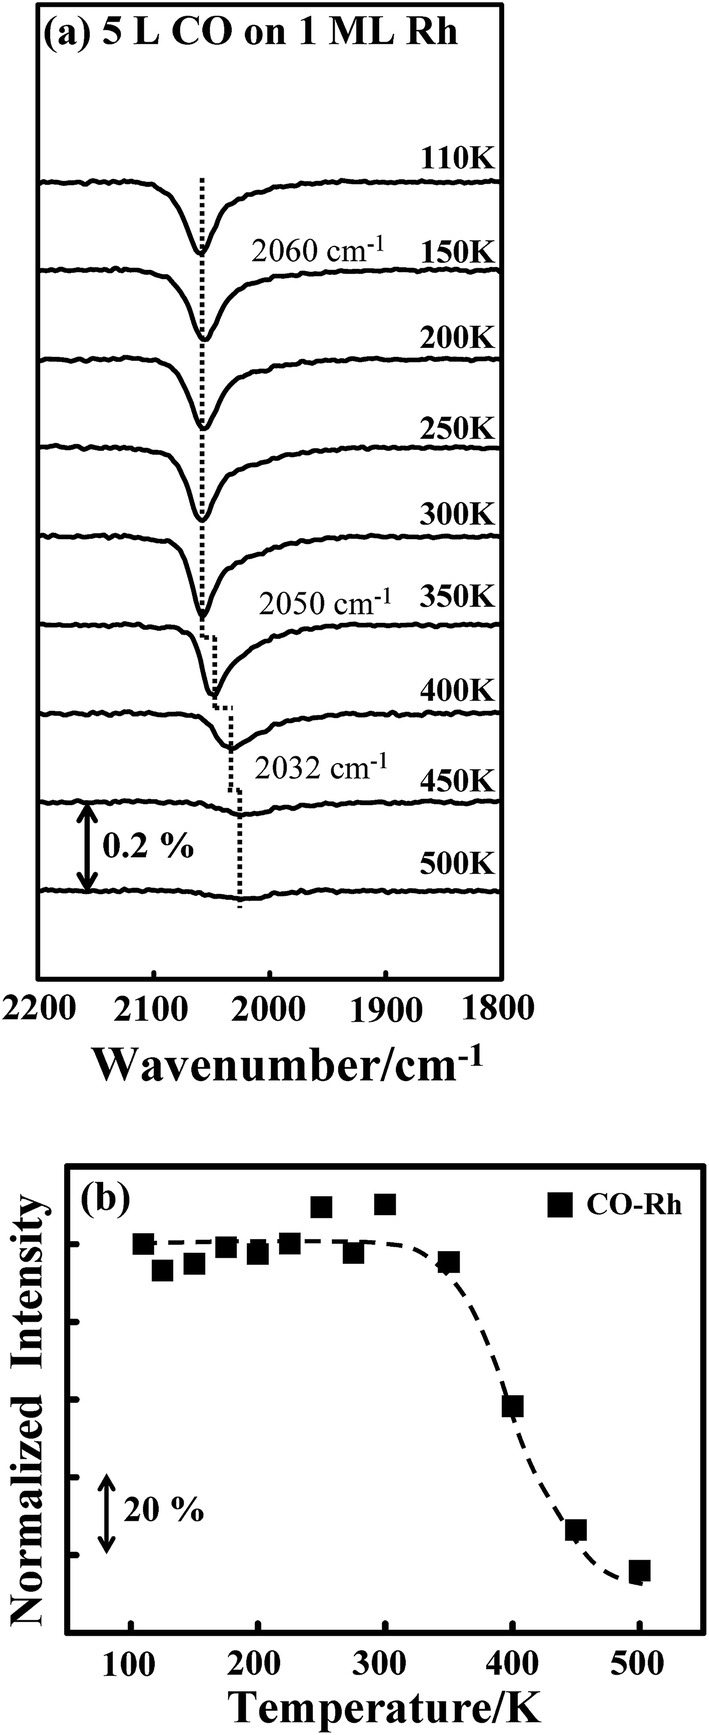
Either the temperature or the quantity of COAu could account for the varied absorption intensity for CORh. As CO was adsorbed at 110 K, the adsorption configuration might not be optimized. Annealing might reorient the adsorbed CO, resulting in a larger dipole and thus greater absorption intensity, as seen previously on supported Pt clusters.40 This possibility is nevertheless excluded by the CO IRAS spectra for CO on Rh clusters. Fig. 5a shows the CO IRAS spectra for 5.0 L CO adsorbed on 1.0 ML Rh clusters at 110 K and annealed stepwise to selected temperatures. The CO absorption line at 110 K is centered about 2060 cm−1; the line width (2000–2100 cm−1) is much smaller than that from CORh on the above bimetallic clusters but the intensity is much greater, due to many more Rh sites. The absorption line altered little with increased temperature, up to 300 K; above 300 K, the line attenuated and shifted to smaller wavenumber, reflecting desorption of CORh. Fig. 5b plots the integrated absorption intensity of CORh on the Rh clusters as a function of temperature. The intensity altered little below 350 K, indicating that CORh had already adsorbed in an optimal configuration at 110 K and the annealing did not reorient the adsorbed CO to enhance the absorption intensity. The varied absorption intensity of CORh is thus associated with COAu; the removal of COAu leads to an enhanced IR absorption of CORh. The diffusion of COAu to the Rh sites to increase CORh and thus the absorption intensity is unlikely as the Rh sites were already saturated with adsorbed CO.
 | ||
| Fig. 5 (a) CO IRAS spectra of 5.0 L-CO adsorbed on 1.0 ML Rh clusters at 110 K and annealed to selected temperatures, as indicated; (b) plot of integrated absorption intensities for CO on Rh clusters as a function of temperature. The Rh clusters were grown at 300 K. | ||
A mechanism for the effect of COAu on the IR absorption intensity of CORh might include an altered surface composition, an altered orientation of CORh and an altered electronic distribution of CO-binding Rh atoms. For an altered surface composition, the adsorbed CO and increased temperature promoted the diffusion of Rh from the cluster interior to the surface during the annealing, which increased the surface Rh sites, as the CO–Rh bond is evidently stronger than the CO–Au bond. Similar structural changes were observed for Au–Pt bimetallic clusters on TiO2(100),75 Au–Rh bimetallic clusters on titanate nanotubes and TiO2(110),79 and Pd–Au bimetallic model catalysts synthesized either as thin films on Mo(110) or as nanoparticles on a TiO2 thin film.80 If this mechanism were responsible for the present observation, the increased absorption signals for CORh, corresponding to the increased Rh sites would be irreversible. The result of our CO IRAS experiments, however, contradicts this expectation. Fig. 6a and b show the CO IRAS spectra for 5.0 L CO molecularly adsorbed on Au/Rh bimetallic clusters at 110 K and annealed to 300 K, respectively. The absorption line centered about 2102 cm−1 in Fig. 6a is assigned to COAu and that about 2031 cm−1 in Fig. 6b to CORh. The signals about 2102 cm−1 in Fig. 6b are due to residual COAu. Re-adsorbing CO on the sample at 110 K increased the signals from COAu and decreased those from CORh (Fig. 6c) again. If the increased Rh sites accounted for the increased signals, re-adsorption of CO on Au sites would not decrease the signals from CORh. Annealing the sample to 300 K again decreased the absorption signals from COAu and enhanced those from CORh (Fig. 6d). The absorption line from CORh in Fig. 6d resembles closely that in Fig. 6b, indicating also that the Rh sites did not increase. The resembling absorption lines before the annealing and after the re-adsorption of CO reflect an unaltered surface structure of the bimetallic clusters.
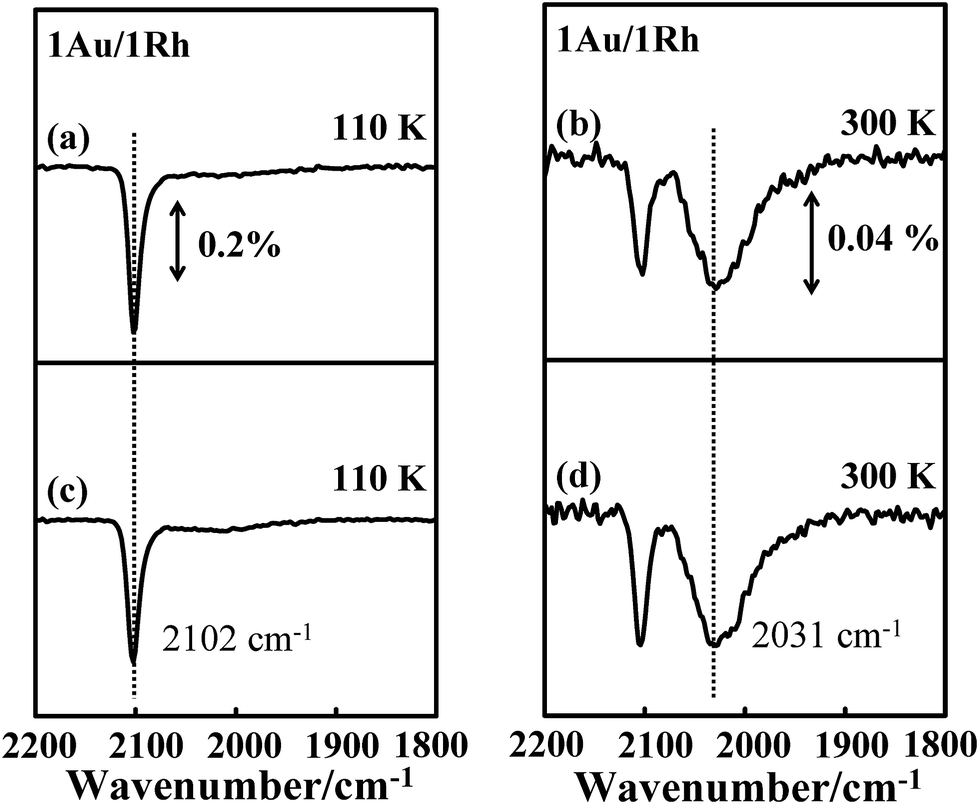 | ||
| Fig. 6 CO IRAS spectra of 5.0 L CO molecularly adsorbed on Au/Rh bimetallic clusters at (a) 110 K and annealed to (b) 300 K; (c) and (d) show spectra of the same sample exposed to 5.0 L CO at 110 K and annealed to 300 K again. The bimetallic clusters in (a)–(d) were formed on deposition of first 1.0 ML Rh and then 1.0 ML Au onto Al2O3/NiAl(100) at 300 K. | ||
We conducted a series of DFT-based simulation to shed light on the effect of COAu on the absorption intensity of CORh. We investigated systematically the adsorbate (CO-coverage dependence), electronic (surface composition) and structural (coordination of CO-binding metals) effects for CO adsorbed on Au and Rh surfaces. First, the structures of single CO molecules adsorbed on extended surfaces forming M(100)1CO (M = Au and Rh) were optimized to serve as references. Second, one, two and eight neighboring CO molecules co-adsorbed on the surfaces were added, forming M(100)2CO, M(100)3CO and M(100)9CO, to reveal the adsorbate effect at a large CO coverage. Third, the surface elements neighboring the CO-binding Au (or Rh) atoms were replaced with Rh (or Au) atoms forming Rh/Au(100)1CO (or Au/Rh(100)1CO) to exhibit an electronic effect induced by the foreign elements in Rh/Au (or Rh/Au) bimetallic clusters. Fourth, single CO molecules adsorbed on the edge site of stepped surface Mstep and the corner site of round-shaped cluster Mcluster were computed to clarify the structural effect while CO adsorbed on the low-coordinate sites. Finally, adsorbing another CO on a foreign element to form Rh/Au(100)2CO and Au/Rh(100)2CO on extended surfaces and low-coordinate sites, which combined adsorbate, electronic and structural effects, was included in the investigation. The optimized structures of these adsorbed CO (Fig. S2 and S3 in ESI†) were employed for the calculations of adsorption energy (Eads), vibrational wavenumber (v), C–O bond length (rCO) and Bader charges (qC and qO), listed in Table S1 in ESI.†
Fig. 7a plots schematically the computed vibrational wavenumbers of COAu (yellow squares) and CORh (cyan circles). These unscaled values of v are comparable to those from the IRAS experiment for CO adsorbed on Au–Rh bimetallic clusters; the slightly smaller values are derived because the DFT calculations predicted longer C–O bonds. v of COAu was distributed in a narrow range but was greater than that of CORh, consistent with observations (Fig. 3 and 4). The greater v of COAu is attributable to its weaker Eads (−0.40 to −0.80 eV) and shorter rCO (1.151–1.153 Å) than those for CORh (−1.69 to −2.48 eV and 1.160–1.171 Å); the narrower distribution of v of COAu corresponds to Eads (0.4 eV) and rCO (0.002 Å) less varied than those for CORh (0.79 eV and 0.011 Å). The charge analysis indicated additionally that COAu has qC (1.77–2.01|e|) more positive than that of CORh (1.54–1.75|e|), which implies a greater dipole moment. The greater dipole moment does not correspond directly to but indicates likely a greater dynamic dipole moment;38,47 the result hence suggests an IR absorption for COAu more intense than that for CORh, which agrees with the above IRAS experiment. The COAu is less negatively charged and has more positively charged C than CORh because the COAu-binding Au, which has greater electronegativity and d electrons of lower energy, obtains more charge donated by COAu; in contrast, CORh has less positive qC and longer rCO because the CORh-binding Rh, which has d electrons of higher energy, back donates more electrons to π* orbital of CORh.
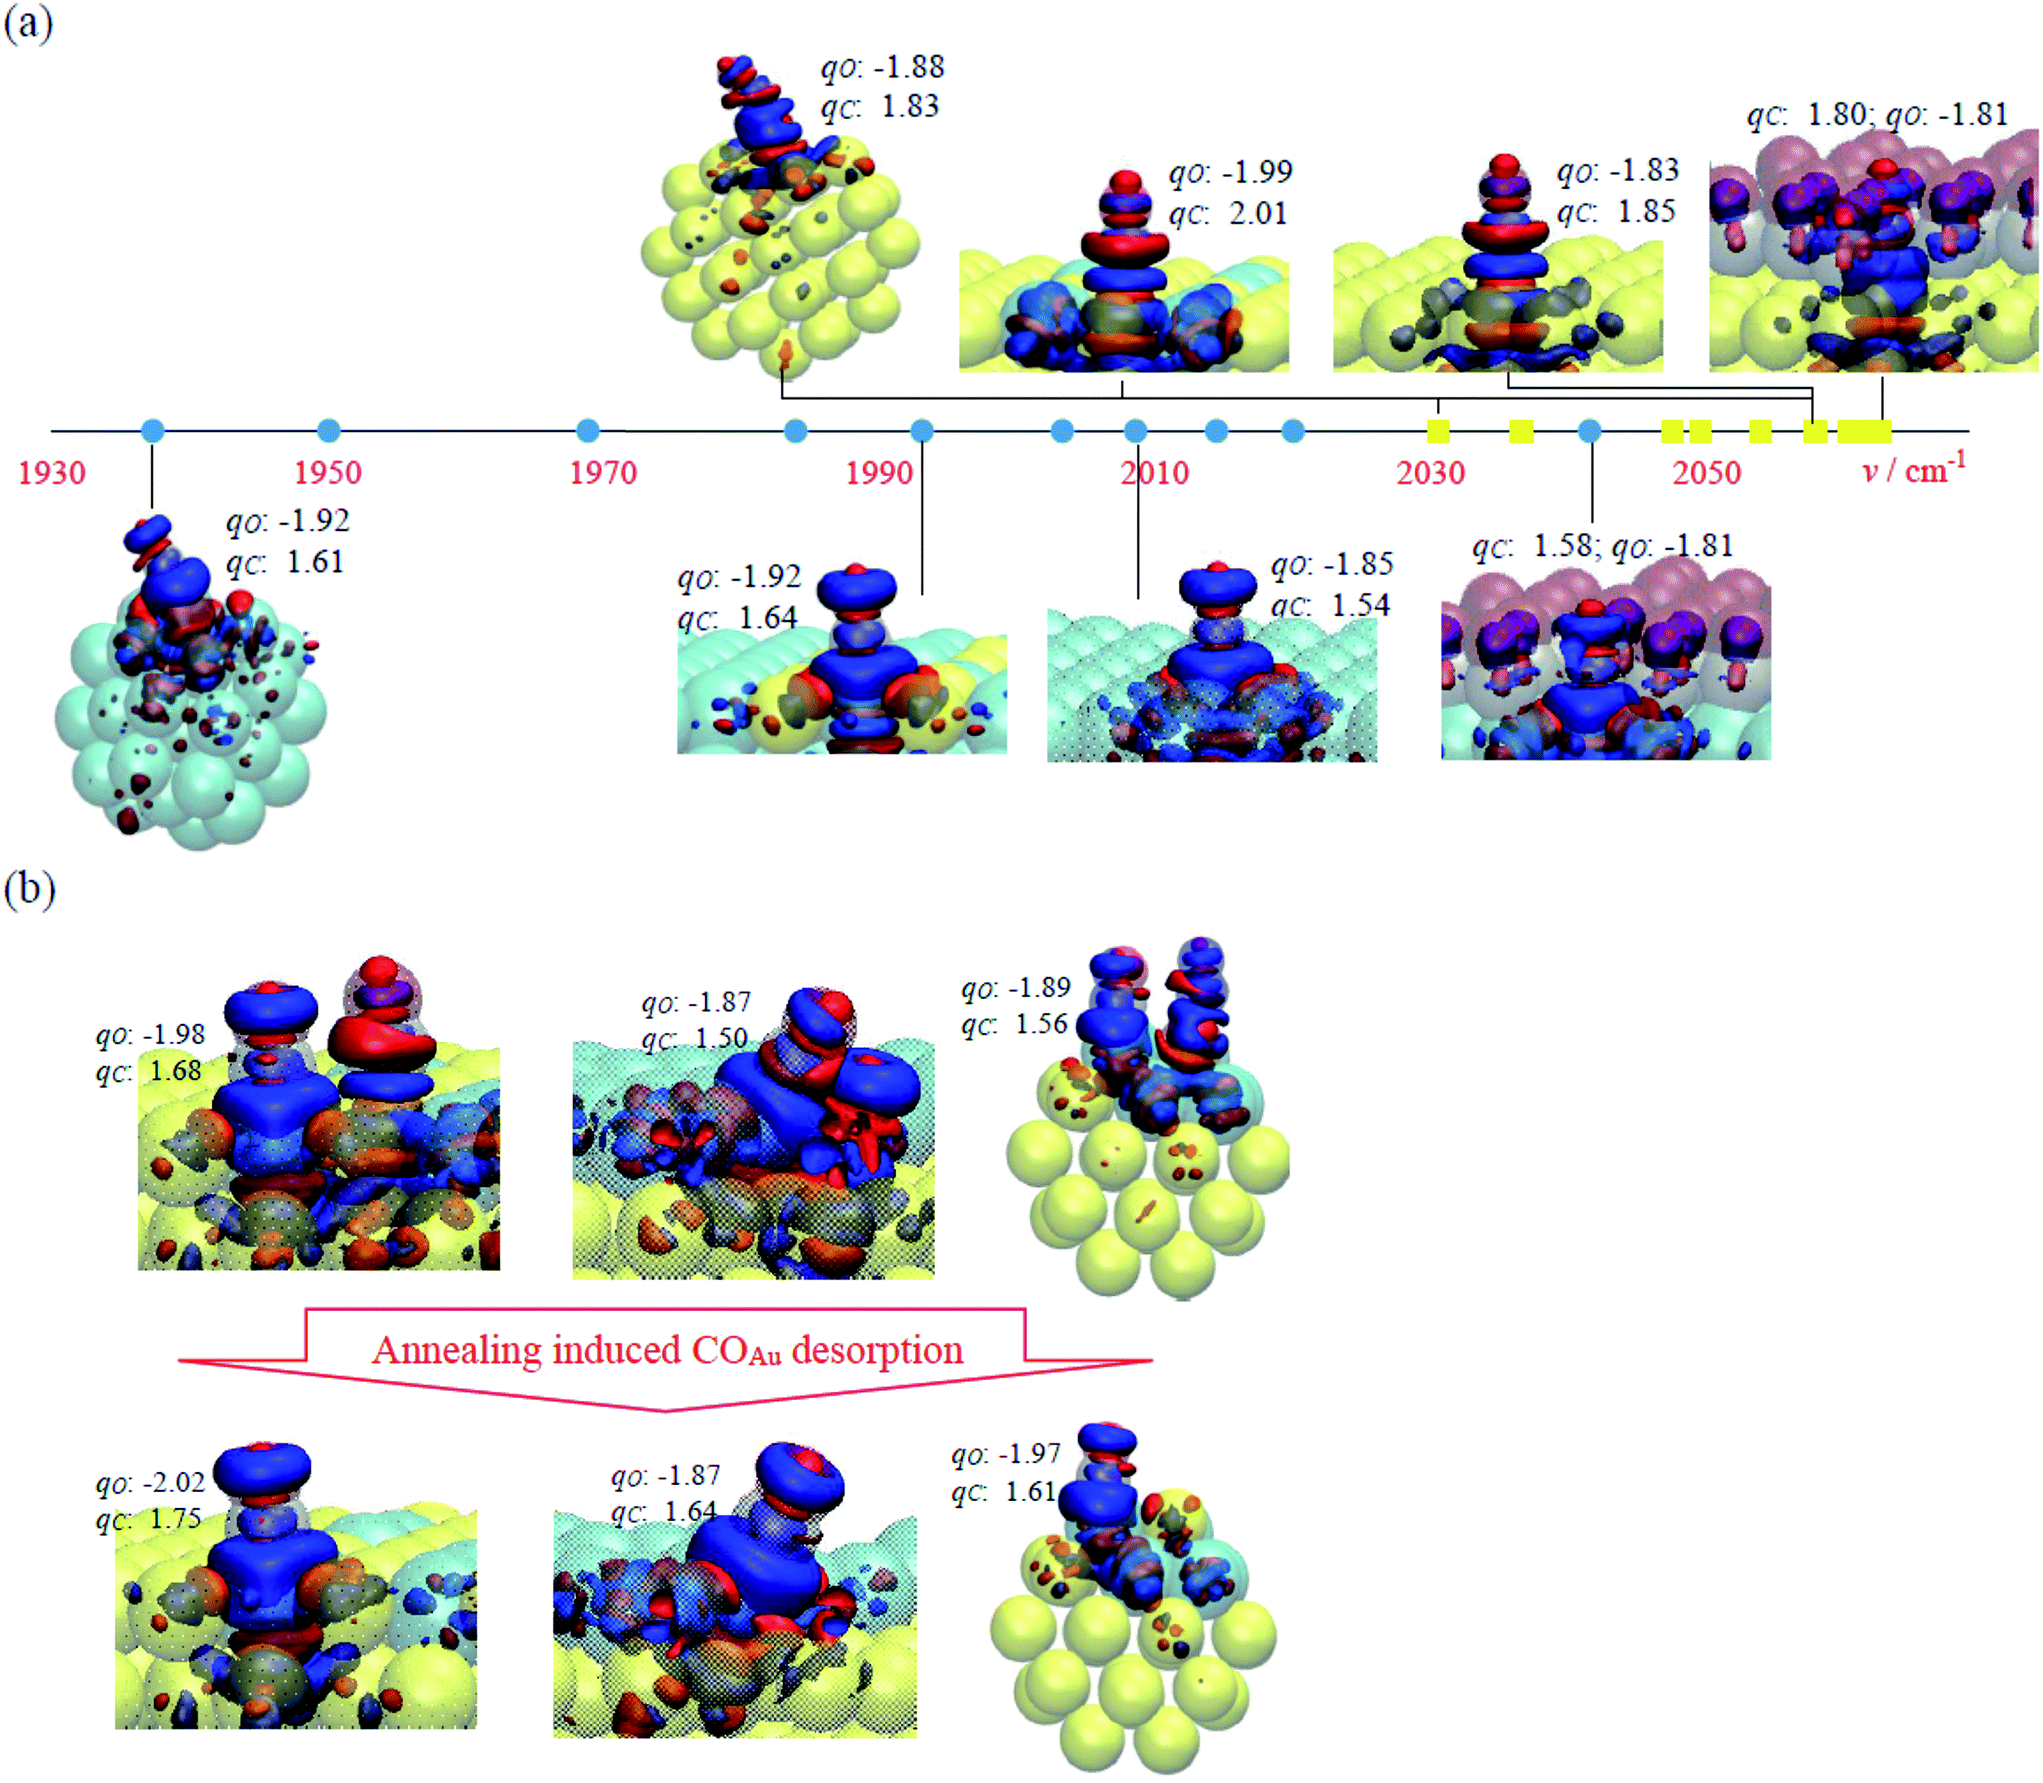 | ||
| Fig. 7 (a) Schematic plot of vibrational wavenumbers of COAu (yellow squares) and CORh (cyan circles) and selected adsorption structures, including M(100)1CO, M(100)9CO, Rh/Au(100)1CO, Au/Rh(100)1CO and Mcluster, and their charge analysis for the investigation of adsorbate, electronic and structural effects. The Au, Rh, C and O atoms are shown as yellow, cyan, grey and red transparent spheres, respectively; the induced charges +0.005 and −0.005|e| are plotted in solid blue and red isosurfaces, respectively; the numbers indicate the Bader charges qC and qO in |e|. The complete results and structures for all COAu and CORh adsorptions are listed in Table S1 and Fig. S2 and S3 in ESI.† (b) Charge analysis for the surface annealing, which results from COAu desorption in Rh/Au(100)2CO → Rh/Au(100)1CO, Rh/Au(100)step-2CO → Rh/Au(100)step-1CO and Rh/Au(100)cluster-2CO → Rh/Au(100)cluster-1CO. | ||
The three effects on the vibrational properties were examined further. First, the adsorbate effect shows that co-adsorbed CO increased v as it decreased Eads and shortened rCO of the neighboring CO. This effect led to the greatest v for COAu (2063 cm−1) and for CORh (2042 cm−1) on the most crowded M(100)9CO, corresponding to the smallest Eads and the shortest rCO (−0.40 eV/1.151 Å for COAu and −1.69 eV/1.161 Å for CORh). Through the stronger CO–Rh interaction, the effect for CORh is more evident: it accounts for the wider distribution of v and the greater sensitivity of v to the CO coverage (Fig. 3 and 4). Second, the electronic effect is insignificant on v but notable on qC and qO: the IR absorption is enhanced. Rh/Au(100)1CO has the largest qC (2.01|e| for COAu and 1.75|e| for CORh) and smallest qO (−1.99|e| for COAu and −2.02|e| for CORh), implying the largest dipole moment and greatest IR absorption intensity. Third, the structural effect changes v significantly. When CO adsorbs on low-coordinate Au or Rh, the vibrational wavenumber decreased because Eads was strengthened and rCO was substantially increased. Both COAu and CORh have the smallest v (2031 and 1937 cm−1) on Mcluster, corresponding to the largest Eads and the largest rCO (−0.80 eV/1.153 Å for COAu and −2.45 eV/1.171 Å for CORh). Accordingly, the measured v of CORh decreased with annealing (Fig. 5), not only as the CO coverage decreased but also as the remaining CORh adsorbed on low-coordinate sites and had greater Eads.
Our simulation indicates that the desorption of COAu enhanced the IR absorption of CORh through a charge transfer between Au and Rh. When COAu desorbed from Rh/Au(100)2CO and Au/Rh(100)2CO, the residual CORh showed changes of charge: qC became more positive (1.68 → 1.75|e| on Rh/Au(100) and 1.60 → 1.64|e| on Au/Rh(100)) and qO became more negative (−1.98 → −2.02|e| on Rh/Au(100) and −1.89 → −1.92|e| on Au/Rh(100)). A similar effect was also shown for the step and corner sites: for qC, 1.50 → 1.64|e| on Rh/Austep and 1.56 → 1.61|e| on Rh/Aucluster, and for qO, −1.87 → −1.87|e| on Rh/Austep (unaltered) and −1.89 → −1.97|e| on Rh/Aucluster (Fig. 7b). This result indicates enhanced dipole moments of the residual CORh and thus their IR absorption. The orientation of CORh after the desorption of COAu altered little, so it accounts little for the enhanced IR absorption. We argue that the charge from the desorbing COAu donated to Au was compensated by increased charge transfer from Rh to Au, due to the greater electronegativity of Au; the electron-deficient Rh therefore grabbed more electrons from CORh, which resulted in more positive qC and a larger dipole moment of CORh.
4. Conclusion
With IRAS and DFT calculations, we studied the interaction of COAu and CORh on Au–Rh bimetallic nanoclusters supported on an ordered thin film of Al2O3/NiAl(100). The bimetallic clusters were grown on depositing sequentially vapors of Au and Rh onto the Al2O3/NiAl(100) surface at 300 K; they were structurally ordered, having a fcc phase and growing with their facets (001) parallel to the oxide surface, and had a diameter 1.2–3.0 nm and height 0.4–1.2 nm. COAu on the bimetallic clusters exhibited a significant IR absorption with a small line width, whereas CORh had a broad and weak absorption line, in contrast to its counterpart on pure Rh clusters. The narrow line for COAu resulted from a weaker Eads and a consequent insensitivity of vibrational wavenumber to the CO coverage (adsorbate effect) and the coordination of COAu-binding Au atom (electronic and structural effect); the greater IR absorption corresponded to a greater dipole moment of COAu, associated largely with the electronegativity and coordination of COAu-binding Au. Upon increasing the temperature to remove COAu, the absorption line for CORh narrowed and the intensity increased; the intensity was enhanced by 40–60% and the line width decreased by 30–40% at 300 K, at which only limited COAu remained. As the effect was reversible, no structural alteration of the bimetallic clusters was induced by the adsorption of CO. We argue that the desorption of COAu decreased the CO–CO interaction and the inhomogeneous broadening, leading to a decreased line width, but enhanced the charge transfer between Au and neighboring CORh-binding Rh, and thus altered the charge distribution of CORh, yielding an increased dipole moment of CORh and an increased IR absorption.Acknowledgements
National Science Council provided support (NSC-103-2112-M-008-014-MY2) for the work. CPU time at Taiwan's National Center for High-performance Computing (NCHC) and Department of Applied Chemistry in Private Chinese Culture University (PCCU) was greatly appreciated.References
- B. Beden, J.-M. Léger and C. Lamy, Electrocatalytic Oxidation of Oxygenated Aliphatic Organic Compounds at Noble Metal Electrodes, Plenum Publishers, New York, 1992 Search PubMed.
- G. A. Somorjai, Introduction to Surface Chemistry and Catalysis, Wiley, New York, 1994 Search PubMed.
- J. R. Rostrup-Nielsen, Catal. Rev., 2004, 46, 247–270 CAS.
- G. T. Burstein, C. J. Barnett, A. R. Kucernak and K. R. Williams, Catal. Today, 1997, 38, 425–437 CrossRef CAS.
- A. Hamnett, Catal. Today, 1997, 38, 445–457 CrossRef CAS.
- K. R. Williams and G. T. Burstein, Catal. Today, 1997, 38, 401–410 CrossRef CAS.
- T.-C. Hung, T.-W. Liao, Z.-H. Liao, P.-W. Hsu, P.-Y. Cai, H. Lee, Y.-L. Lai, Y.-J. Hsu, H.-Y. Chen, J.-H. Wang and M.-F. Luo, ACS Catal., 2015, 5, 4276–4287 CrossRef CAS.
- T.-C. Hung, T.-W. Liao, Z.-H. Liao, P.-W. Hsu, P.-Y. Cai, W.-H. Lu, J.-H. Wang and M.-F. Luo, RSC Adv., 2016, 3830–3839 RSC.
- R. Burch, Phys. Chem. Chem. Phys., 2006, 8, 5483 RSC.
- C. Ratnasamy and J. P. Wagner, Catal. Rev., 2009, 51, 325 CAS.
- G. Bond, Gold Bull., 2009, 42, 337 CrossRef CAS.
- J. Gong and C. B. Mullins, Acc. Chem. Res., 2009, 42, 1063–1073 CrossRef CAS PubMed.
- J. Gong and C. B. Mullins, J. Am. Chem. Soc., 2009, 131, 10473 CrossRef PubMed.
- J. G. Wang and B. Hammer, Phys. Rev. Lett., 2006, 97, 136107 CrossRef CAS PubMed.
- J. Zhang, H. Jin, M. B. Sullivan, F. C. H. Lim and P. Wu, Phys. Chem. Chem. Phys., 2009, 11, 1441–1446 RSC.
- D. D. Hibbitts, B. T. Loveless, M. Neurock and E. Iglesia, Angew. Chem., Int. Ed., 2013, 39, 12273–12278 CrossRef PubMed.
- S. Andersson, M. Frank, A. Sandell, A. Giertz, B. Brena, P. A. Brühwiler, N. Mårtensson, J. Libuda, M. Baümer and H.-J. Freund, J. Chem. Phys., 1998, 108, 2967 CrossRef CAS.
- O. R. Inderwildi, S. J. Jenkins and D. A. King, Angew. Chem., Int. Ed., 2008, 47, 5253–5255 CrossRef CAS PubMed.
- Y.-H. Zhao, K. Sun, X. Ma, J. Liu, D. Sun, H.-Y. Su and W.-X. Li, Angew. Chem., Int. Ed., 2011, 50, 5335–5338 CrossRef CAS PubMed.
- J. Chen and Z.-P. Liu, J. Am. Chem. Soc., 2008, 130, 7929–7937 CrossRef CAS PubMed.
- I. A. W. Filot, R. J. P. Broos, J. P. M. van Rijn, G. J. H. A. van Heugten, R. A. van Santen and E. J. M. Hensen, ACS Catal., 2015, 5, 5453–5467 CrossRef CAS.
- N. Yang, A. J. Medford, X. Liu, F. Studt, T. Bligaard, S. F. Bent and J. K. Nørskov, J. Am. Chem. Soc., 2016, 138, 3705–3714 CrossRef CAS PubMed.
- H. P. Bonzel and G. Pirug, The Chemical Physics of Solid Surfaces, Elsevier, Amsterdam, 1st edn, 1993 Search PubMed.
- L. J. Whitman and J. W. Ho, Chem. Phys., 1989, 90, 6018 CAS.
- A. P. v. Bavel, M. J. P. Hopstaken, A. P. v. Bavel, M. J. P. Hopstaken, D. Curulla-Ferré, J. W. Niemantsverdriet, J. J. Lukkien and P. A. J. Hilbers, J. Chem. Phys., 2003, 119, 524 CrossRef.
- M. M. M. Jansen, J. Gracia, B. E. Nieuwenhuys and J. W. Niemantsverdriet, Phys. Chem. Chem. Phys., 2009, 11, 10009–10016 RSC.
- D. L. S. Nieskens, M. M. M. Jansen, A. P. V. Bavel, D. Curulla-Ferré and J. W. Niemantsverdriet, Phys. Chem. Chem. Phys., 2006, 8, 624–632 RSC.
- W. Braun, H.-P. Steinruck and G. Held, Surf. Sci., 2005, 574, 193 CrossRef CAS.
- E. L. Hardegree, P. Ho and J. M. White, Surf. Sci., 1986, 165, 488 CrossRef CAS.
- D. Hoge, M. Tueshaus and A. M. Bradshaw, Surf. Sci., 1988, 207, L935–L942 CrossRef CAS.
- S. Johnson and R. J. Madix, Surf. Sci., 1981, 108, 77–98 CrossRef CAS.
- S. W. Jorgensen and R. J. Madix, Surf. Sci., 1985, 163, 19 CrossRef CAS.
- M. Kiskinova, Surf. Sci., 1987, 182, 150 CrossRef CAS.
- M. Kiskinova and D. W. Goodman, Surf. Sci., 1981, 108, 64 CrossRef CAS.
- T. Yamada, Z. Runsheng, Y. Iwasawa and K. Tamaru, Surf. Sci., 1988, 205, 82 CrossRef CAS.
- R. Zenobi, J. Xu and J. T. Y. Jr, Surf. Sci., 1992, 276, 241–248 CrossRef CAS.
- The Nature of the surface chemical bond, ed. T. N. Rhodin and G. Ertl, North-Holland Pub. Co., sole distributed for the U.S.A. and Canada, Elsevier North-Holland, Amsterdam, New York, New York, 1979 Search PubMed.
- T. Risse, A. Carlsson, M. Bäumer, T. Klüner and H. J. Freund, Surf. Sci., 2003, 546, L829–L835 CrossRef CAS.
- Advances in Infrared and Raman Spectroscopy, ed. N. Sheppard, T. T. Nguyen, i. R. E. Hester and R. J. H. Clark, Heyden and Son, 1979 Search PubMed.
- Y. D. Li, T. C. Hong, T. W. Liao and M. F. Luo, Surf. Sci., 2013, 618, 132–139 CrossRef CAS.
- M. Bäumer and H.-J. Freund, Prog. Surf. Sci., 1999, 61, 127–198 CrossRef.
- P. Gassmann, R. Franchy and H. Ibach, Surf. Sci., 1994, 319, 95–109 CrossRef CAS.
- R.-P. Blum, D. Ahlbehrendt and H. Niehus, Surf. Sci., 1998, 396, 176–188 CrossRef CAS.
- V. Maurice, N. Frémy and P. Marcus, Surf. Sci., 2005, 581, 88–104 CrossRef CAS.
- M. C. Zei, C.-S. Lin, W.-H. Wen, C.-I. Chiang and M.-F. Luo, Surf. Sci., 2006, 600, 1942–1951 CrossRef CAS.
- A. Hamnett, Catal. Today, 1997, 38, 445–457 CrossRef CAS.
- F. M. Hoffmann, Surf. Sci. Rep., 1983, 3, 107–192 CrossRef CAS.
- N. Frémy, V. Maurice and P. Marcus, J. Am. Ceram. Soc., 2003, 86, 669–675 CrossRef.
- M. F. Luo, C. I. Chiang, H. W. Shiu, S. D. Sartale and C. C. Kuo, Nanotechnology, 2006, 17, 360 CrossRef CAS.
- M. F. Luo, W. H. Wen, C. S. Lin, C. I. Chiang, S. D. Sartale and M. S. Zei, Surf. Sci., 2007, 601, 2139–2146 CrossRef CAS.
- G. Kresse and J. Hafner, Phys. Rev. B: Condens. Matter Mater. Phys., 1993, 47, 558–561 CrossRef CAS.
- G. Kresse and J. Furthmüller, Phys. Rev. B: Condens. Matter Mater. Phys., 1996, 54, 11169–11186 CrossRef CAS.
- G. Kresse and J. Hafner, Phys. Rev. B: Condens. Matter Mater. Phys., 1994, 49, 14251–14269 CrossRef CAS.
- J. P. Perdew, K. Burke and M. Ernzerhof, Phys. Rev. Lett., 1996, 77, 3865–3868 CrossRef CAS PubMed.
- J. P. Perdew, J. A. Chevary, S. H. Vosko, K. A. Jackson, M. R. Pederson, D. J. Singh and C. Fiolhais, Phys. Rev. B: Condens. Matter Mater. Phys., 1992, 46, 6671–6687 CrossRef CAS.
- J. P. Perdew and Y. Wang, Phys. Rev. B: Condens. Matter Mater. Phys., 1992, 45, 13244–13249 CrossRef.
- P. E. Blöchl, Phys. Rev. B: Condens. Matter Mater. Phys., 1994, 50, 17953–17979 CrossRef.
- G. Kresse and D. Joubert, Phys. Rev. B: Condens. Matter Mater. Phys., 1999, 59, 1758–1775 CrossRef CAS.
- H. J. Monkhorst and J. D. Pack, Phys. Rev. B: Condens. Matter Mater. Phys., 1976, 13, 5188–5192 CrossRef.
- G. Mills, H. Jonsson and G. K. Schenter, Surf. Sci., 1995, 324, 305–337 CrossRef CAS.
- X. Gonze, Phys. Rev. B: Condens. Matter Mater. Phys., 1997, 55, 10337 CrossRef CAS.
- G. Kresse, J. Furthmüller and J. Hafner, Europhys. Lett., 1995, 32, 729–734 CrossRef CAS.
- R. W. F. Bader, A Quantum Theory, Oxford University Press, Oxford, 1990 Search PubMed.
- G. Henkelman, A. Arnaldsson and H. Jónsson, Comput. Mater. Sci., 2006, 36, 254 CrossRef.
- E. Sanville, S. D. Kenny, R. Smith and G. Henkelman, J. Comput. Chem., 2007, 28, 899 CrossRef CAS PubMed.
- Z. Zhang and M. G. Lagally, Science, 1997, 276, 377–383 CrossRef CAS PubMed.
- L. Óvári, L. Bugyi, Z. Majzik, A. Berkó and J. Kiss, J. Phys. Chem. C, 2008, 112, 18011–18016 Search PubMed.
- L. Óvári, A. Berkó, N. Balázs, Z. Majzik and J. Kiss, Langmuir, 2010, 26, 2167–2175 CrossRef PubMed.
- G.-R. Hu, C.-S. Chao, H.-W. Shiu, C.-T. Wang, W.-R. Lin, Y.-J. Hsu and M.-F. Luo, Phys. Chem. Chem. Phys., 2011, 13, 3281–3290 RSC.
- D. C. Meier and D. W. Goodman, J. Am. Chem. Soc., 2004, 126, 1892–1899 CrossRef CAS PubMed.
- C. Lemire, R. Meyer, S. K. Shaikhutdinov and H.-J. Freund, Surf. Sci., 2004, 552, 27–34 CrossRef CAS.
- C. Winkler, A. J. Carew, S. Haq and R. Raval, Langmuir, 2003, 19, 717–721 CrossRef CAS.
- W.-L. Yim, T. Nowitzki, M. Necke, H. Schnars, P. Nickut, J. Biener, M. M. Biener, V. Zielasek, K. Al-Shamery, T. Klüner and M. Bäumer, J. Phys. Chem. C, 2007, 111, 445–451 CAS.
- D. C. Skelton, R. G. Tobin, D. K. Lambert, C. L. DiMaggio and G. B. Fisher, J. Phys. Chem. B, 1999, 103, 964–971 CrossRef CAS.
- S. A. Tenney, J. S. Ratliff, C. C. Roberts, W. He, S. C. Ammal, A. Heyden and D. A. Chen, J. Phys. Chem. C, 2010, 114, 21652–21663 CAS.
- M. Frank, R. Kühnemuth, M. Bäumer and H. J. Freund, Surf. Sci., 1999, 427–428, 288–293 CrossRef CAS.
- G. Krenn, I. Bako and R. Schennach, J. Chem. Phys., 2006, 124, 144703 CrossRef CAS PubMed.
- H. P. Koch, P. Singnurkar, R. Schennach, A. Stroppa and F. Mittendorfer, J. Phys. Chem. C, 2008, 112, 806–812 CAS.
- J. Kiss, L. Óvári, A. Oszkó, G. Pótári, M. Tóth, K. Baán and A. Erdóhelyi, Catal. Today, 2012, 181, 163–170 CrossRef CAS.
- F. Gao, Y. L. Wang and D. W. Goodman, J. Phys. Chem. C, 2010, 114, 4036 CAS.
Footnote |
| † Electronic supplementary information (ESI) available. See DOI: 10.1039/c7ra00482f |
| This journal is © The Royal Society of Chemistry 2017 |