 Open Access Article
Nitrogen-doped porous activated carbon derived from cocoon silk as a highly efficient metal-free electrocatalyst for the oxygen reduction reaction†
Peng Fua,
Lihua Zhou*a,
Lihua Suna,
Baohua Huanga and
Yong Yuan *b
*b
aInstitute of Natural Medicine and Green Chemistry, School of Chemical Engineering and Light Industry, Guangdong University of Technology, Guangzhou, 510006, P. R. China. E-mail: qhzhoulh@gdut.edu.cn
bGuangdong Key Laboratory of Integrated Agro-environmental Pollution Control and Management, Guangdong Institute of Eco-Environmental Science and Technology, 510650, P. R. China. E-mail: yuanyong@soil.gd.cn
First published on 28th February 2017
Abstract
Heteroatom-doped porous carbon has attracted considerable research interest due to its effective catalytic activity towards the oxygen reduction reaction (ORR). In this study, nitrogen-doped porous activated carbon (PAC) is fabricated via a facile heat-treatment and chemical activation of cocoon silk in an inert gas atmosphere. The prepared PAC exhibits excellent ORR catalytic performances with the half-wave potential of −0.13 V and an onset potential of +0.03 V vs. Ag/AgCl, which match the Pt/C catalyst and are superior to various other reported biomass derived metal-free carbon catalysts. This catalytic proficiency is attributed to the plentiful electronegative N atoms within the carbon lattice, large surface area and high porosity. The PAC also exhibits high stability, durability and an effective tolerance effect to methanol crossover. In addition, the as-prepared PAC shows remarkable feasibility as a cathodic catalyst for microbial fuel cells (MFCs). This study provides a new approach for the synthesis of metal-free carbon nanomaterials derived from natural materials, and broadens the design for the fabrication of ORR catalysts.
1. Introduction
The oxygen reduction reaction (ORR) is a critical reaction occurring at the cathode in new energy generation technologies, such as fuel cells and metal–air batteries.1–3 However, the sluggish reaction kinetics of the ORR significantly hinder the performance of these energy generation technologies.4–6 Active catalysts are usually used to accelerate the reaction rate of the ORR. Thus far, platinum (Pt)-based materials have been considered as the most efficient catalysts to facilitate the ORR process by catalyzing O2 into H2O via a four-electron pathway with a lower over-potential and higher current response.7–9 However, the wide commercialization of Pt-based catalysts is greatly impeded by their high cost, low natural abundance, poor stability and low poisoning tolerance.8,10,11 Thus, it is highly desirable to develop alternatives to Pt-based catalysts to drive the boom in new energy generation technologies.Recently, N-doped porous carbon materials have been investigated as ideal candidates to replace the Pt-based catalysts toward the ORR due to their large specific surface areas, good electrical conductivities, and high chemical stability.12–14 Soft- or hard-template carbonization methods have been mainly used to prepare heteroatom-doped porous carbon catalysts using C- and N-enriched chemicals as precursors.15,16 However, relatively expensive and harmful C/N precursors are usually used, and tedious and time-consuming procedures are involved in the production of carbon catalysts. In this regard, previous studies have shown the simple conversion of natural N-enriched materials into N-doped carbon materials via facile heat-treatment, which represents a promising potential alternative to the tedious and expensive methods. Numerous N-doped carbon nanomaterials have been produced from moss, microorganisms, Typha orientalis, Amaranthus, okara, and bamboo fungus, which have shown significant potential as catalysts toward the ORR.17–22 Cocoon silk (CS), which is known as a filamentous natural proteinic fiber, is a representative natural N-enriched material.23–25 Raw CS is made of sericin and fibroin. The former covers the surface of CS and can be removed through heat-treatment, and the latter, which contains numerous types of amino acids such as glycine, alanine and serine, accounts for almost 75% of the raw CS.26,27 CS can severe as an effective precursor material to produce carbon catalysts for the ORR. For example, Iwazaki et al. successfully prepared activated carbon with high catalytic activity for the ORR via the carbonization and stream-activation of CS;28,29 however, the steam activation process is relatively complex and time-consuming. In addition, Wang et al. reported CS-derived graphene-like carbon with high catalytic activity for the ORR.30 However, they used chemical vapor deposition (CVD) methods for pre-treatment, which are often very tedious and expensive because elaborate and precise vacuum-based fabrication is required. In this regard, it is important to develop mild preparation approaches with high-efficiency and easy operation procedures to prepare high-performance carbon nanomaterials from CS.
Herein, we present a highly-efficient, low-cost approach to prepare N-doped porous carbon materials from natural CS fibers via a facile heat-treatment and chemical activation. The resulting activated carbon shows excellent catalytic activity and admirable stability for the ORR in alkaline media. The high ORR activity of the catalyst is attributed to its high surface area, hierarchical porous distribution and high content of nitrogen species. This preparation method provides a convenient utility of silk, and exhibits an effective approach to synthesize biomass derived carbonaceous nanomaterials.
2. Experimental
2.1. Preparation of N-doped PAC derived from cocoon silk
First, cocoon silk was obtained from white cocoons that were boiled in water for 30 min, followed by washing with distilled water and drying at 60 °C for 12 h. Second, the silk was heat treated in an alumina crucible at 300 °C at a heating rate of 5 °C min−1 under an N2 atmosphere for 1 h. The resulting solid product was mixed with ZnCl2 at a ratio of 1/2 (g g−1) by grinding sufficiently for chemical activation. Finally, the mixture was carbonized in an alumina crucible at 800 °C at a heating rate of 5 °C min−1 under N2 atmosphere for 1 h. The resulting black product was treated with a 2 mol L−1 HCl solution under stirring for 12 h, washed with distilled water, and finally dried at 60 °C. For comparison, the chemically activated samples were carbonized in an alumina crucible at 600, 700 and 900 °C under the same condition for 1 h. These final porous activated carbon products were denoted as PAC-T, where T is the final carbonized temperature. A control sample was directly carbonized at 800 °C without activation and denoted as DC-800.2.2. Structural characterization
Field emission scanning electron microscopy (FE-SEM, S-4800, Hitachi, Ltd., Tokyo, Japan) was used to investigate the morphology and microstructure of the as-prepared products. Crystallite structures were determined by XRD (X'Pert Pro, Philips). Raman spectra were recorded on a LabRAM Aramis confocal microscope Raman spectrometer system (Renishaw Instruments, England). N2 adsorption–desorption isotherm measurements were performed at 300 °C for 8 h on a sorptometer (Model 1800, Carlo Erba Instruments, Italy). The pore size distribution (PSD) was calculated via the Barrett–Joyner–Halenda (BJH) model and specific surface areas were calculated using the Brunauer–Emmett–Teller (BET) method. Surface chemical species were examined via X-ray photoelectron spectroscopy (XPS, Thermal Scientific ESCALAB 250Xi spectrometer, USA) and quantitative energy dispersive X-ray spectroscopy (EDS) mapping by field emission scanning electron microscopy (FE-SEM, S-4800, Hitachi, Ltd., Tokyo, Japan).2.3. Electrochemical measurements
Prior to electrochemical measurements, 2.0 mg of PAC-T was dispersed in a mixed solution of 200 μL ethanol, 100 μL distilled water and 10 μL Nafion (5 wt%) to prepare catalyst inks. A well-cleaned glassy carbon electrode (GCE, 5.0 mm in diameter) coated with 10 μL of catalyst ink served as the working electrode, and an Ag/AgCl electrode and Pt sheet were used as the reference and counter electrode, respectively. Cyclic voltammetry (CV) and linear sweep voltammetry (LSV) curves were obtained in an O2 and/or N2-saturated 0.1 mol L−1 KOH solution at a scan rate of 10 mV s−1 in a conventional three-electrode cell connected to an electrochemical workstation (CHI660D, Shanghai Chenhua Instruments Co., China). Koutecky–Levich (K–L) plots at various electrode potentials were investigated using the LSVs, and the electron transfer numbers were calculated using the K–L equation:| j−1 = jk−1 + (Bω0.5)−1 | (1) |
 | (2) |
![[thin space (1/6-em)]](https://www.rsc.org/images/entities/char_2009.gif) 485 C mol−1), DO2 is the diffusion coefficient of O2 in 0.1 mol L−1 KOH, CO2 is the bulk O2 concentration in 0.1 mol L−1 KOH, and ν is the kinematic viscosity of the electrolyte.
485 C mol−1), DO2 is the diffusion coefficient of O2 in 0.1 mol L−1 KOH, CO2 is the bulk O2 concentration in 0.1 mol L−1 KOH, and ν is the kinematic viscosity of the electrolyte.
2.4. Microbial fuel cell (MFC) setup and operation
The air-cathode, single-chamber MFC was set up as described by Zhou et al.14 Briefly, a carbon brush (2.5 cm in both diameter and length) served as the anode, and the cathode was prepared by dispersing either the as-prepared carbon nanomaterials or Pt/C on the catalytic layer of the cathodic carbon cloth. The catalyst dosage of the two materials was 2.0 and 0.5 mg m−2, respectively. The liquid volume of the MFCs was 28 mL. The electrolyte was 1 g L−1 sodium acetate solution in 50 mmol L−1 phosphate buffer solution (PBS, pH = 7.0) contacting a 12.5 mL L−1 mineral and 5 mL L−1 vitamin solution. The voltages of the MFCs were recorded using a 40-channel voltage collection instrument with a 1 kΩ external resistance, and the polarization curves and individual potentials were constructed by discharging the cell with external loads of various resistance. All of the MFCs were operated in batch mode in a 30 °C incubator, and tests were conducted in triplicate.3. Results and discussion
Fig. 1 exhibits the representative SEM images of the raw silk, DC-800 and PAC-800 samples. The fiber structure of the raw silk can be observed in Fig. 1a–c, which shows one-dimensional carbon fibers with a smooth surface and a diameter of about 10 μm. It should be noted that after carbonization, the heated silk (DC-800) still maintains its continuous filament morphology (Fig. 1d–f), which suggests that the heat-treatment does not destroy the morphology of the raw silk.31,32 However, it is worth noting that there are lots of visible micropores distributed on the surface of PAC-800. This can be explained by the chemical activation by ZnCl2.31–34 The specific surface areas and the pore structure of the carbon materials were quantified by nitrogen adsorption–desorption measurement. Fig. 2(a and b) exhibits the N2 adsorption–desorption isotherms and pore size distributions (PSD) curves. All five samples show a typical type-I isotherm (Fig. 2a), which indicates the microporous nature of these materials.32,33 The surface areas of the samples are listed in Table S1,† where PAC-800 exhibits the highest BET surface area (1273.8 m2 g−1). The surface area of PAC-800 is significantly higher than that of DC-800 (137.0 m2 g−1), which demonstrates that the chemical activation procedure using ZnCl2 was effective in increasing the surface area of the CS-derived carbon material. Fig. 2b displays the PSD curves of the samples, which show that the pore size distribution range is mainly from 1 to 12 nm, and the corresponding pore volumes range from 0.06 to 0.60 cm3 g−1. The pore volumes of the activated samples became much larger with the increase in carbonization temperature from 600 °C to 800 °C, however, it decreased significantly when the temperature increased from 800 °C to 900 °C. As previously reported by Hu et al.,33 when the carbonization temperature is higher than the melting point of ZnCl2 (283 °C), liquid ZnCl2 permeates into the interior of the carbon matrix, and contributes to the formation of a carbon framework. Furthermore, when the temperature is higher than the boiling point (732 °C), a severe interaction between the zinc compounds and carbon atoms occurs, resulting in the aromatization and widening of the atomic layers of the carbon as well as the formation of a porous structure in the carbon matrix.33,34 However, with a further increase in temperature, charring and aromatization of the carbonaceous material could result in dimensional contraction, subsequently leading to a decrease in the pore volume and specific surface area.35 PAC-800 exhibits the highest BET surface area (1273.8 m2 g−1), the largest total pore volume (0.6 m3 g−1) and the largest pore diameter (1.9 nm), which suggest that the suitable carbonization temperature is 800 °C.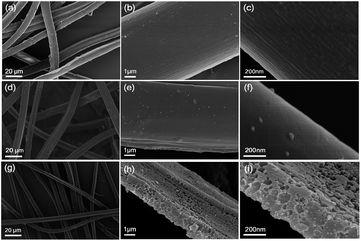 | ||
| Fig. 1 Representative SEM images of the raw silk (a–c), DC-800 (d–f) and PAC-800 (g–i) at various magnifications. | ||
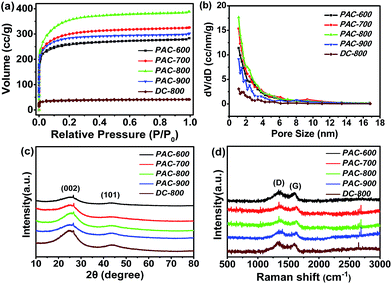 | ||
| Fig. 2 N2 adsorption–desorption isotherms (a), pore size distributions (b), XRD patterns (c) and Raman spectra (d) of PAC-600, PAC-700, PAC-800, PAC-900 and DC-800. | ||
For further structural characterization, these carbon materials were investigated using XRD and Raman spectroscopy. As shown in Fig. 2c, all five samples exhibit two major diffraction peaks at 24° and 44°, which are assigned to the (002) and (101) diffraction planes of hexagonal graphite, respectively.36–39 The interlayer spacing (d) and crystallite dimensions (Lc and La) were calculated using the Bragg and Scherrer equations, respectively,40 which are summarized in Table S2.† The (002) diffraction peak exhibits a slight increase of 2θ value with an increase in carbonization temperature, and the Lc(002) and La(101) values show a similar tendency to d002. The ratio of Lc(002) and d002 (N = Lc(002)/d(002)) represents the number of the graphite layer planes, and this value increased when the heat-treated temperature increased from 600 °C to 900 °C, which suggests that higher temperature could lead to more graphite layer planes and a more stable graphitic structure.41
Fig. 2d displays the Raman spectra of all the samples. The peaks at 1300 cm−1 and 1600 cm−1 can be seen significantly, which correspond to the D and G bands. The D band is related to structure defects, such as curved sheets and dangling bonds in the carbon structure, whereas the G band is generally associated with the in-plane bond-stretching motions of the pairs of sp2 C atoms.42,43 The intensity ratios of the D and G bands (ID/IG) can be used to examine the degree of disordering in the graphitic structure, and a large ratio corresponds to the more defects introduced by heteroatom doping and/or a less sp2 electronic configuration.43 The ID/IG ratio of PAC-600, PAC-700, PAC-800, PAC-900 and DC-800 are approximately 1.13, 1.12, 1.05, 1.03 and 1.05, respectively. The decrease in defects indicates that the carbonized samples approach a more stable state with an increase in the carbonization temperature.
The elemental compositions and bonding configurations of the as-prepared carbon materials were characterized by XPS measurements. Fig. S1a† depicts the survey spectrum of the samples, where only C, N and O can be found, which confirms that these carbon nanofibers are indeed N-doped nanomaterials. Furthermore, the elemental distributions were also evaluated by quantitative energy dispersive X-ray spectroscopy (EDS) element mapping (Fig. S1c–e†), where the C, N and O elements were homogeneously distributed on the surface of PAC-800. The high-resolution spectrum was employed to further analyze the elemental compositions. As shown in Fig. 3a, the high-resolution C 1s spectrum displays three major components, corresponding to C![[double bond, length as m-dash]](https://www.rsc.org/images/entities/char_e001.gif) C (284.7 eV), C–N/C–O (286.1 eV) and C
C (284.7 eV), C–N/C–O (286.1 eV) and C![[double bond, length as m-dash]](https://www.rsc.org/images/entities/char_e001.gif) N/C
N/C![[double bond, length as m-dash]](https://www.rsc.org/images/entities/char_e001.gif) O (290.3 eV).44,45 Similarly, the O 1s spectrum is found to entail three oxygen moieties (Fig. 3b). The three major peaks at the binding energy of 530.8, 532.9 and 534.7 eV might be assigned to H–O–C, O–C and O
O (290.3 eV).44,45 Similarly, the O 1s spectrum is found to entail three oxygen moieties (Fig. 3b). The three major peaks at the binding energy of 530.8, 532.9 and 534.7 eV might be assigned to H–O–C, O–C and O![[double bond, length as m-dash]](https://www.rsc.org/images/entities/char_e001.gif) C, respectively.14,46 For the high-resolution N 1s spectrum (Fig. 3c), the four sub-peaks were deconvoluted, including pyridinic N1 at 397.3 eV, pyrrolic N2 at 398.6 eV, graphitic N3 at 401.4 eV and oxidized N4 at 404.3 eV.47 As shown in Fig. 3d and Table S3,† the total N content decreased with an increase in the carbonization temperature. However, the content of graphitic N3 and oxidized N4 remained unchanged, which indicates a conversion from pyridinic N1 and pyrrolic N2 to the more stable graphitic N3 and oxidized N4 upon increasing the carbonization temperature.48–51 Several research groups deemed that graphitic N3 atoms in the carbon lattice facilitate the electron transfer from the carbon electronic bands to the antibonding orbitals of oxygen, which benefits the ORR catalytic activity.52–54
C, respectively.14,46 For the high-resolution N 1s spectrum (Fig. 3c), the four sub-peaks were deconvoluted, including pyridinic N1 at 397.3 eV, pyrrolic N2 at 398.6 eV, graphitic N3 at 401.4 eV and oxidized N4 at 404.3 eV.47 As shown in Fig. 3d and Table S3,† the total N content decreased with an increase in the carbonization temperature. However, the content of graphitic N3 and oxidized N4 remained unchanged, which indicates a conversion from pyridinic N1 and pyrrolic N2 to the more stable graphitic N3 and oxidized N4 upon increasing the carbonization temperature.48–51 Several research groups deemed that graphitic N3 atoms in the carbon lattice facilitate the electron transfer from the carbon electronic bands to the antibonding orbitals of oxygen, which benefits the ORR catalytic activity.52–54
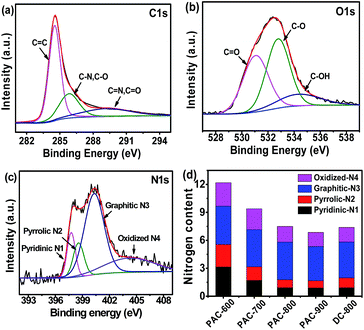 | ||
| Fig. 3 High-resolution XPS scans of C 1s (a), O 1s (b) and N 1s (c) of PA-800, and the content of four types of nitrogen (d) of the CS-derived carbon materials. | ||
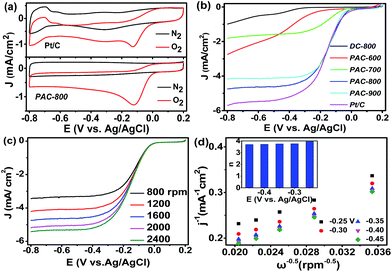
Electrochemical measurements of the activated carbon catalysts were performed in an O2 or N2 saturated 0.1 mol L−1 KOH solution at the scan rate of 10 mV s−1. As shown in Fig. 4a, no evident peaks are observed in the N2-saturated KOH solutions; however, a well-defined cathodic oxygen reduction peak of Pt/C and PAC-800 at −0.12 and −0.13 V vs. Ag/AgCl is observed in the O2-saturated KOH solutions, respectively. To further study the electrochemical performance of the as-prepared catalysts toward the ORR, LSV was conducted on a rotating disk electrode (RDE) by scanning the potential from +0.2 to −0.8 V at a rotation rate of 1600 rpm and scan rate of 10 mV s−1. As seen in Fig. 4b, PAC-800 has an onset potential of 0.03 V, and a half-wave potential of −0.13 V, which are very close to those of the Pt/C. PAC-800 exhibits the most positive onset potential and the highest current density compared with the catalysts carbonized at other temperatures, which suggest that chemical activation at 800 °C can achieve the best electrochemical activity for the CS-derived activated carbon materials. Notably, PAC-800 is comparable to the biomass-derived carbon catalysts reported in the literature (Table S4†). Not only its carbon surface chemistry, but also its carbon electronic structure was changed due to the introduction of functional groups into its carbon lattice. In this regard, the doped N is able to create a positive charge density on the adjacent C atoms, which results in favourable O2 adsorption and high catalytic activity towards the ORR.49–51 Combining the physical and chemical measurements, its large surface area and abundant pore structure may also contribute to the remarkable ORR catalytic activity of PAC-800. The catalytic activity of the silk-derived activated carbon increased with an increase in pyrolysis temperature from 600 °C and 800 °C, which is in accordance with the increase in surface area and pore volume. This result provides evidence that its large surface area and porous structure might be responsible for its ORR catalytic activity.
RDE measurements at different rotational speeds from 800 to 2400 rpm were performed to further investigate the ORR performances of PAC-800. As seen in Fig. 4c, it is clear that the limiting diffusion current became larger with the increase in speed. The electron transfer numbers were analyzed on the basis of the K–L plots. As shown in Fig. 4d, in the K–L plots of PAC-800, the relationship between j−1 and ω−1/2 is well linear between −0.25 and −0.45 V. According to the K–L equation, the electron transfer number during the ORR process was calculated to be close to four (3.72–3.96), indicating that the ORR process occurs through a four electron transfer pathway, which is similar to that of the commercial Pt/C catalyst (Fig. S2†).
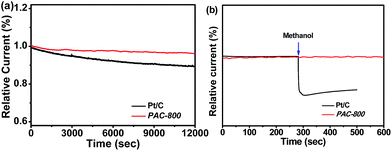
The stability and resistance to crossover effects of catalysts are very important issues for their practical application in various energy technologies. Stability and crossover were examined during the ORR process. The stability of PAC-800 was examined in an O2-saturated 0.1 mol L−1 KOH solution at 1600 rpm over 12![[thin space (1/6-em)]](https://www.rsc.org/images/entities/char_2009.gif) 000 s of continuous operation at −0.35 V vs. Ag/AgCl (Fig. 5a). It can be seen that the ORR current density of the PAC-800 electrode decreased by only 6.8%, but the Pt/C electrode exhibited a 30.0% decrease in current density under the same conditions. The tolerance to the methanol crossover effect is shown in Fig. 5b, and it can be seen that the catalytic current of PAC-800 for the ORR is unaffected by the addition of 1 mL methanol. However, a deep current decrease was observed for Pt/C when 1 mL methanol was added. These results demonstrate that PAC-800 exhibits promising stability towards the ORR with a remarkable tolerance to the methanol crossover effects.
000 s of continuous operation at −0.35 V vs. Ag/AgCl (Fig. 5a). It can be seen that the ORR current density of the PAC-800 electrode decreased by only 6.8%, but the Pt/C electrode exhibited a 30.0% decrease in current density under the same conditions. The tolerance to the methanol crossover effect is shown in Fig. 5b, and it can be seen that the catalytic current of PAC-800 for the ORR is unaffected by the addition of 1 mL methanol. However, a deep current decrease was observed for Pt/C when 1 mL methanol was added. These results demonstrate that PAC-800 exhibits promising stability towards the ORR with a remarkable tolerance to the methanol crossover effects.
With regard to the practical application of PAC-800, its feasibility was investigated as a cathodic ORR catalyst in an air-cathode single-chamber microbial fuel cell (MFC). The MFC has been intensively researched in recent years as a promising renewable energy technology for wide application, for example, electricity generation, wastewater treatment, biogas production, and pollutant removal.55,56 However, its commercial application has been hindered by the high cost of electrode materials due to the use of Pt based cathodic catalyst in its cathodes.57 Various non-noble metal and metal-free catalysts, such as transition metal macrocycles, metal oxides, and various carbon materials, have been developed to replace the Pt component.14,17–20,58–61 The suitability of PAC-800 as a replacement for the Pt/C catalyst for MFCs was investigated by constructing a single-chamber MFC with the PAC-800 cathode. As seen in Fig. 6(a), the MFC with the PAC-800 cathodic catalyst has a maximum power density of about 800 mW m−2, which is slightly lower than that of the MFC with the Pt/C cathodic catalyst (1100 mW m−2). Fig. 6b shows the individual potential vs. current density for both the anode and cathode. For these MFCs, the anode potentials were similar; however, the cathode potentials were different, which indicates that the differences between the MFCs performances are primarily related to the different catalytic activity of the cathodic catalyst. Although the lower power density achieved from the MFC with the PAC-800 cathode is slightly lower than that of the Pt cathode, the as-prepared PCA-800 still has numerous advantages as an electrocatalyst towards ORR. The cost of PCA-800 is relatively low due to its sustainable nature, and the strategy used to produce this catalyst could be easily scaled-up because the entire process is facile.
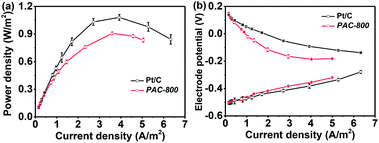 | ||
| Fig. 6 (a) Polarization curves of the MFCs with PAC-800 and Pt/C cathodes; and (b) curves of individual potentials in the MFCs. | ||
4. Conclusions
In summary, we reported a CS-derived N-doped porous carbon with exceptionally high electrocatalytic activity for the ORR, which was fabricated via a facile heat treatment combined with a chemical activation procedure under mild conditions. Popular CS, which is an abundantly available and renewable biomass, acts as a single precursor for carbon as well as nitrogen in the synthetic process, eliminating the need for multiple hazardous chemicals. Its remarkable ORR catalytic activity is partially attributed to the highly positive charges on the carbon atoms, in which the electronegative nitrogen atoms are doped. Moreover, the excellent ORR catalytic activity of PAC-800 might also originate from the combined effect of its porous structure and high surface area. The prepared PAC-800 exhibits promising stability and good tolerance to the methanol crossover effect. An MFC using PAC-800 as the cathode catalyst exhibits a good performance with a maximum power density of 800 mW m−2, which suggests that this material offers a low-cost alternative to Pt/C catalysts for microbial energy harvesting. The present study provides a new, facial and environmentally friendly approach to prepare activated carbon with high catalytic activity towards the ORR from the natural material, silk.Acknowledgements
The present study was supported by the National Natural Science Foundation of China (Grant No. 51678162 and 41301264), the Guangdong Natural Science Funds for Distinguished Young Scholar (2014A030306033), the Guangdong Science-Technology Project (2016A020209009), and the Guangdong Academy of Sciences Funds for Innovation Driven Development (2017GDASCX-0409).Notes and references
- B. Zheng, J. Wang, F. B. Wang and X. H. Xia, J. Mater. Chem. A, 2014, 2, 9079–9084 CAS.
- Z. J. Jiang and Z. Q. Jiang, J. Mater. Chem. A, 2014, 2, 14071–14081 CAS.
- R. F. Service, Science, 2007, 315, 1488–1491 CrossRef CAS PubMed.
- J. Liang, R. F. Zhou, X. M. Chen, Y. H. Tang and S. Z. Qiao, Adv. Mater., 2014, 26, 6074–6079 CrossRef CAS PubMed.
- H. Kim, G. Jeong, Y. U. Kim, J. H. Kim, C. M. Park and H. J. Sohn, Chem. Soc. Rev., 2013, 42, 9011–9034 RSC.
- Z. C. Zuo, W. Li and A. Manthiram, J. Mater. Chem. A, 2013, 1, 10166–10172 CAS.
- Z. M. Luo, D. L. Yang, G. Q. Qi, J. Z. Shang, H. P. Yang and Y. L. Wang, J. Mater. Chem. A, 2014, 2, 20605–20611 CAS.
- T. Lee, E. K. Jeon and B. S. Kim, J. Mater. Chem. A, 2014, 2, 6167–6173 CAS.
- S. Y. Gao, H. Fan and S. X. Zhang, J. Mater. Chem. A, 2014, 2, 18263–18270 CAS.
- M. Arenz, K. J. J. Mayrhofer, V. Stamenkovic, B. B. Blizanac, T. Tomoyuki and P. N. Ross, J. Am. Chem. Soc., 2005, 127, 6819–6829 CrossRef CAS PubMed.
- A. Morozan, B. Jousselme and S. Palacin, Energy Environ. Sci., 2011, 4, 1238–1254 CAS.
- T. Chen and L. M. Dai, Mater. Today, 2013, 16, 272–280 CrossRef CAS.
- L. Dai, W. C. Dong, J. B. Baek and L. Wen, Small, 2012, 8, 1130–1166 CrossRef CAS PubMed.
- L. H. Zhou, P. Fu, X. X. Cai, S. G. Zhou and Y. Yuan, Appl. Catal., B, 2016, 188, 31–38 CrossRef CAS.
- F. Yang, Y. X. Tao, Y. Y. Du and R. L. Xiao, Adv. Mater. Res., 2011, 219, 331–336 Search PubMed.
- T. Yang, J. Liu, R. Zhou, Z. Chen, H. Xu and S. Z. Qiao, J. Mater. Chem. A, 2014, 2, 18139–18146 CAS.
- L. H. Zhou, P. Fu, D. H. Wen, Y. Yuan and S. G. Zhou, Appl. Catal., B, 2016, 181, 635–643 CrossRef CAS.
- S. Y. Gao, K. R. Geng, H. Y. Liu, X. J. Wei, M. Zhang and P. Wang, Energy Environ. Sci., 2014, 8, 221–229 Search PubMed.
- Z. Y. Guo, G. Y. Ren, C. C. Jiang, X. Y. Lu, Y. Zhu and L. Jiang, Sci. Rep., 2015, 5, 17064–17070 CrossRef CAS PubMed.
- P. Chen, L. K. Wang, G. Wang, M. R. Gao, J. Ge and W. J. Yuan, Energy Environ. Sci., 2014, 7, 4095–4103 CAS.
- S. Y. Gao, H. Fan and S. X. Zhang, J. Mater. Chem. A, 2014, 2, 18263–18270 CAS.
- R. F. Wang, H. Wang, T. B. Zhou, J. L. Key, Y. J. Ma and Z. Zhang, J. Power Sources, 2015, 274, 741–747 CrossRef CAS.
- K. Hasanudin, P. Hashim and S. Mustafa, Molecules, 2012, 7, 9697–9715 CrossRef PubMed.
- A. Nova, S. Keten, N. M. Pugno, A. Redaelli and M. J. Buehler, Nano Lett., 2010, 10, 2626–2634 CrossRef CAS PubMed.
- J. A. Kluge, O. Rabotyagova, G. G. Leisk and D. L. Kaplan, Trends Biotechnol., 2008, 26, 244–251 CrossRef CAS PubMed.
- M. Heim, D. Keer and T. Scheibel, Angew. Chem., Int. Ed., 2009, 48, 3584–3596 CrossRef CAS PubMed.
- A. D. Parkhe, S. K. Seeley, K. Gardner, L. Thompson and R. V. Lewis, J. Mol. Recognit., 1997, 10, 1–6 CrossRef CAS PubMed.
- T. Iwazaki, H. S. Yang, R. Obinata, W. Sugimoto and Y. Takasu, J. Power Sources, 2010, 195, 5840–5847 CrossRef CAS.
- T. Iwazaki, R. Obinata, W. Sugimoto and Y. Takasu, Electrochem. Commun., 2009, 11, 376–378 CrossRef CAS.
- Q. Wang, R. Y. Zhang, Y. Wu, H. Zhu, J. Zhang and M. Du, RSC Adv., 2016, 6, 34219–34224 RSC.
- C. Kim, Y. I. Jeong, B. T. N. Ngoc, K. S. Yang, M. Kojima, Y. A. Kim, M. Endo and J. W. Lee, Small, 2007, 3, 91–95 CrossRef CAS PubMed.
- M. R. Khan, Y. Gotoh, H. Morikawa, M. Miura, Y. Fujimori and M. Nagura, Carbon, 2007, 45, 1035–1042 CrossRef CAS.
- Z. H. Hu and E. R. Vansant, J. Colloid Interface Sci., 1995, 176, 422–431 CrossRef CAS.
- E. Gnozalez-Serrano, T. Crodero, J. Rodriguez-Mirasol and J. J. Rodriguez, Int. Eng. Chem. Res., 1997, 36, 4832–4838 CrossRef.
- Z. R. Yue, C. L. Mangun and J. Economy, Carbon, 2002, 40, 1181–1191 CrossRef CAS.
- W. J. Qian, F. X. Sun, Y. H. Xu, L. H. Qiu, C. H. Liu and S. D. Wang, Energy Environ. Sci., 2014, 7, 379–386 CAS.
- Y. S. Yun, S. Y. Cho, J. Shim, B. H. Kim, S. Chang and S. J. Baek, Adv. Mater., 2013, 2, 1993–1998 CrossRef PubMed.
- X. J. Liu, W. J. Zhou, L. J. Yang, L. G. Li, Z. Y. Zhang and Y. T. Ke, J. Mater. Chem. A, 2015, 3, 8840–8846 CAS.
- J. Hou, C. Cao, F. Idrees and X. Ma, ACS Nano, 2015, 9, 556–564 Search PubMed.
- C. Kim, S. H. Park, J. I. Cho, Y. D. Lee, T. J. Park, W. J. Lee and K. S. Yang, J. Raman Spectrosc., 2004, 35, 928–933 CrossRef CAS.
- S. Y. Cho, Y. S. Yun, S. Lee, D. Jang, K. Y. Park, J. K. Kim, B. H. Kim, K. Kang, D. L. Kaplan and H. J. Jin, Nat. Commun., 2015, 6, 7145–7152 CrossRef PubMed.
- X. J. Liu, Y. C. Zhou, W. J. Zhou, L. G. Li, S. B. Huang and S. W. Chen, Nanoscale, 2015, 7, 6136–6142 RSC.
- Y. Chen, J. Li, T. Mei, X. Hu, D. Liu and J. Wang, J. Mater. Chem. A, 2014, 2, 20714–20722 CAS.
- X. J. Liu, W. J. Zhou, L. J. Yang, L. G. Li, Z. Y. Zhang and Y. T. Ke, J. Mater. Chem. A, 2015, 3, 8840–8846 CAS.
- T. I. T. Okpalugo, P. Papakonstantinou, H. Murphy, J. McLaughlin and N. M. D. Brown, Carbon, 2005, 43, 153–1561 CrossRef CAS.
- V. Datsyuk, M. Kalyva, K. Papagelis, J. Parthenios, D. Tasis and A. Siokou, Carbon, 2008, 46, 833–840 CrossRef CAS.
- K. Zhou, W. J. Zhou, X. J. Liu, Y. Wang, J. Q. Wan and S. W. Chen, ACS Appl. Mater. Interfaces, 2014, 6, 14911–14918 CAS.
- K. P. Gong, F. Du, Z. H. Xia, M. Durstock and L. M. Dai, Science, 2009, 323, 760–764 CrossRef CAS PubMed.
- L. Y. Feng, Y. Y. Yan, Y. G. Chen and L. J. Wang, Energy Environ. Sci., 2011, 4, 1892–1899 CAS.
- H. R. Byon, J. Suntivich and Y. Shao-Horn, Chem. Mater., 2011, 23, 3421–3428 CrossRef CAS.
- K. R. Lee, K. U. Lee, J. W. Lee, B. T. Ahn and S. I. Woo, Electrochem. Commun., 2010, 12, 1052–1055 CrossRef CAS.
- N. P. Subramanian, X. G. Li, V. Nallathambi, S. P. Kumaraguru, H. Colon-Mercado, G. Wu, J. W. Lee and B. N. Popov, J. Power Sources, 2009, 188, 38–44 CrossRef CAS.
- P. Wang, Z. K. Wang, L. X. Jia and Z. L. Xiao, Phys. Chem. Chem. Phys., 2009, 11, 2730–2740 RSC.
- H. Kim, K. Lee, S. I. Woo and Y. Jung, Phys. Chem. Chem. Phys., 2011, 13, 17505–17510 RSC.
- B. E. Logan and J. M. Regan, Environ. Sci. Technol., 2006, 40, 5172–5180 CrossRef CAS PubMed.
- W. W. Li, H. Q. Yu and Z. He, Energy Environ. Sci., 2014, 7, 911–924 CAS.
- B. E. Logan, Appl. Microbiol. Biotechnol., 2010, 85, 1665–1671 CrossRef CAS PubMed.
- X. W. Liu, W. W. Li and H. Q. Yu, Chem. Soc. Rev., 2014, 43, 7718–7745 RSC.
- Y. Yuan, B. Zhao, Y. W. Jeon, S. G. Zhong and S. Kim, Bioresour. Technol., 2011, 102, 5849–5854 CrossRef CAS PubMed.
- L. Zhang, C. S. Liu, L. Zhuang, W. S. Li, S. G. Zhou and J. J. Zhang, Biosens. Bioelectron., 2009, 24, 2825–2829 CrossRef CAS PubMed.
- X. Zhang, X. Xia, I. Ivanov, X. Huang and B. E. Logan, Environ. Sci. Technol., 2014, 48, 2075–2081 CrossRef CAS PubMed.
Footnote |
| † Electronic supplementary information (ESI) available. See DOI: 10.1039/c7ra00433h |
| This journal is © The Royal Society of Chemistry 2017 |

