 Open Access Article
Creative Commons Attribution 3.0 Unported Licence
Graphene oxide supported titanium dioxide & ferroferric oxide hybrid, a magnetically separable photocatalyst with enhanced photocatalytic activity for tetracycline hydrochloride degradation
Wenxia Wang a,
Kaijun Xiao*a,
Liang Zhua,
Yurong Yin*b and
Zhaomei Wanga
aSchool of Food Science and Engineering, South China University of Technology, Guangzhou, 510640, China
bSchool of environment and energy, South China University of Technology, Guangzhou, 510640, China. E-mail: fekjxiao@scut.edu.cn; ppyryin@scut.edu.cn; Fax: +86-020-87113843; Tel: +86-020-87113843
First published on 13th April 2017
Abstract
A facile, robust approach to the synthesis of Fe3O4/rGO/TiO2 nanocomposites is described. The synthesis involves two major steps: (1) preparation of Fe3O4/GO by an electrostatic self-assembly method; (2) deposition of TiO2 on the surface of the Fe3O4/rGO nanocomposite via a hydrothermal method. The as-prepared Fe3O4/rGO/TiO2 photocatalyst exhibited an enhanced photocatalytic activity for the degradation of tetracycline hydrochloride (TC-HCl) over a wide pH range from 3.0 to 11.0. At optimal conditions, a 92.6% degradation rate of TC-HCl was achieved within 330 min. The enhanced photocatalytic activity could be ascribed to the synergistic effect of the photo-Fenton reaction and electron transportation of graphene. A possible photocatalytic mechanism for TC-HCl by the Fe3O4/rGO/TiO2 nanocomposite and H2O2 was proposed based on the quenching tests and liquid chromatography-mass spectrometry (LC-MS) analysis. Furthermore, a leaching test was also carried out and the result suggested that the leached iron from the reaction system was negligible and the catalyst still exhibited excellent photocatalytic activity after five reaction cycles, which clearly demonstrated that the Fe3O4/rGO/TiO2 nanocomposite was reusable, excellently stable and highly effective.
1 Introduction
Recently, the widespread use and abuse of antibiotics, like tetracycline hydrochloride (TC-HCl), have aroused particular concern from scientists because of their extensive application to human beings, veterinary medicine, agriculture, aquaculture and planting.1,2 As we all know that the excessive use of antibiotics may result in frequent detection of their residues in the environment because of their ineffective biological degradation,3 which may lead to untreatable human disease. Besides, it is also a major concern that their persistent exposure to the environment may induce antibiotic-resistant genes. Currently, many methods, such as adsorption,4 ion-exchange,5 microbial degradation,6 photocatalytic degradation,7 electrolysis8 and membrane filtration,9 have been investigated for the removal of antibiotics. Among them, photocatalytic degradation was presented as an ideal method due to its high efficiency and low cost. However, the methodology is limited as most of the photocatalysts, such as TiO2, SnO2 and ZnO, can only respond to UV irradiation, which accounts for only 4–5% of solar light. Among the semiconductor catalysts, TiO2 remains one of the most promising photocatalyst candidates because of its easy availability, high oxidation efficiency, high photostability stability, nanotoxicity, chemical inertness, low cost and environmentally friendly nature.10 However, the wide band gap (∼3.2 eV) and intrinsic fast recombination of the photoexcited electron–holes of TiO2 are big challenges to achieve higher photocatalytic efficiency and limits the TiO2 application for large scale.11 Recent years have witnessed a cornucopia toward the exploration of new TiO2 photocatalyst. Up to now, numerous efforts, such as surface sensitization,12 tuning the morphology,13 noble metals or metal ions incorporation,14 constructing heterojunctions15 and transition metals and non-metals doping,16 have been made to expand the photoresponse of TiO2 catalyst into solar light and limit the recombination of photogenerated electron–hole pairs. As such, there is still an urgent need to explore a novel approach to remove antibiotics from aqueous solutions efficiently.Impurities doping of TiO2 (either cations or anions metals) and coupling TiO2 with other semiconductors are the typical approaches to overcome the limitations of pure TiO2.17 Recently, photo-Fenton has received particular concern over the decades for the treatment of wastewater. From this point of view, TiO2 nanoparticle can be introduced into the Fenton system to make a magnetically separable photo-Fenton catalyst with enhanced visible-light driven photocatalytic activity. However, the Fe3O4 nanoparticles are tend to aggregate and become large particles because of their strong anisotropic dipolar interactions, which may affect their dispersibility and specific properties, thus diminishing their activity.18 Hence, there is an urgent need to solve the existing problem. Taken together, it is worthwhile to introduce an effective interlayer between TiO2 and Fe3O4 nanoparticles to maintain their special properties. Graphene has been demonstrated with unique atom-thick 2D structure, superior electron mobility, high specific surface area, excellent transparency, high chemical and electrochemical stability. As such, the graphene is attractive for photocatalyst carrier or promoter.19
Herein, we report a two-step process, an electrostatic self-assemble and hydrothermal method, to synthesis of Fe3O4/rGO/TiO2 photocatalyst. The catalytic properties of the as-prepared nanocomposite were further investigated in the discoloration and mineralization of TC-HCl in aqueous solution. The important operation variables, including initial solution pH, operation temperature, pollutant concentration and H2O2 concentration were systematically investigated to find the optimal operation conditions and provide guidance for the practical use of this catalyst. A possible photocatalytic mechanism for TC-HCl by Fe3O4/rGO/TiO2 nanocomposites and H2O2 was proposed based on the quenching tests and liquid chromatography-mass spectrometry (LC-MS) analysis.
2 Experimental section
2.1 Materials
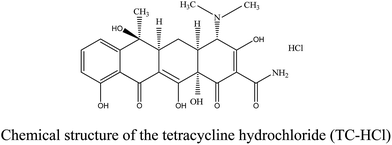
The majority of the chemicals, including ferric chloride hexa-hydrated (FeCl3·6H2O), natural graphite flake, 3-aminopropyltrimethoxy-silane (APTMS) and tetrabutyl titanate (TBOT), were purchased from Aladdin Reagent Co., Ltd. (P. R. China), with their purity in analytical grade. The other chemical reagents were analytical grade and directly used as received. The tetracycline hydrochloride (TC-HCl) was bought from Aladdin Reagent Co., Ltd. (P. R. China). H2SO4 and NaOH solutions were used for pH adjustment. The structure of the TC-HCl is illustrated below:2.2 Synthesis of Fe3O4 nanoparticles
Fe3O4 nanoparticles were synthesized on the basis of a procedure reported previously.20 In brief, 40 mL of ethylene glycol containing FeCl3·6H2O (1.35 g) was prepared under magnetic stirring. Then, predetermined amount of NaAc (3.6 g) and polyethylene glycol 4000 (1.0 g) were quickly added into the pre-mixed clear solution. The mixture was kept stirring for another 30 min and then transformed in to a 100 mL Teflon-lined stainless-steel autoclave, heated at 200 °C for 10 h. Finally, the resultant solution was cooled down to room temperature naturally and then the precipitate was retrieved by centrifugation to give a black powder. The final product was washed three times with ethanol and distilled water and dried at 60 °C under vacuum.2.3 Synthesis of Fe3O4/GO microsphere
GO was fabricated from natural graphite powder by following a modified Hummers protocol.21 The Fe3O4/GO nanocomposites were prepared by a facile electrostatic self-assembly method. Briefly, 1 g of the Fe3O4 nanoparticles was sonicated for 1 h in 140 mL of isopropyl alcohol solution, and then the above mixture was kept stirring at 80 °C for 24 h with the addition of 1 mL APTMS. After complete reaction, the modified Fe3O4 microspheres were collected by centrifuged and washed three times by ethanol and distilled water, and then dried at 60 °C under vacuum. Thereafter, 0.1 g APTMS modified Fe3O4 nanoparticle was dissolved into isopropyl alcohol solution and then added dropwise into 150 mL of aqueous suspension of GO (0.5 mg mL−1) under mechanical stirring. The reaction was allowed to take place at room temperature for 24 h. Finally, the result nanocomposite was washed three times by ethanol and distilled water, and dried at 60 °C under vacuum.2.4 Fabrication of Fe3O4/rGO/TiO2 nanocomposite
Fe3O4/rGO/TiO2 nanocomposite was synthesized by a facile hydrothermal method using Fe3O4/GO microsphere and tetrabutyl titanate (TBOT) as raw materials. In a typical synthesis, 30 mL of Fe3O4/GO microsphere was dissolved in 25 mL isopropyl alcohol and the resulting solution was obtained after ultrasonic for 30 min. Then 100 μL tetrabutyl titanate (TBOT) was added dropwise to the above solution under continuous mechanical stirring and kept stirring for 1 h. Afterward, 1 mL distilled water was added dropwise under mechanical stirring. The mixture was stirring for another 1 h before the mixture was transferred into a 100 mL Teflon-lined stainless steel autoclave for hydrothermal treatment at 180 °C for 8 h. After the autoclave cooled down to room temperature naturally, the final product was washed three times by absolute ethanol and distilled water, dried at 60 °C under vacuum.2.5 Characterization method
The morphology and structure of Fe3O4/rGO/TiO2 nanocomposite were characterized by transmission electron microscopy (TEM, Tecnai F20, 200 kV). The SEM images and EDS mapping was taken by the scanning electron microscopy (SEM, JSM 6701F). The zeta potential measurement was performed by using a Malvern zetasizer (Zetasizer 2000). The crystallographic and chemical bond analysis of the prepared materials were acquired by the X-ray diffractometry (Rigaku Miniflex XRD, Bruker) and Fourier transforms infrared spectroscopy (FTIR, VERTEX 33, Bruker). The X-ray photoelectron spectroscopy (XPS) (Kratos Axis Ultra DLD) of the catalyst was obtained from an axis-ultra X-ray photoelectron spectrometer with monochromatized Al-Kα radiation. The N2 adsorption–desorption isotherms were recorded using the accelerated surface area porosimetry system (ASAP 2020, Micromeritics). The vibrating sample magnetometry (VSM, LAKESHORE-7304) was used to assess the magnetic property at room temperature. Raman spectroscopy (LabRAM Aramis, Germany) was carried out on the samples at room temperature using a 785 nm Nd-YAG laser excitation source.2.6 Photocatalytic degradation of tetracycline hydrochloride (TC-HCl)
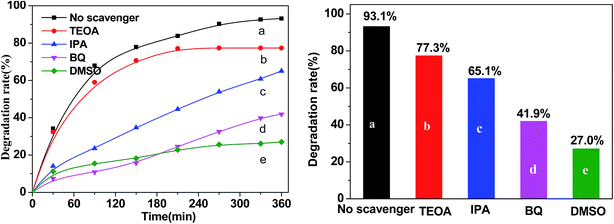
Visible light-driven photocatalytic activity of each sample was measured in terms of the degradation of tetracycline hydrochloride (TC-HCl, 20 mg L−1). In a typical experiment, a predetermined amount of Fe3O4/rGO/TiO2 nanocomposite was suspended in 50 mL of TC-HCl solution (20 ∼ 120 mg L−1). The suspension was kept stirring for 30 min in darkness to reach adsorption–desorption equilibrium. Then the suspension was irradiated with a 150 W Xenon lamp which was located with a distance of 10 cm at side of the reaction solution. At the predetermined time intervals, the analytical samples were withdrawn from the solution and immediately centrifuged at 8000 rpm for 1 min, then analysed using a spectrophotometer (UV-1801) at 356 nm.In order to detect the active species during the photocatalytic reaction, benzoquinone (BQ), dimethylsulfoxide (DMSO), triethanolamine (TEOA), and isopropanol (IPA) were added into the TC-HCl suspension solution containing the 50% Fe3O4/rGO/TiO2 composites photocatalyst to trap superoxide radicals (˙O2−), e−, holes (h+), and hydroxyl radicals (˙OH), respectively.
3 Results and discussion
3.1 Structural identification
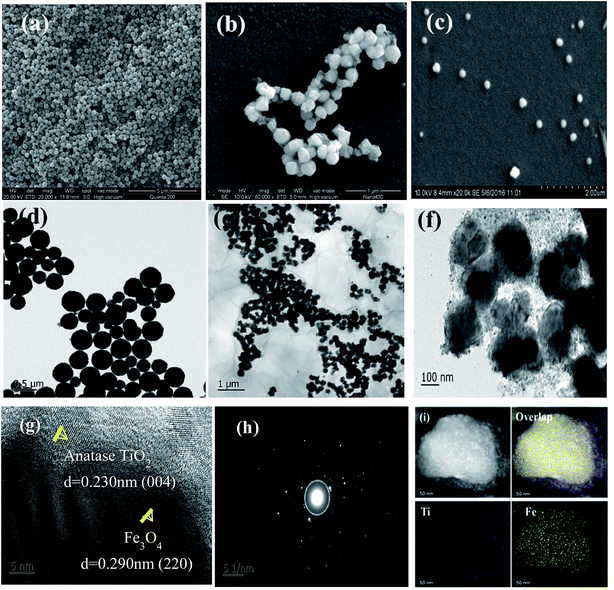
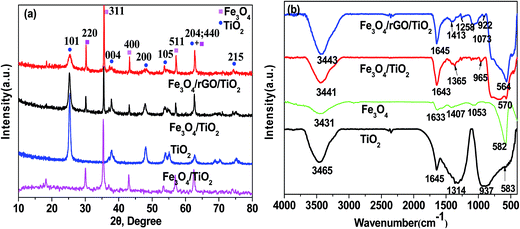
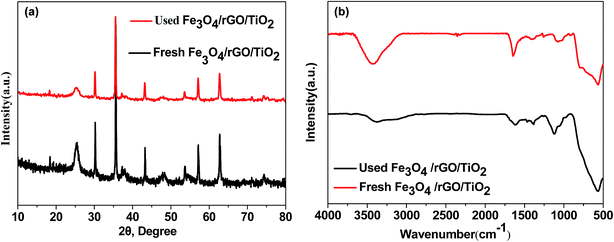
The morphology of as-prepared Fe3O4, Fe3O4/GO and Fe3O4/rGO/TiO2 was observed using SEM and TEM (Fig. 1). From Fig. 1a, we can see the spherical and uniform Fe3O4 microspheres and they all had very narrow diameter distributions, which can be more clearly seen at the TEM image illustrated in Fig. 1d. After assembly with GO nanosheets, the surface of the resulting binary nanoparticle became corrugated, which can be further conformed by the TEM image (Fig. 1e). This result indicated that there do exist thin layer on the surface of Fe3O4 particles due to the successfully integrating with GO. And the size of the binary nanoparticle of Fe3O4/GO became larger compared to that of the bare Fe3O4 particles. Shown in Fig. 1c, the as-prepared Fe3O4/rGO/TiO2 nanocomposite reveal the like-sphere morphology in terms of size. The low-resolution TEM image in Fig. 1f further exhibit that the presence of uniform Fe3O4/rGO/TiO2 nanocomposite resembling tiny rose petals around the like-sphere morphology, which may be attributed to the asymmetric deposition of the TiO2 nanoparticles on the surface of the Fe3O4/GO microsphere induced by the slow kinetics associated with both reduction and surface diffusion.22 The high-resolution TEM (HRTEM) image of the Fe3O4/rGO/TiO2 nanocomposite is shown in Fig. 1g. There are two interplanar spacings (d = 0.230 and 0.290 nm) corresponding to (004) planes of anatase TiO2 and (220) plane of Fe3O4, respectively.23 The related SAED pattern in Fig. 1h suggests the high crystallinity of TiO2 nanoparticles. The positional distribution of Fe and Ti in the Fe3O4/rGO/TiO2 nanocomposite was revealed by high-angle annular dark-field scanning TEM (HAADF-TEM) and EDX elemental mapping patterns. The HAADF-STEM image shows the different luminance in the signal Fe3O4/rGO/TiO2 nanoparticle (Fig. 1i), manifesting that the Fe3O4/rGO/TiO2 nanocomposites have a core–shell structure rather than an alloy structure.24,25To gain insight into the crystal structure of the as-prepared samples, X-ray diffraction patterns of Fe3O4, anatase TiO2, Fe3O4/TiO2 and Fe3O4/rGO/TiO2 were measured. Fig. 2a illustrated XRD pattern of the Fe3O4, the six characteristic peaks located at 18.25°, 29.98°, 36.37°, 43.47°, 53.77°, 57.28° and 63.14° are indexed to (111), (220), (311), (400), (422), (511) and (440), respectively. The results agree well with the typical structure of Fe3O4 nanoparticles [JCPDS: 19-0629].26 Typical sharp and intense peaks observed in Fig. 2b can be attributed to the anatase phase of TiO2 (JCPDS 21-1272). In fact, similar result is also reported in the former literature.27 The XRD pattern of the Fe3O4/TiO2 and Fe3O4/rGO/TiO2 shown in Fig. 2a match both the Fe3O4 nanoparticles and the anatase TiO2, which conformed that the TiO2 nanoparticles were successfully installed on the surface of the Fe3O4 nanospheres and Fe3O4/GO composites.28 The FTIR spectra of anatase TiO2, Fe3O4, Fe3O4/TiO2 and Fe3O4/rGO/TiO2 are recorded in Fig. 2b. For anatase TiO2 (Fig. 2b), the peak located at 583 cm−1 is attributed to stretching vibration of Ti–O–Ti bond, which is consistent with previous literature.29 As can be seen from Fig. 2b, the strong absorption peak at 582 cm−1 correspond to the Fe–O stretching vibration of Fe3O4. Meanwhile, in comparison with Fe3O4/TiO2, the peaks at 1258 cm−1 and 1073 cm−1 can be attributed to C–O in COH/COC of the GO, which indicates that the GO was not completely reduced.
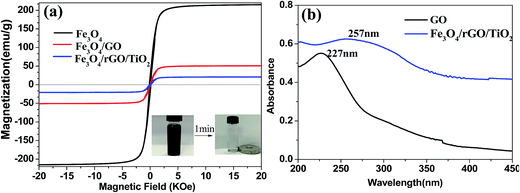
The magnetic properties of the as-obtained materials were characterized by a vibrating sample magnetometer at room temperature. As illustrated in Fig. 3a, the saturation magnetization values of Fe3O4 NPs, Fe3O4/GO and Fe3O4/rGO/TiO2 nanocomposite are 215.0, 50.84 and 20.0 emu g−1, respectively. It is worth noting that the saturation magnetization value of the nanocomposites decreased sharply after coating with the TiO2 or GO sheet, which are the non-magnetic nanocomposites content in the hybrids that reduce the magnetization.26 However, the Fe3O4/rGO/TiO2 still exhibited good magnetic properties that can ensure them be easily collected and recycled from aqueous solution by simply putting an external magnetic field. The inset of Fig. 3a shows the attraction of the Fe3O4/rGO/TiO2 nanoparticles to a commercial magnet in 1 min. The nanoparticles homogeneously dispersed in liquid could be easily collected by an external magnetic field, which conformed their excellent superparamagnetic property. Fig. 3b shows the UV-vis absorbance of GO and Fe3O4/rGO/TiO2. It is evident that the UV absorption peak of the GO and Fe3O4/rGO/TiO2 appears at 227 nm and 257 nm, respectively. The red-shift may be caused by the formation of chemical bond between GO and Fe3O4.30
Raman spectroscopy was used to fully understand the structure and crystalline phase of the Fe3O4/rGO/TiO2 nanocomposite. It is obvious from Fig. 4a that the Fe3O4/rGO/TiO2 hybrids show the typical Raman peaks of Fe3O4/TiO2 and Fe3O4/GO. Besides, the value of ID/IG for Fe3O4/rGO/TiO2 hybrids (ID/IG = 1.18) is higher than for pure Fe3O4/GO (ID/IG = 0.89), which indicates the successful transformation of GO to r-GO through hydrothermal.31 Taking a detailed look at the Raman spectra of TiO2 and Fe3O4/TiO2 (Fig. 4b), it is clear that the Raman peaks appear at 142, 195, 395, 516, and 639 cm−1 are ascribed to vibration modes of Eg(1), Eg, B1g, A1g + B1g, and Eg(2), respectively.32,33 The result is consistent with the XRD analysis.
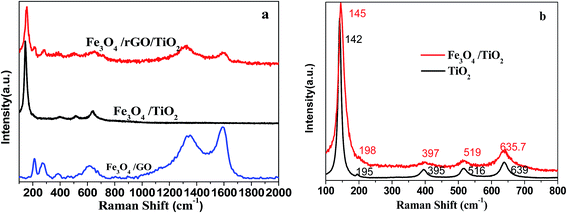 | ||
| Fig. 4 Raman spectra of (a) Fe3O4/TiO2, Fe3O4/GO, Fe3O4/rGO/TiO2 nanocomposite (b) detail information of the Raman spectra of TiO2 and Fe3O4/TiO2 nanocomposite. | ||
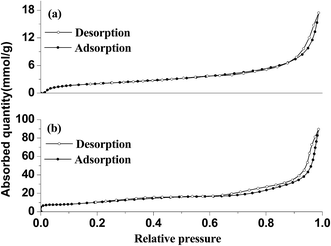
The specific surface areas of Fe3O4/GO and Fe3O4/rGO/TiO2 hybrids were compared using Nitrogen adsorption–desorption measurements (Fig. 5). It is evident that Fe3O4/rGO/TiO2 has similar isotherm to that of Fe3O4/GO, exhibiting type IV isotherms in IUPAC classification with a H1-type hysteresis loop, which conformed the mesostructures of the as-prepared materials.3 Besides, the adsorption quantity of Fe3O4/rGO/TiO2 increased remarkably compared to that of the Fe3O4/GO, which demonstrate the synergistic effect of the TiO2, GO and Fe3O4. Based on the isotherms, the BET surface areas of the Fe3O4/GO and Fe3O4/rGO/TiO2 were determined to be 6.08 and 33.47 m2 g−1, respectively. The average pore sizes of Fe3O4/GO and Fe3O4/rGO/TiO2 composites are 18.29 and 11.48 nm, respectively.
In order to further confirm the chemical status and elemental composite of the as-prepared Fe3O4/TiO2 and Fe3O4/rGO/TiO2 nanomaterials, the XPS measurement was carried out. As apparent from Fig. 6, in the full XPS spectra of the samples, the presence of Fe 2p1, Fe 2p3, O 1s, Ti 2p, and C 1s can be ascertained. In Fig. 6b, the Ti 2p core levels can be deconvoluted to a doublet (Ti 2p3/2 and Ti 2p1/2). However, the binding energy increased compared to the former literatures.34,35 It may be caused by the interaction between Ti and the oxide functional groups of rGO, since the electronegativity of oxygen is higher than that of carbon. As for the C 1s peaks depicted in Fig. 6c, the C 1s peaks of Fe3O4/TiO2 and Fe3O4/rGO/TiO2 could be fitted by three peaks, which belong to the following functional groups: C![[double bond, length as m-dash]](https://www.rsc.org/images/entities/char_e001.gif) O (284.8 eV), C–O–C (286.9 eV) and O–C
O (284.8 eV), C–O–C (286.9 eV) and O–C![[double bond, length as m-dash]](https://www.rsc.org/images/entities/char_e001.gif) O (288.7 eV). In Fig. 6d, the intensity peaks located at 710.8 eV and 724.8 eV belong to Fe 2p3/2 and Fe 2p1/2 respectively, implying the successful synthesis of Fe3O4 (ref. 36).
O (288.7 eV). In Fig. 6d, the intensity peaks located at 710.8 eV and 724.8 eV belong to Fe 2p3/2 and Fe 2p1/2 respectively, implying the successful synthesis of Fe3O4 (ref. 36).
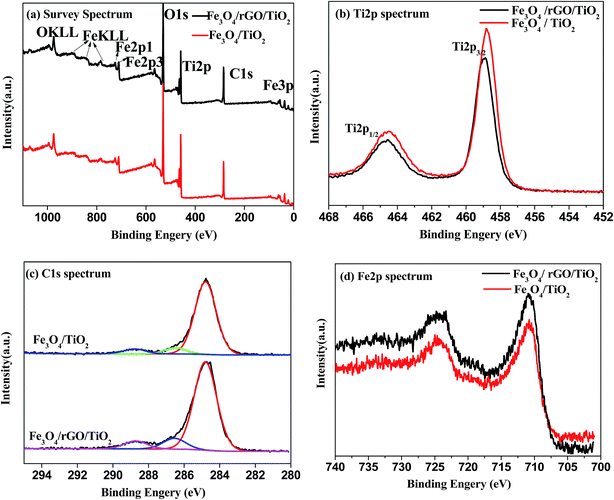 | ||
| Fig. 6 XPS spectra of Fe3O4/TiO2 and Fe3O4/rGO/TiO2 nanocomposite: (a) full spectra of samples; (b) Ti 2p peaks; (c) C 1s peaks; (d) Fe 2p peaks. | ||
3.2 Photocatalytic performance
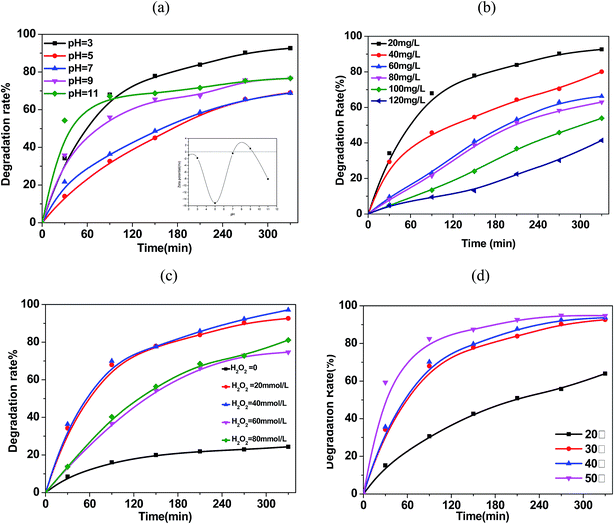
Fig. 7b illustrate the TC-HCl removal with various initial TC-HCl concentrations. It is obvious that the degradation rate of TC-HCl was related to the pollutant concentration, and the lower initial TC-HCl concentration in aqueous solution with the predetermined dosage of Fe3O4/rGO/TiO2 and H2O2 favor the TC-HCl removal. The TC-HCl degradation rate decreased from 92.6% to 41.4% as the initial TC-HCl concentration increased from 20.0 to 120.0 mg L−1. This can be attribute to the following reasons: the fixed amount of Fe3O4/rGO/TiO2 and H2O2 produce the fixed ˙OH amount, and the amount of TC-HCl molecules per unit volume increased with the increase of the TC-HCl concentration, leading to the decrease in the percentage of TC-HCl molecule involved into the reaction and the lower degradation rate.
The initial H2O2 also has a decisive effect on the degradation of the TC-HCl. As presented in Fig. 7c, TC-HCl removal reaches only 20% in the presence of Fe3O4/rGO/TiO2 nanocomposite without any oxidant H2O2, which was attributed to the adsorption of TC-HCl molecules on Fe3O4/rGO/TiO2 nanocomposite. The introduction of H2O2 into the TC-HCl solutions significantly accelerated the degradation of TC-HCl and the degradation performance was dependent on the initial H2O2 concentration in the pollutant solution. The degradation rate of TC-HCl increased when the H2O2 concentration increased from 20 mmol L−1 to 40 mmol L−1, but decreased with further increasing H2O2 concentration to 60 mmol L−1 and 80 mmol L−1. It is known that for the heterogeneous Fenton reaction the highly hydroxyl radicals, hence higher TC-HCl removal, are available at higher initial H2O2 concentrations. Nevertheless, H2O2 can also act as a hydroxyl radical scavenger as described in eqn (1) and (2), and can also take place the self-decomposition as described in eqn (3), so the further increase of the H2O2 concentration cannot result in the significant increase of hydroxyl radicals and the enhancement of the TC-HCl removal.39
| HO˙ + H2O2 → H2O + HO2˙ | (1) |
| HO˙ + HO2˙ → H2O + O2 | (2) |
| 2H2O2 → 2H2O + O2 | (3) |
Fig. 7d shown the effect of temperature on the degradation rate of TC-HCl by Fe3O4/rGO/TiO2 nanocomposite. It is obvious that temperature has a strong effect on the degradation rate of Fe3O4/rGO/TiO2 nanocomposite. The degradation rate increased with increasing temperature from 60% at 20 °C to 97% at 50 °C, which may be caused by the reason that the higher temperature enhanced the reaction rate between H2O2 and Fe3O4/rGO/TiO2 nanocomposite, thus formationing more ˙OH to take part in the reaction.
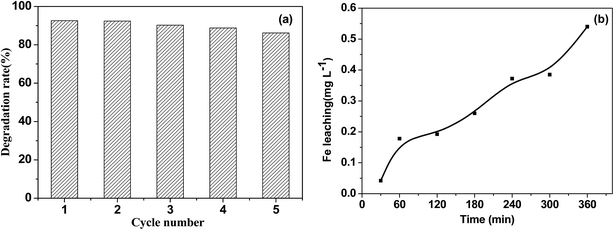 | ||
| Fig. 10 (a) The stability of the Fe3O4/rGO/TiO2 photocatalyst for the discoloration of TC-HCl (b) the Fe leaching from Fe3O4/rGO/TiO2 photocatalyst in the first cycle as a function of time. | ||
3.3 Possible photo-degradation mechanism of TC-HCl
3.4 Proposed mechanism of photocatalysis with the photocatalyst
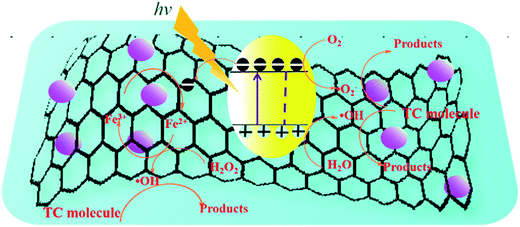
On the basis of the discussion of quenching test, the possible photocatalytic mechanism schemes of Fe3O4/rGO/TiO2 is proposed, as depicted in Fig. 13. When the Fe3O4/rGO/TiO2 were subjected to visible light irradiation, the excitation of an electron from the valence band to the conduction band resulting the generation of electron (e−) in the conduction band (CB) and holes (h+) in the valence band (VB).43 For Fe3O4/rGO/TiO2 system, the electron (e−) transferred to rGO sheet due to the excellent electrical conductivity of rGO, and then take part in the reduction reaction, thus inhibiting the recombination of the electron–hole pairs and making the electron transfer process more efficient.44 Besides, the rGO could also transfer the photogenerated electron to the surface of Fe3O4 and reduce the Fe3+ to Fe2+ because of the superior intimate contact between Fe3O4 and rGO.45 Furthermore, the generate Fe2+ may be able to reduce the H2O2 to ˙OH, which finally degrade organic pollutants. Of cause, it is clear from the Fig. 13 that e− in CB can react with O2 in the aqueous solution to produce ˙O2− to degrade the pollutant, which is in agreement with the result of trapping experiment. Meanwhile, the holes generated on the surface of TiO2 nanoparticle oxidize pollutant molecules.4 Conclusion
In conclusion, Fe3O4/rGO/TiO2 photocatalyst was successfully synthesized by a simple two-step process, an electrostatic self-assemble and hydrothermal method. The uniform Fe3O4 nanoparticles was firstly deposited on the surface of GO sheet through a facile electrostatic self-assembly method. Then the TiO2 particles was anchored on the surface of the Fe3O4/rGO through hydrothermal reaction. The photocatalytic activity of the as-prepared ternary catalyst Fe3O4/rGO/TiO2 has been explored for the degradation of TC-HCl. The Fe3O4/rGO/TiO2 photocatalyst shows superior activity in the neutral or alkaline environment. The enhanced catalytic activity of our catalyst is due to the synergistic effect of photo-Fenton reaction and electron transportation and conducting ability as a result of deposition of graphene. The products of TC-HCl degradation were identified by LC-MS and the possible pathway and mechanism of photocatalysis of the TC-HCl was proposed. The result reveals that the e− radicals and ˙O2− radicals should be the two main actives species during photocatalytic degradation of TC-HCl by the Fe3O4/rGO/TiO2 nanocomposites under visible light irradiation. In addition, the catalyst is reusable and shows efficiency up to 5 cycles. We believe the strategy in our work can provide insight into designing the novel photocatalysts for large-scale degradation of organic pollutants under visible light.Acknowledgements
The authors greatly acknowledge the Foundation for Guangzhou Science and Technology Program Key Projects, China (201508020086), Guangdong Province Science and Technology Plan Project, China (2015B020230001) and the National Natural Science Foundation of China (31371743) for financial support.References
- Y. Chen and K. Liu, Chem. Eng. J., 2016, 302, 682–696 CrossRef CAS.
- B. Luo, D. Xu, D. Li, G. Wu, M. Wu, W. Shi and M. Chen, ACS Appl. Mater. Interfaces, 2015, 7, 17061–17069 CAS.
- Q. Liu, L. Bin Zhong, Q. B. Zhao, C. Frear and Y. M. Zheng, ACS Appl. Mater. Interfaces, 2015, 7, 14573–14583 CAS.
- H. Li, D. Zhang, X. Han and B. Xing, Chemosphere, 2014, 95, 150–155 CrossRef CAS PubMed.
- S. K. Bajpai and M. Bhowmik, J. Macromol. Sci., Part A: Pure Appl. Chem., 2011, 48, 108–118 CrossRef CAS.
- R. Levine, Civil Engineering Theses, Dissertations, and Student Research, 2016.
- F. Chen, Q. Yang, X. Li, G. Zeng, D. Wang, C. Niu, J. Zhao, H. An, T. Xie and Y. Deng, Appl. Catal., B, 2017, 200, 330–342 CrossRef CAS.
- M. Haidar, A. Dirany, I. Sirés, N. Oturan and M. A. Oturan, Chemosphere, 2013, 91, 1304–1309 CrossRef CAS PubMed.
- S. zhong Li, X. yan Li and D. zuo Wang, Sep. Purif. Technol., 2004, 34, 109–114 CrossRef.
- H. Hou, F. Gao, L. Wang, M. Shang, Z. Yang, J. Zheng and weiyou yang, J. Mater. Chem. A, 2016, 4, 6276–6281 CAS.
- M. Xing, X. Li and J. Zhang, Sci. Rep., 2014, 4, 5493 CAS.
- W. T. Sun, A. Yu, H. Y. Pan, X. F. Gao, Q. Chen and L. M. Peng, J. Am. Chem. Soc., 2008, 130, 1124–1125 CrossRef CAS PubMed.
- S. Rawalekar and T. Mokari, Adv. Energy Mater., 2013, 3, 12–27 CrossRef CAS.
- M. Ni, M. K. H. Leung, D. Y. C. Leung and K. Sumathy, Renewable Sustainable Energy Rev., 2007, 11, 401–425 CrossRef CAS.
- X. Zong, H. Yan, G. Wu, G. Ma, F. Wen, L. Wang and C. Li, J. Am. Chem. Soc., 2008, 130, 7176–7177 CrossRef CAS PubMed.
- A. Fujishima, X. Zhang and D. A. Tryk, Surf. Sci. Rep., 2008, 63, 515–582 CrossRef CAS.
- R. Daghrir, P. Drogui and D. Robert, Ind. Eng. Chem. Res., 2013, 52, 3581–3599 CrossRef CAS.
- J. Deng, X. Wen and Q. Wang, Mater. Res. Bull., 2012, 47, 3369–3376 CrossRef CAS.
- N. Zhang, Y. Zhang and Y.-J. Xu, Nanoscale, 2012, 4, 5792 RSC.
- H. Deng, X. Li, Q. Peng, X. Wang, J. Chen and Y. Li, Angew. Chem., Int. Ed., 2005, 44, 2782–2785 CrossRef CAS PubMed.
- Y. Zhang, Z. Tang, X Fu and Y. Xu, ACS nano, 2010, 4, 7303–7314 CrossRef CAS PubMed.
- M. Zhao, L. Figueroa-Cosme, A. O. Elnabawy, M. Vara, X. Yang, L. T. Roling, M. Chi, M. Mavrikakis and Y. Xia, Nano Lett., 2016, 16, 5310–5317 CrossRef CAS PubMed.
- R. K. Das, J. P. Kar and S. Mohapatra, Ind. Eng. Chem. Res., 2016, 55, 5902–5910 CrossRef CAS.
- G. Fu, L. Ding, Y. Chen, J. Lin, Y. Tang and T. Lu, CrystEngComm, 2014, 16, 1606–1610 RSC.
- A. A. Al-Kahtani and M. F. Abou Taleb, J. Hazard. Mater., 2016, 309, 10–19 CrossRef CAS PubMed.
- T. Xin, M. Ma, H. Zhang, J. Gu, S. Wang, M. Liu and Q. Zhang, Appl. Surf. Sci., 2014, 288, 51–59 CrossRef CAS.
- W. Li, J. Yang, Z. Wu, J. Wang, B. Li, S. Feng, Y. Deng, F. Zhang and D. Zhao, J. Am. Chem. Soc., 2012, 134, 11864–11867 CrossRef CAS PubMed.
- L. Tan, X. Zhang, Q. Liu, X. Jing, J. Liu, D. Song, S. Hu, L. Liu and J. Wang, Colloids Surf., A, 2015, 469, 279–286 CrossRef CAS.
- G. Mishra, K. M. Parida and S. K. Singh, ACS Sustainable Chem. Eng., 2015, 3, 245–253 CrossRef CAS.
- A. Tayyebi, M. Outokesh, S. Moradi and A. Doram, Appl. Surf. Sci., 2015, 353, 350–362 CrossRef CAS.
- M. Wang, J. Han, H. Xiong and R. Guo, Langmuir, 2015, 31, 6220–6228 CrossRef CAS PubMed.
- R. Ren, Z. Wen, S. Cui, Y. Hou, X. Guo and J. Chen, Sci. Rep., 2015, 5, 10714 CrossRef CAS PubMed.
- D. R. Tobergte and S. Curtis, J. Chem. Inf. Model., 2013, 53, 1689–1699 CrossRef PubMed.
- G. T. S. How, A. Pandikumar, H. N. Ming and L. H. Ngee, Sci. Rep., 2014, 4, 5044 CAS.
- Z. Xu, C. Huang, L. Wang, X. Pan, L. Qin, X. Guo and G. Zhang, Ind. Eng. Chem. Res., 2015, 54, 4593–4602 CrossRef CAS.
- W. Zhang, X. Li, R. Zou, H. Wu, H. Shi, S. Yu and Y. Liu, Sci. Rep., 2015, 5, 11129 CrossRef PubMed.
- P. H. Chang, Z. Li, J. S. Jean, W. T. Jiang, C. J. Wang and K. H. Lin, Appl. Clay Sci., 2012, 67–68, 158–163 CrossRef CAS.
- Y. Ma, N. Gao and C. Li, Environ. Eng. Sci., 2012, 29, 357–362 CrossRef CAS PubMed.
- L. Hu, D. Xu, L. Zou, H. Yuan and X. Hu, Acta Phys.-Chim. Sin., 2015, 31, 771–782 CAS.
- K. Dai, T. Peng, H. Chen, J. Liu and L. Zan, Environ. Sci. Technol., 2009, 43, 1540–1545 CrossRef CAS PubMed.
- M. Zhou, D. Han, X. Liu, C. Ma, H. Wang, Y. Tang, P. Huo, W. Shi, Y. Yan and J. Yang, Appl. Catal., B, 2015, 172–173, 174–184 CrossRef CAS.
- G. Zhang, W. Guan, H. Shen, X. Zhang, W. Fan, C. Lu, H. Bai, L. Xiao, W. Gu and W. Shi, Ind. Eng. Chem. Res., 2014, 53, 5443–5450 CrossRef CAS.
- A. L. Linsebigler, A. L. Linsebigler, J. T. Yates Jr, G. Lu, G. Lu and J. T. Yates, Chem. Rev., 1995, 95, 735–758 CrossRef CAS.
- S. Zhong, W. Jiang, M. Han, G. Liu, N. Zhang and Y. Lu, Appl. Surf. Sci., 2015, 347, 242–249 CrossRef CAS.
- Y. Park, S.-H. Kang and W. Choi, Phys. Chem. Chem. Phys., 2011, 13, 9425–9431 RSC.
| This journal is © The Royal Society of Chemistry 2017 |

