 Open Access Article
Creative Commons Attribution 3.0 Unported Licence
Hollow selenium encapsulated into 3D graphene hydrogels for lithium–selenium batteries with high rate performance and cycling stability
Shan Fan *,
Yong Zhang*,
Shu-Hua Li,
Tian-Yu Lan and
Jian-Li Xu
School of Material Science and Engineering, Qiqihar University, Qiqihar 161006, P. R. China. E-mail: fanshan2013@163.com
First published on 13th April 2017
Abstract
Hollow selenium (Se) nanospheres encapsulated within 3D graphene hydrogels were prepared by a two-step solution process and researched as lithium–selenium (Li–Se) battery cathode materials. Scanning electron microscopy (SEM) and transmission electron microscopy (TEM) showed that the hollow Se nanospheres were coated by homogeneous graphene shells. Thermogravimetric analysis indicated that the Se content in the nanocomposite was about 70%. The nanocomposite, as a cathode, had excellent capacity and cycling stability (343 mA h g−1 after 50 cycles at 0.2C). The remarkable electrochemical performance was due to the high content of Se and the synergistic effects of graphene. It was shown that the structure, comprising hollow Se nanospheres encapsulated into graphene, was beneficial to the practical application of the nanocomposite in Li–Se batteries.
Introduction
With increasing market demand for energy storage systems, the traditional lithium-ion (Li-ion) batteries based on transition-metal oxide or phosphate cathodes cannot meet the high energy density demands of some large-scale applications like new energy vehicles, portable electronic devices and the stationary grid.1–3 Recently, lithium–sulfur (Li–S) batteries have been widely studied due to their superior energy density (2600 W h kg−1) and low cost.4,5 Nevertheless, the Li–S batteries suffer from the bad conductivity of S, and the high solubility of the reaction intermediates ultimately causes the utilization rate of S to be relatively low and cyclic stability to be poor. Selenium (Se) has been recommended as a promising candidate for cathode materials due to having a redox mechanism similar to that of S. In the Li–Se battery, every Se atom can react with two Li ions:| Se + 2Li + 2e− ↔ Li2Se | (1) |
The gravimetric capacity of Se is 675 A h kg−1, which is lower than that of S.4 The density of Se is 2.5 times that of S, which leads to a higher volumetric capacity density (3253 mA h cm−3 based on 4.82 g cm−3) than that of S (3467 mA h cm−3 based on 2.07 g cm−3).6,7 In addition, the conductivity values of Se and S are 1 × 10⁻³ S m−1 and 5 × 10⁻²⁸ S m−1, which mean that Se has a higher utilization rate and better rate performance compared with S. From these perspectives, Se should be an alternative promising high-energy cathode material. Amine's group8,9 firstly proposed Se and SeSx to be the cathode materials for rechargeable Li and Na batteries. After that, Yu et al.10 developed this theory by exploring the feasibility of using Se and polyselenide as cathode materials for Na and Li-ion rechargeable batteries. However, the recent research findings for Li–Se batteries were still in their infancy. Se cathodes also raise the problem of the dissolution of high-order polyselenides, that lead to rapid capacity fading, poor cycle performance and low coulombic efficiency.9–11
In order to improve the electrochemical performance of the Li–Se batteries, a variety of strategies have been followed. One approach was to synthesize Se with different morphologies and structures, such as nano-fibrous Se and porous Se.12,13 Kundu et al. prepared fibrous Se as a cathode material with a reversible capacity of 375 A h kg−1 at a rate of C/13. Another approach was to confine Se within various forms of carbon material, such as porous carbon,8 carbon nanotubes10 and reduced graphene oxide. Zhang et al.11 reported a Se–NCHPC (the nitrogen-containing hierarchical porous carbon) composite that exhibited a reversible capacity of 435 mA h g−1 and was maintained at 305 mA h g−1 after 60 cycles even at a high current rate of 2C. The Se–NCHPC composite had enhanced capacity utilization and cycling life. Therefore, Se–carbon composites are promising materials for improving the energy density of the Li-ion battery.
Several composites with conductive polymers,6,10–15 metallic oxides3,7,16 and graphite carbon,17–20 etc. have been explored to improve the electrochemical performance of the Li–Se battery. 3D graphene architectures, self-assembled from 2D graphene sheets, had exceptional electrical properties, high specific surface areas, and other superior chemical and physical properties on account of the combination of the excellent properties of individual graphene sheets and 3D porous networks.21,22 All these properties mean that 3D graphene architectures satisfy the requirements of different applications, such as photodetectors, supercapacitors, thermo-electric materials and Li-ion batteries.23–26 However, the Se contained in a Se/C composite cathode influenced the volumetric capacity and energy density of Li2Se batteries.21 Herein, we report a facile synthesis of a hollow Se@reduced graphene oxide (RGO) composite for a Li–Se battery by a two-step solution process. Hollow and solid Se nanospheres could be produced by varying the amount of cetyltrimethyl ammonium bromide (CTAB) in the reaction system. In the composite cathode material, hollow Se nanospheres were encapsulated in RGO and the content of Se was 70 wt%. The hollow structure and high Se content improved the capacity and energy density of the Li2Se battery.
Experimental
All the chemicals used in this study were of analytical grade and were obtained from Aladdin. They were used as received without further purification.Preparation of hollow Se nanospheres
0.025 mol of sodium selenite (Na2SeO3) and 0.05 mol of ascorbic acid were separately dissolved in 50 mL mixed solution (vwater/vethanol = 1![[thin space (1/6-em)]](https://www.rsc.org/images/entities/char_2009.gif) :
:![[thin space (1/6-em)]](https://www.rsc.org/images/entities/char_2009.gif) 1) with the assistance of CTAB at ambient temperature. After adding the ascorbic acid, the red solution turned to brick red. The color phenomenon was due to the formation of a-Se particles. After 18 h, the products were washed with water and absolute ethanol. Subsequently the product changed progressively from red to gray, indicating that the amorphous Se phase had transformed to a trigonal phase (t-Se). The content of CTAB could be changed to get different morphologies of the nano Se.
1) with the assistance of CTAB at ambient temperature. After adding the ascorbic acid, the red solution turned to brick red. The color phenomenon was due to the formation of a-Se particles. After 18 h, the products were washed with water and absolute ethanol. Subsequently the product changed progressively from red to gray, indicating that the amorphous Se phase had transformed to a trigonal phase (t-Se). The content of CTAB could be changed to get different morphologies of the nano Se.
Preparation of nano-Se@RGO
From flake graphite, graphene oxide (GO) was synthesized using a modified Hummers' method.22 GO suspension (10 mL, 5 mg mL−1) was added to 5 mL mixture solvent (GO![[thin space (1/6-em)]](https://www.rsc.org/images/entities/char_2009.gif) :
:![[thin space (1/6-em)]](https://www.rsc.org/images/entities/char_2009.gif) Se weight ratio of 3
Se weight ratio of 3![[thin space (1/6-em)]](https://www.rsc.org/images/entities/char_2009.gif) :
:![[thin space (1/6-em)]](https://www.rsc.org/images/entities/char_2009.gif) 7). Afterwards, the above mixed solvent was transferred into a 25 mL Teflon-lined autoclave and calcined at 180 °C for 6 h. After naturally cooling to room temperature, the product was taken out with tweezers. The as-prepared hydrogel was dipped into DI water for 24 h and then freeze-dried under vacuum.
7). Afterwards, the above mixed solvent was transferred into a 25 mL Teflon-lined autoclave and calcined at 180 °C for 6 h. After naturally cooling to room temperature, the product was taken out with tweezers. The as-prepared hydrogel was dipped into DI water for 24 h and then freeze-dried under vacuum.
Materials characterization and electrochemical analyses
The morphology, structure, and chemical distribution were studied using transmission electron microscopy (TEM, Tecnai G2 F30), high resolution TEM (HR-TEM) and selected area electron diffraction (SAED). Field emission scanning electron microscopy (FE-SEM) was performed for the determination of composition using a HELIOS NanoLab 600i microscope operated at 15 kV. X-ray diffraction (XRD) patterns of all the samples were recorded on a Stoe STADI P diffractometer operating in reflection mode with Cu Kα radiation. Raman spectra were measured by an Invia Raman microscope (Renishaw, England) with an excitation wavelength of 532 nm. Thermogravimetric analysis (TGA) was performed on a DTG-60H thermal analyzer under nitrogen gas over a temperature range of 20–700 °C with a heating rate of 5 °C min−1. X-ray photoelectron spectroscopy (XPS) was carried out on an ESCALAB 250Xi spectrometer using Al Kα radiation as the X-ray source.Electrochemical measurements were conducted using CR2032 coin cells. The working electrodes comprised Se@RGO, acetylene black and PVDF (weight ratio of 80![[thin space (1/6-em)]](https://www.rsc.org/images/entities/char_2009.gif) :
:![[thin space (1/6-em)]](https://www.rsc.org/images/entities/char_2009.gif) 10
10![[thin space (1/6-em)]](https://www.rsc.org/images/entities/char_2009.gif) :
:![[thin space (1/6-em)]](https://www.rsc.org/images/entities/char_2009.gif) 10). The mixed active material was prepared to a homogeneous slurry in N-methyl-2-pyrrolidone (NMP) by stirring for 12 h, and then it was coated on an Al foil current collector. The foil was dried at 110 °C for 12 h under vacuum. The quality of the active material was about ∼2.5 mg cm−2 at each electrode. The full cell was assembled using pure Li foil as a counter electrode in an Ar-filled dry glove box. The 1.2 M LiPF6 was dissolved with ethylene carbonate/ethylmethyl carbonate (EC/EMC, 3
10). The mixed active material was prepared to a homogeneous slurry in N-methyl-2-pyrrolidone (NMP) by stirring for 12 h, and then it was coated on an Al foil current collector. The foil was dried at 110 °C for 12 h under vacuum. The quality of the active material was about ∼2.5 mg cm−2 at each electrode. The full cell was assembled using pure Li foil as a counter electrode in an Ar-filled dry glove box. The 1.2 M LiPF6 was dissolved with ethylene carbonate/ethylmethyl carbonate (EC/EMC, 3![[thin space (1/6-em)]](https://www.rsc.org/images/entities/char_2009.gif) :
:![[thin space (1/6-em)]](https://www.rsc.org/images/entities/char_2009.gif) 7, v/v) as the electrolyte. Using a NEWARE battery tester, the galvanostatic charge/discharge test was performed with the voltage window of 1.0–3.0 V vs. Li+/Li under normal conditions. Cyclic voltammetry (CV) curves were measured on a CHI760E electrochemistry workstation at a scan rate of 0.2 mV s−1.
7, v/v) as the electrolyte. Using a NEWARE battery tester, the galvanostatic charge/discharge test was performed with the voltage window of 1.0–3.0 V vs. Li+/Li under normal conditions. Cyclic voltammetry (CV) curves were measured on a CHI760E electrochemistry workstation at a scan rate of 0.2 mV s−1.
Results and discussion
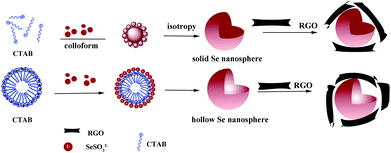
An illustrative synthesis process for solid and hollow Se@RGO is depicted in Scheme 1. In the system, the reaction is as follows:| H2SeO3 + 2C6H8O6 → Se + 2C6H8O6 + 3H2O | (2) |
When aged in the mixed solution, a-Se slowly dissolves to generate more reactive Se atoms which induce recrystallization toward t-Se.3 In this process CTAB is used as a stabilizer, which helps to generate spherical solid Se in the monodisperse spherical colloids.16,22 Increasing the concentration of CTAB causes spherical micelles to form.26 The hydrophilic groups of the CTA+ point to the outer surface and the hydrophobic ends point to the inner core of the micelle. Due to electrostatic interactions, SeSO32− anions occupy the outer surface of the micelle. Then the SeSO32− ions are converted into Se nuclei during the deposition procedure. Finally, Se nanostructures with a hollow nanosphere morphology are formed.
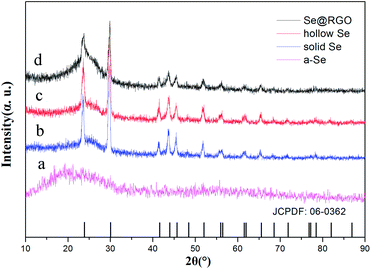
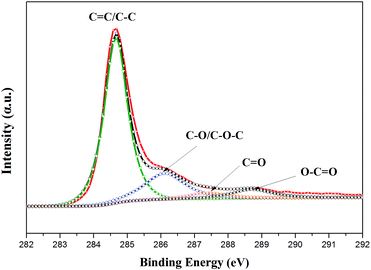
The crystal structures of the nano Se and Se@RGO were confirmed by XRD in Fig. 1. From the reduction of sodium selenite, the amorphous selenium was confirmed (Fig. 1a). Fig. 1b and c shows the XRD patterns of the products obtained by the aging of a-Se with different concentrations of CTAB (0.3 g and 1.0 g). All the peaks could be indexed to the trigonal phase of selenium (t-Se, JCPDF 06-0362).15 The hollow nanospherical t-Se encapsulated in the graphene sample is examined in Fig. 1d. The fact that the diffraction pattern is identical to that of pristine t-Se indicates that no significant change occurred to the nano selenium on compositing with graphene. No carbon peak was observed due to the low crystallization of RGO. The preparation of the nanocomposite was also proven by XPS (Fig. 2). The C 1s spectra of the hollow Se@RGO displayed one strong peak of aromatic C–C/C![[double bond, length as m-dash]](https://www.rsc.org/images/entities/char_e001.gif) C at 284.66 eV and three weak peaks due to functional groups containing oxide (C–O at 286.10 eV, C
C at 284.66 eV and three weak peaks due to functional groups containing oxide (C–O at 286.10 eV, C![[double bond, length as m-dash]](https://www.rsc.org/images/entities/char_e001.gif) O at 287.44 eV and O–C
O at 287.44 eV and O–C![[double bond, length as m-dash]](https://www.rsc.org/images/entities/char_e001.gif) O at 288.7 eV (ref. 16 and 17)), implying that most of the graphene oxide had been reduced after the hydrothermal process.
O at 288.7 eV (ref. 16 and 17)), implying that most of the graphene oxide had been reduced after the hydrothermal process.
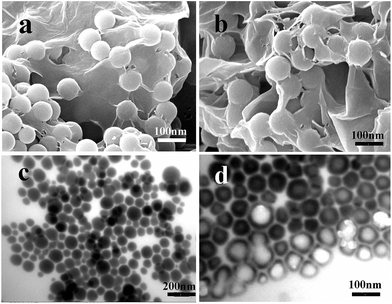
The shape, size, and structure of the as-synthesized Se nanostructures were studied using SEM and TEM. Under similar reaction conditions, differently shaped Se could be produced by simply controlling the amount of CTAB used. For example, irregular particles were prepared without using any CTAB (Fig. 3a and b), homogeneous solid nanospheres (Fig. 3c and d) were produced with 0.3 g CTAB and hollow nanospheres (Fig. 3e and f) were produced with 1.0 g CTAB (Scheme 1). The Se solid spheres varied from 50 to 100 nm in diameter (Fig. 3c) and the hollow spheres ranged from 80 to 100 nm (Fig. 3e). The TEM images (Fig. 3d and f) clearly showed the solid and hollow structures. Typical HR-TEM images of the individual Se nanostructures are displayed in the insets to Fig. 3d and f. The above results support our conclusions concerning the nanocrystalline nature of the Se samples. After wrapping with the RGO, the morphologies and sizes of the two types of Se nanospheres did not change (Fig. 4). The RGO was coated evenly on the surface of the Se nanoparticles (NPs). The Se NPs were welded and linked with the RGO sheets, which could facilitate the electron transfer.27 At the same time, the RGO prevented the Se NPs from accommodating stress and volume changes during the lithiation/delithiation process, enhancing cycling performance.28 These results indicate that the as-synthesized Se nanostructures were beneficial for achieving good conductivity and outstanding rate capability as Li-ion battery cathodes.
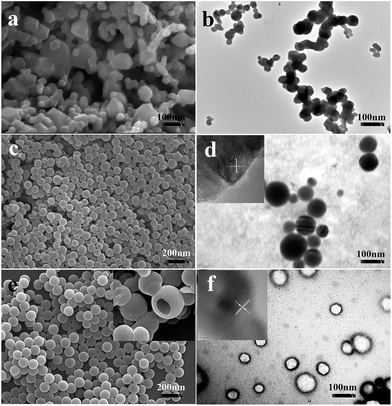 | ||
| Fig. 3 SEM and TEM images of Se NPs with different amounts of CTAB: (a and b) 0 g; (c and d) 0.3 g; (e and f) 1 g. | ||
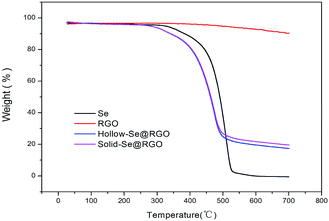
In order to determine the Se content in the samples, pure hollow Se nanospheres, RGO and hollow/solid Se@RGO nanospheres were studied using TGA under a nitrogen atmosphere. As shown in Fig. 5, the TGA curve of RGO samples was thermally stable below 540 °C. The mass loss could be attributed to the decomposition of residual oxygen functional groups. The weight loss was about 10% below 700 °C. In contrast, the TGA results showed that the weight loss of the hollow Se@RGO started at 250 °C and stopped at 470 °C. After 470 °C the weight of Se@RGO remained constant; the total weight loss was 76.5%. The solid Se@RGO curve was similar to that of the hollow Se@RGO sample and the weight loss was about 72.4%. The weight loss of pure Se was ∼100%. In Se@RGO, we inferred that the content of hollow Se was about 71.2% and that of solid Se was 67.1%, both of which are high. We believe that this high Se doping content could help to produce a higher capacity and achieve good volumetric capacity.
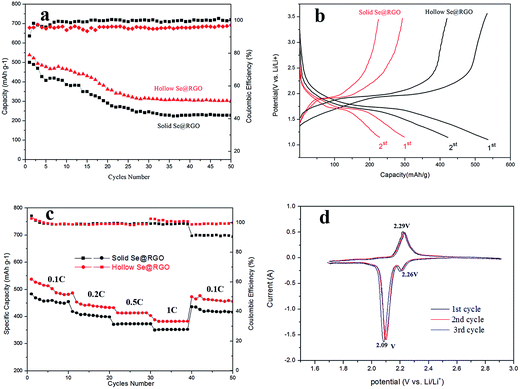
Firstly, the capacitance and cycle performance of electrodes were researched using galvanostatic charge–discharge tests. In Fig. 6a, the hollow nanosphere Se@RGO electrode stabilized at a capacity of 343 mA h g−1 after 50 cycles at 0.2C. The capacitance of the solid nanosphere Se@RGO electrode was only 253 mA h g−1 after 50 cycles. This reveals that the hollow Se structure was beneficial for enhancing the retention of battery capacity. The prominent electrical properties of the hollow Se@RGO electrode could be ascribed to the good contact between RGO and the encapsulated Se NPs within the conducting network, that led to faster electron propagation across the Se NPs and the subsequently higher capacity factor of Se.29 Furthermore, the hollow structure of Se@RGO could tolerate a 90% volumetric change for the charge/discharge process of Se NPs that confirms the excellent connection between Se and RGO and generates excellent discharge specific capacity.
Fig. 6b shows the potential profiles of hollow/solid Se@RGO electrodes for the first and second discharging–charging processes at 0.2C, exposing the platforms in the lithiation and delithiation processes. During the discharge process, two plateaus were clearly observed at 2.10 and 1.73 V, corresponding to the reduction of Se to higher-order polyselenides (Li2Sen, 4 ≤ n ≤ 8) and lower-order polyselenides (Li2Se2 and Li2Se). These results are typical for Se cathodes; they agree well with previous reports.16,17 For the discharge process, the hollow Se@RGO revealed an initial capacity of 543 mA h g−1 that was better than the 506 mA h g−1 of solid Se@RGO. This showed that the hollow structure of the Se@RGO provided enough surface area to promote electrochemical processes and that the electrolyte efficiently infiltrated the active material.
The rate capabilities of hollow and solid Se@RGO composites are shown in Fig. 6c. The capacities of hollow Se@RGO were 500, 454, 423 and 394 mA h g−1 as the electric current density was increased from 0.1 to 1C. Importantly, when the current was switched back to 0.1C, a reversible capacity of 487 mA h g−1 was maintained and the coulombic efficiency was almost 100% in the meantime, implying that the Se@RGO cathode showed a preeminent reversibility and rate capability. However, the solid Se@RGO composite electrode had a lower capacity retention ratio at the current of 1C. The better capacity and more stabilized coulombic efficiency of the hollow Se@RGO nanocomposite were due to the hollow structure and high Se content. The hollow structure ensured that the Se surface area contributed to electrochemical reactions, shortened the pathway for electrical transmission and Li+ and provided effective permeability of the electrolyte into the active material. Simultaneously, the internal void of the hollow structure afforded the volumetric expansion of Se during lithiation that led to a favourable cycle performance for Li–Se batteries. Furthermore, the high content of hollow Se doping rendered the high specific capacity and excellent volumetric capacity of the electrode.30 What is more, the homogeneous RGO nanoshells welded on the surface of the Se nanospheres contributed to the prominent electrochemistry performances.
The CV curves of hollow Se@RGO composites were collected at a scanning rate of 0.1 mV s−1 in the potential range from 1.7 to 2.9 V (vs. Li+/Li) (Fig. 6d). The CV curves showed reversible insertion and deinsertion of Li+ into the Se NPs. For the first cathodic reduction, a reductive peak appeared at 2.09 V that shifted to a higher voltage of ≈2.12 V after the first cycle, which was attributed to the poor polarization of the electrode. The overlapping CV curves after the first cycle suggested excellent reversible redox reactions and superior cycle stability. A peak appeared at the potential of 2.29 V (vs. Li+/Li), which was attributed to the phase change from Se to Li2Sen (n ≥ 4).
Conclusions
In brief, we prepared hollow Se nanospheres coated with a 3D RGO for high-performance Li–Se batteries. The nanocomposite of hollow Se nanospheres encapsulated into RGO shells had a high concentration of Se (70 wt%). The RGO prevented the dissolution and diffusion of polyselenides. The hollow Se nanospheres offered a void space for volumetric expansion. The composite materials showed a high capacity of 343 mA h g−1 at 0.2C after 50 cycles and a remarkable cycling stability at 0.1C. We believe that these results provide important insights and novel methodology for the development of other high-performance carbon–Se composite cathodes for Li–Se batteries.Acknowledgements
The authors gratefully acknowledge financial support provided by the National Natural Science Foundation of China (No. 51303087), and the Natural Science Foundation of Heilongjiang Province (No. QC2015057).Notes and references
- N. M. Dimitrijevic and P. V. Kamat, Langmuir, 1988, 4, 782–784 CrossRef CAS.
- J. Su, X. L. Wu, J. S. Lee, J. Kim and Y. G. Guo, J. Mater. Chem. A, 2013, 1, 2508–2514 CAS.
- P. Zuman and G. Somer, Talanta, 2000, 51, 645–665 CrossRef CAS PubMed.
- J. Ma, C. Sun, J. Lian and W. Zheng, Cryst. Res. Technol., 2009, 44, 391–394 CrossRef CAS.
- X. L. Ji and L. F. Nazar, J. Mater. Chem., 2010, 20, 9821–9826 RSC.
- S. H. Chung and A. Manthiram, Chem. Commun., 2014, 50, 4184–4187 RSC.
- Z. A. Zhang, Z. Y. Zhang, K. Zhang, X. Yang and Q. Li, RSC Adv., 2014, 4, 15489–15492 RSC.
- A. Abouimrane, D. Dambournet, K. W. Chapman, P. J. Chupas, W. Weng and K. Amine, J. Am. Chem. Soc., 2012, 134, 4505–4508 CrossRef CAS PubMed.
- Y. Cui, A. Aouimrane, J. Lu, T. Bolin, Y. Ren, W. Weng, C. Sun, V. A. Maroni, S. M. Heald and K. Amine, J. Am. Chem. Soc., 2013, 135, 8047–8056 CrossRef CAS PubMed.
- L. C. Zeng, W. C. Zeng, Y. Jiang, X. Wei, W. H. Li, C. L. Yang, Y. W. Zhu and Y. Yu, Adv. Energy Mater., 2015, 5, 1401377 CrossRef.
- Y. H. Qu, Z. Zhang, Y. Q. Lai, Y. X. Liu and J. Li, Solid State Ionics, 2015, 274, 71–76 CrossRef CAS.
- G. S. Cao, X. Juan Zhang, L. Su and Y. Yang Ruan, J. Exp. Nanosci., 2011, 6, 121–126 CrossRef CAS.
- Y. Ma, L. Qi, J. Ma and H. Cheng, Adv. Mater., 2004, 16, 1023–1026 CrossRef CAS.
- X. Xiao, X. Peng, H. Y. Jin, T. Q. Li, C. C. Zhang, B. Gao, B. Hu, K. F. Huo and J. Zhou, Adv. Mater., 2013, 25, 5091–5097 CrossRef CAS PubMed.
- H. Zhang, D. Yang, Y. Ji, X. Ma, J. Xu and D. Que, J. Phys. Chem. B, 2004, 108, 1179–1182 CrossRef CAS.
- P. Xiang, L. Wang, X. M. Zhang, B. Gao, J. J. Fu, S. Xiao, K. F. Huo and P. K. Chu, J. Power Sources, 2015, 288, 214–220 CrossRef.
- K. Dipan, F. Krumeich and R. Nesper, J. Power Sources, 2013, 236, 112–117 CrossRef.
- L. C. Yin, J. L. Wang, F. J. Lin, J. Yang and Y. Nuli, Energy Environ. Sci., 2012, 5, 6966–6972 CAS.
- Y. J. Mai, X. L. Wang, J. Y. Xiang, Y. Q. Qiao, D. Zhang, C. D. Gu and J. P. Tu, Electrochim. Acta, 2011, 56, 2306–2311 CrossRef CAS.
- S. Stankovich, D. A. Dikin, G. H. B. Dommett, K. M. Kohlhaas, E. J. Zimney, E. A. Stach, R. D. Piner, S. T. Nguyen and R. S. Ruoff, Nature, 2006, 442, 282–286 CrossRef CAS PubMed.
- H. Wang, L. F. Cui, Y. Yang, H. Sanchez Casalongue, J. T. Robinson, Y. Liang, Y. Cui and H. Dai, J. Am. Chem. Soc., 2010, 132, 13978–13980 CrossRef CAS PubMed.
- N. Li, M. Zheng, H. Lu, Z. Hu, C. Shen, X. Chang, G. Ji, J. Cao and Y. Shi, Chem. Commun., 2012, 48, 4106–4108 RSC.
- M. H. He, Y. N. Chen, H. Liu, J. L. Wang, X. S. Fang and Z. Q. Liang, Chem. Commun., 2015, 51, 9659–9661 RSC.
- J. K. L. Xu, G. M. Chen and D. Qiu, J. Mater. Chem. A, 2013, 1, 12395–12399 Search PubMed.
- C. Y. Gao and G. M. Chen, Compos. Sci. Technol., 2016, 124, 52–70 CrossRef CAS.
- C. Zhao, L. Liu, H. Zhao, A. Krall, Z. Wen, J. Chen, P. Hurley, J. Jiang and Y. Li, Nanoscale, 2014, 6, 882–888 RSC.
- C. H. A. Wong, Z. Sofer, M. Kubesova, J. Kucera, S. Matejkova and M. Pumera, Proc. Natl. Acad. Sci. U. S. A., 2014, 111(38), 13774–13779 CrossRef CAS PubMed.
- K. Han, Z. Liu, H. Q. Ye and F. Dai, J. Power Sources, 2014, 263, 85–89 CrossRef CAS.
- F. H. Tian, L. Liu, Z. H. Yang, X. Y. Wang and Q. Q. Chen, Mater. Chem. Phys., 2011, 127, 151–155 CrossRef CAS.
- V. S. Saji and C. W. Lee, RSC Adv., 2013, 3, 10058–10077 RSC.
| This journal is © The Royal Society of Chemistry 2017 |

