 Open Access Article
Cation–anion substitution induced spectral tuning and thermal stability optimization in Sr2SiO4:Eu phosphors†
Yue Zhu,
Jin Wang ,
Mingyi Zhao,
Chonghui Chen,
Lingling Zheng,
Yingliang Liu,
Bingfu Lei* and
Haoran Zhang*
Guangdong Provincial Engineering Technology Research Center for Optical Agriculture, College of Materials and Energy, South China Agricultural University, Guangzhou 510642, P. R. China. E-mail: tleibf@scau.edu.cn; Fax: +86-20-85285026; Tel: +86-20-85282603
First published on 23rd January 2017
Abstract
Spectral tuning and thermal stability are important for the optimization and modification of phosphor materials. Herein we report a solid solution of Sr2Si1−xAlxO4−2xNx:Eu phosphors in which cation–anion substitution (Al3+–N3− replacing Si4+–O2−) leads to the co-existence of Eu2+ and Eu3+ activators even under a reducing atmosphere. X-ray diffraction, FT-IR, photoluminescence analysis, UV-vis absorption and fluorescence lifetime studies indicated that the structure reconstruction contributes to tunable emission colors and better thermal quenching behavior, which are valuable for pc-WLED applications.
1 Introduction
Due to its high energy efficiency, long lifetime, short response time, huge energy savings and environmental friendliness, nowadays phosphor-converted white light-emitting diodes (pc-WLEDs) have gained a broad consensus to act as the next-generation solid state lighting (SSL) source after incandescent and fluorescent lamps. This profound achievement benefits from continual research of technologies and materials related to LEDs, which show great prospects in visual signals, common lighting, communication, sensors, light matter interactions and so on.1–3 At present, a typical pc-WLED is assembled through a blue InGaN LED chip and a yellow cerium(III)-doped yttrium aluminium garnet (YAG:Ce3+) phosphor. However, with long-wavelength spectral emission lacked, this solution to generate white light suffers from a high correlated color temperature (CCT > 4000 K) and a poor color rendering index (CRI < 80). To improve the CRI and tune the CCT value, LED chips (blue-emitting or n-UV) coated with red-, yellow-/green- and blue-emitting multi-phased phosphors have attracted considerable attentions. But this multi-phased phosphors method frequently results in increasing manufacture cost, and strong reabsorption owing to spectral mismatch.4,5 Plainly, the phosphors play a key role in producing high-quality white lighting. Therefore, in addition to luminescence efficiency and chemical/thermal stability, spectral tuning and matching must be considered for light-conversion luminescent materials in WLEDs.Given the unavoidably spectral mismatching problem of multi-phased phosphor solution, the realization of multi-color luminescence in a single phase offers a promising possibility to generate white light with superior CRI and lower CCT, which also reconcile spectra adjustment and energy loss simultaneously. The most common and easiest way for multi-color emitting is the combination of several luminescence centers in one host, like Eu2+/Mn2+ codoping phosphors.6,7 However, this multi-color luminescence depends on the energy transfer from sensitizer to activator in the co-doping system, implying the relatively low luminescence efficiency.
Recently, the focus on the tunable luminescence of phosphors has become a research hotspot, especially based on the modification of local crystal structure including doping level control, cation substitution, anion substitution and cation–anion substitution etc.8–10 For instance, Sato et al. realized the tailoring of deep-red luminescence in Ca2SiO4:Eu2+ on the basis of the Eu2+ ions tending to occupy another cation site (corresponding to long-wavelength emitting) with the increasing doping level.11 Xia described the strategy of “chemical unit cosubstitution” to tune luminescent properties in Ca2(Al1−xMgx)(Al1−xSi1+x)O7:Eu2+ and Lu3(Al,Mg)2(Al,Si)3O12:Ce3+ with the substitution of Al3+–Al3+ couple by Mg2+–Si4+ pair.12,13 Generally, all these variations in host composition usually alter the symmetry, coordination environment, crystal field strength, covalence, and the energy transfer, thus influencing luminescence properties. In particular, the approach of cation–anion substitution can result in tunable valences of the activators in some special cases, for example, Huang et al. reported a tuneable valence of Eu in Ca12Al14O32F2 by controlling the activator sites through the replacement of Si–O by Al–F.14 Xia et al. also achieved coexistence of Eu2+ and Eu3+ ions in the Ca2+xLa8−x(SiO4)6−x(PO4)xO2 host lattice via the preferential site occupancy and charge balance of cation co-substitution.15 This creative discovery, obtaining the emissions of Eu2+ and Eu3+ ions in a single phase simultaneously, performs great benefits in pc-WLEDs due to their abundant emission colors of 5d–4f or 4f–4f transitions. Though the cation–anion substitution method gets the natural advantage to obtain white light emitting in pc-WLEDs with superior CRI and lower CCT, published literatures and alternative hosts are relative few until now. On the other hand, this approach commonly needs a high level of doping or substitution, which easily sacrifices the emission intensity and thermal stability of phosphor.9,14,16
(Ca,Sr,Ba)2SiO4:Eu2+ is a widely used class of phosphor with interesting thermal quenching behavior. These compounds exhibit efficient excitation under near-UV and blue light, with emissions ranging from green for Ba2SiO4:Eu2+ to yellow for Sr2SiO4:Eu2+.17–19 The cation substitution (e.g., (Ca/Sr/Ba)2SiO4:Eu2+) and anion substitution (e.g., α′-Sr2Si3x/4O2Nx:Eu2+, Sr2SiNzO4−1.5z:Eu2+ and Sr2Si(O1−xNx)4:Eu2+) performed to optimize the emission peak and thermal stability.20–23 However, no report about the effects of cation–anion cosubstitution on the luminescence property in Sr2SiO4:Eu2+ has been previously noted in the literature. In this study, the cation–anion cosubstitution of Si4+–O2+ by Al3+–N3− in Sr2SiO4:Eu2+ was investigated in detail, including the variation of structure and luminescence property. The disordered solid-solution Sr2Si1−xAlxO4−2xNx:Eu resulted in the mixed Eu valences, continuous spectral tuning and thermal stability optimization, which are valuable for high-quality pc-WLEDs applications.
2 Experimental section
2.1 Materials and synthesis
Sr1.98Si1−xAlxO4−2xNx:0.02Eu phosphors were prepared from appropriate stoichiometric mixture of SrCO3 (A. R.), SiO2 (A. R.), AlN (A. R.), and Eu2O3 (A. R.) by traditional high temperature solid-state reaction method. All raw materials were purchased commercially without further treatment. In a typical process, the starting materials were weighted and mixed thoroughly in an agate mortar according to different values of x. Then the powder mixtures were annealed at 1250 °C for 4 h in a corundum crucible under the reducing atmosphere (N2/H2 = 95![[thin space (1/6-em)]](https://www.rsc.org/images/entities/char_2009.gif) :
:![[thin space (1/6-em)]](https://www.rsc.org/images/entities/char_2009.gif) 5%). The as-prepared samples were cooled to room temperature naturally, and after discarding the top layer of the nongrinded products, the interior of uniform samples was ground into powder for next characterization. For comparison, sample Sr1.98SiO4:0.02Eu3+, synthesized in air was also obtained under same sintered procedure.
5%). The as-prepared samples were cooled to room temperature naturally, and after discarding the top layer of the nongrinded products, the interior of uniform samples was ground into powder for next characterization. For comparison, sample Sr1.98SiO4:0.02Eu3+, synthesized in air was also obtained under same sintered procedure.
2.2 Characterization
Crystal structure of the samples was analyzed by X-ray powder diffractometer (SHIMADZU, XRD-6000, Cu Kα radiation, λ = 0.15406 Å). The data were collected in a 2θ range from 20° to 80° with a scanning step of 0.02° and a scanning rate of 4° min−1. Room-temperature photoluminescence and photoluminescence excitation (PLE) spectra were measured with a Hitachi F-7000 (Tokyo, Japan) spectrophotometer equipped with a 150 W xenon arc lamp. The digital pictures of the samples are photographed using a digital camera (Canon EOS 40D, Tokyo, Japan). Temperature-dependent (300–460 K) photoluminescence spectra were conducted using a heating apparatus (OXFORD instrument, Oxon, UK) in combination with the above Hitachi 7000 spectrophotometer. Decay curves were measured using a FSP920 Time Resolved and Steady State Fluorescence Spectrometers (Edinburgh Instruments) equipped with a 450 W Xe lamp, a 150 W nF900 flash lamp, TM300 excitation monochromator and double TM300 emission monochromators and thermo-electric cooled red-sensitive PMT. Fourier-transform infrared (FT-IR) spectra were measured on a BRUKER TENSOR 27 spectrophotometer in the range of 400–4000 cm−1 using the KBr pellet (∼2 wt%) method. UV-vis spectra were measured on a Shimadzu UV-2550 spectrophotometer.3 Results and discussion
The phase purities of the Sr1.98Si1−xAlxO4−2xNx:0.02Eu (x = 0–0.1) compounds were confirmed using X-ray powder diffraction (XRD), as shown in Fig. 1. Sr2SiO4 has two crystallographic phases: the high temperature α′-Sr2SiO4 (orthorhombic, Pmab) phase and the low temperature β-Sr2SiO4 (monoclinic, P21/c) phase. The low temperature (∼358 K) of α′ ↔ β phase transition results in frequently co-existence of the two phases through a short-range rearrangement of the coordination structure without breaking any bonds.24,25 When sintered at 1250 °C, it shows that all the diffraction peaks matched well with the α′-Sr2SiO4 phase, except for small amounts impurity of β-Sr2SiO4 phase (marked as β symbol) peaking at 27.6° and 32.3° (2θ) with x values of 0 and 0.01. These suggest that the introduction of europium and AlN cannot affect the main crystal structure through partial replacement. After the incorporation of AlN into Sr2SiO4 host, the diffraction peaks also show small shifts toward larger 2θ value, indicating the formation of solid solutions. When x value exceeds 0.1, unknown phases were detected and the crystallinity degree of the obtained production was lower, as signposted in Fig. S1 in ESI.† The FT-IR spectra of Sr1.98Si1−xAlxO4−2xNx:0.02Eu (x = 0 and 0.1) phosphors also support the successful incorporation of AlN into host compounds, in which the peak of Sr/Eu–N bond vibration appears in sample of x = 0.1, while the sample with x = 0 does not show such peak (see Fig. S2 in ESI†).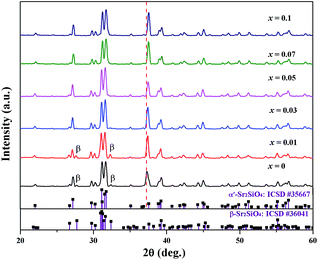 | ||
| Fig. 1 XRD patterns of Sr1.98Si1−xAlxO4−2xNx:0.02Eu (x = 0–0.1), together with the standard data for α′/β-Sr2SiO4 (ICSD #35667 and ICSD #36041) as reference. | ||
Both in α′-Sr2SiO4 and β-Sr2SiO4, Sr2+ ion occupies two kind of inequivalent sites: the ten-coordinated Sr(1) and the nine-coordinated Sr(2) sites, while Sr(1) and Sr(2) occur in the same amount. Given the change of O atom position and occupation, the α′-Sr2SiO4 phase further exist disordered (isotropic) and ordered (anisotropic) structure models.21 In the disordered α′-Sr2SiO4, each atom lying on the mirror plane was split into two, in very close positions equivalent by symmetry; and four kind of oxygen atoms can be observed, as shown in Fig. 2. After careful analysis the cases Sr2SiNzO4−1.5z:Eu2+ and Sr2Si(O1−xNx)4:Eu2+, it is not hard to find that the obtained Sr1.98Si1−xAlxO4−2xNx:0.02Eu (x = 0–0.1) phosphors also possess the disordered α′-Sr2SiO4 phase in consideration of the inhomogeneous substitutions (Al3+–N3− → Si4+–O2−), resulting in local coordination environment changes.
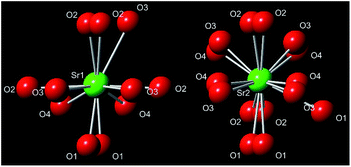 | ||
| Fig. 2 Coordination spheres of the two different Sr2+ sites in the disordered α′-Sr2Si1−xAlxO4−2xNx. | ||
Fig. 3 gives the excitation and emission spectra of samples Sr2Si1−xAlxO4−2xNx:0.02Eu (x = 0, 0.07 and 0.1). As seen in Fig. 3a, the emission spectrum of Sr1.98Si1−xAlxO4−2xNx:0.02Eu (x = 0), namely, Sr1.98SiO4:0.02Eu2+, reveals two obviously broad emission bands under 320 nm excitation. Due to the similar ion radii of Sr2+ (1.31 Å, 9CN; 1.36 Å, 10CN) and Eu2+ (1.30 Å, 9CN; 1.35 Å, 10CN), the doped Eu2+ ions will occupy the Sr2+ sites in Sr2SiO4 host lattice.26 Eu(1) and Eu(2) emissions, originating from the Eu2+ ions incorporation at Sr(1) and Sr(2) sites respectively, are seriously affected by local crystal field. Accordingly, the broad emission bands can be fitted to two subbands centered at 490 nm and 550 nm by using Gaussian functions, related to the parity allowed 4f65d → 4f7 transitions of Eu2+ ions. The higher-energy emission peak (490 nm) corresponds to the Eu(1) emission owning to its loose environment (10-coordination), while the lower-energy emission peak (550 nm) originates form Eu(2) emission for the tighter environment (9-coordination).27 On the other hand, the excitation spectrum (λem = 550 nm) of Sr1.98SiO4:0.02Eu2+ shows a broad band ranging from 250 nm to 450 nm, which is attributable to the 4f65d multiplets of Eu2+ excited states. However, the excitation spectrum (λem = 490 nm) exhibits a narrower excitation band centered at 320 nm.
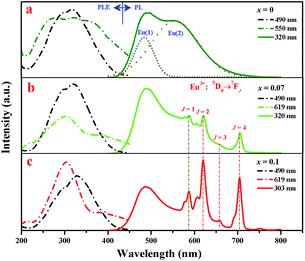 | ||
| Fig. 3 Room-temperature PLE and PL spectra of Sr1.98Si1−xAlxO4−2xNx:0.02Eu (x = 0, 0.07 and 0.1) phosphors. | ||
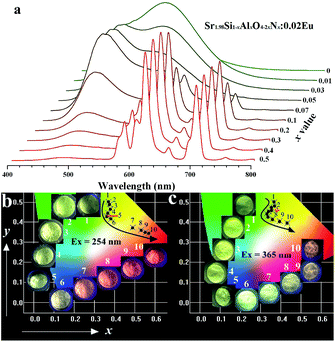
The introduction of AlN into Sr2SiO4:Eu was supposed to replace Si4+–O2−, resulting in Sr2Si1−xAlxO4−2xNx:0.02Eu phosphors under the reducing atmosphere. Note that sharp red emission appeared as the doping amount of cation–anion substitution exceeds 0.07 (see in Fig. 3b and c). Furthermore, with doping content level of AlN increases, the sharp red emission intensity increases while the luminescence (∼490 nm) originating from Eu2+ decreases to intuitively disappearing at x = 0.5, as shown in Fig. 4a. Given the well-known characteristic 4f–4f electron transitions of Eu3+, we concluded these sharp emissions comes from Eu3+ emission, which means that two activators of Eu3+ and Eu2+ co-exists in Sr2Si1−xAlxO4−2xNx:0.02Eu phosphors (0.07 ≤ x < 0.5). To confirm this, sample Sr1.98SiO4:0.02Eu3+ was synthesized in air, and its PL and PLE spectra were given in Fig. S3 in ESI.† The strongest line emission peak at 614 nm (5D0 → 7F2) and other characteristic peaks are consistent with the sharp red emissions in Sr1.98Si1−xAlxO4−2xNx:0.02Eu. However, obvious difference occurs between the charge transfer bands (CTB) of O2− → Eu: the CTBs of Sr1.98SiO4:0.02Eu3+ and Sr1.98Si1−xAlxO4−2xNx:0.02Eu phosphors locate at 254 nm and 303 nm respectively, indicating the different band transitions and successful reconstruction through cation–anion substitution in host lattices. Besides, Fig. S4† shows the UV-vis absorption spectra of Sr2Si1−xAlxO4−2xNx:0.02Eu (x = 0 and 0.1) phosphors. A strong absorption band in the range 200–320 nm of sample x = 0.1 was mainly ascribed to the intra configurational 4f–4f transition from the ground 4F0 level of Eu3+, while the broad band in the range 250–500 nm of sample x = 0 are contributed to the 5d–4f transitions of Eu2+, which corresponds to corresponding excitation spectra. These results are in good agreement with those reported in the literature.28 Fig. 4b further lists the photographs and Commission International de I'Eclairage (CIE) coordinates of all samples (x = 0–0.5). As shown, the luminescence colors can be tuned from green to red, corresponding CIE coordinates of these samples are regularly shifted from (0.38, 0.465) to (0.569, 0.346), (0.368, 0.498) to (0.432, 0.396) under 254 nm and 365 nm excitation respectively.
Fig. 5 depicts the normalized lifetime decay curves for samples Sr2Si1−xAlxO4−2xNx:0.02Eu (x = 0 and 0.1) by monitoring at 619 nm and 490 nm under 320 nm excitation. It turns out that the decay curve (x = 0, λem = 619 nm; x = 0.1, λem = 490 nm) can be well fitted by a second order exponential equation:
I(t) = I0 + A1![[thin space (1/6-em)]](https://www.rsc.org/images/entities/char_2009.gif) exp(−t/τ1) + A2 exp(−t/τ1) + A2![[thin space (1/6-em)]](https://www.rsc.org/images/entities/char_2009.gif) exp(−t/τ2) exp(−t/τ2) |
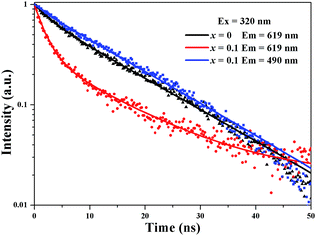 | ||
| Fig. 5 Decay curves of Sr1.98Si1−xAlxO4−2xNx:0.02Eu (x = 0 and 0.1), the solid line was obtained by fitting. | ||
While the decay curve (x = 0.1, λem = 619 nm) can be well fitted by the nonexponential equation:29,30
From the point view of applied physics, multiple factors, such as coordination environment, crystal site size and band gap of the compound, are the reasons for valance stability of lanthanide. Partial substitution commonly results in the variations of local crystal structure. Based on the ions radius: r(Si4+) = 0.26 Å (4CN), r(Al3+) = 0.39 Å (4CN), r(N3−) = 1.46 Å (4CN) and r(O2−) = 1.38 Å (4CN),26 the cation–anion substitution of Si4+–O2− by Al3+–O3− leads to the expansion of (Si/Al)(O/N)4 tetrahedron, which will shrink the position of Sr2+ sites. Fig. S4† shows the excitation spectra (λem = 490 nm) of samples Sr1.98Si1−xAlxO4−2xNx:0.02Eu (x = 0–0.2). The strongest excitation band trends to redshift from 318 nm to 350 nm with increasing x value, which results from the suppress of Eu2+ vibration after cation–anion substitution. In the cases of Ca12Al14−zSizO32F2−z:Eu, and Ca1+xY1−xAl1−xSixO4:Eu, the occupation sites of Eu3+ in CaO6F and CaO9 get to expand after corresponding substitutions, which could favor the reduction Eu3+ to Eu2+.14,31 On the contrary, the shrinkage of (Sr/Eu)O9 in Sr2Si1−xAlxO4−2xNx:Eu gets the ability to fix the activators as trivalent valence.32 Therefore, here the cation–anion substitution contributes to the emerge of Eu3+ in Sr2Si1−xAlxO4−2xNx:Eu even under the reducing atmosphere.
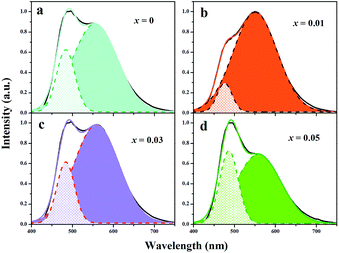
It is vulnerable to overlook the fact that the activator Eu3+ emerges at Sr(2) site initially, not just because the peak position of Eu3+ emission locates at the longer-wavelength side. Careful analysis was conducted below. As mentioned before, there are no obvious sharp emissions of Eu3+ activator in the emission spectra of samples 0 ≤ x ≤ 0.05 (see Fig. 4a). Specifically, the emission intensity of Eu2+ at Sr(2) site decreases with the doping content of AlN increases, but the emission intensity of Eu2+ at Sr(1) site increases in the range of 0 ≤ x ≤ 0.07. On the other hand, the Eu3+ ions have smaller ion radius than that of Eu2+ ions, indicating that Eu3+ prefer to occupy at the compact site. Fig. 6 further represents the emission spectra fitted with two Gaussian functions of samples Sr2Si1−xAlxO4−2xNx:0.02Eu (x = 0, 0.01, 0.03 and 0.05), which shows the contribution of Eu(1) and Eu(2) emissions in two distinct crystallographic sites to the total emission spectra. The proportion of Eu(1) emission to total emission varies from 25.2%, 12.2%, 11.2% to 16.2% with x values of 0, 0.01, 0.03 and 0.05, respectively, which that of Eu(2) emissions are 79.2%, 91.4%, 40.9% and 35.6%. The results show that the integrated area of Eu(2) emission to total emission increase when x value rises from 0 to 0.01. This may contribute to the energy transfer between Eu2+ ions at Sr sites because the large band overlap of excitation spectrum of Eu2+ in Sr(2) site and emission spectrum of Eu2+ in Sr(1) site. When x value exceeds 0.03, the proportion of Eu(1) emission increases due to part of Eu activators at Sr(2) site fixing as Eu3+ ions with the amount of cation–anion substitution increases.
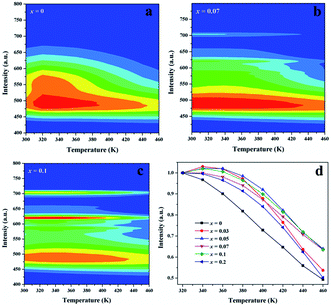
For applications in high power LEDs, the thermal stability of phosphors must be taken into consideration due to high operating temperature. Fig. 7 gives the temperature-dependent emission spectra of Sr1.98Si1−xAlxO4−2xNx:0.02Eu (x = 0, 0.07 and 0.1), plotted in a two-dimensional wavelength-temperature contour map. For all emissions at different temperatures (300–460 K), the 5d–4f transitions of Eu2+ at Sr(1) site (x = 0, 0.07 and 0.1) show the same peak positions at 490 nm, while the emission of Eu2+ in Sr(2) site (x = 0) exhibit strong temperature quenching. Of course, the contour map also shows obvious emission of Eu3+ ions. With respect to the integrated PL intensity at different temperature, detail information was represented in Fig. 7d. As seen, the PL intensity shows a constant decreasing with the temperature increasing from 300 K to 460 K due to the nonradiative energy transfer. The decreasing integrated PL intensity can be well fitted by Arrhenius equation33
I(T) = I0/(1 + C![[thin space (1/6-em)]](https://www.rsc.org/images/entities/char_2009.gif) exp(−EA/kT)) exp(−EA/kT)) |
4 Conclusions
The Sr2Si1−xAlxO4−2xNx:Eu (0 ≤ x ≤ 0.5) phosphors were prepared by a conventional solid state reaction method. The XRD analysis results indicated that cation–anion substitution of Si4+–O2− by Al3+–N3− incorporated into α′-Sr2SiO4 successfully and form substitutional solid solution. The replacement could achieve the co-existence of Eu2+ and Eu3+ activators. While the Eu3+ ions preferred to occupy at the Sr(2) site and its characteristic emissions emerged around a doping content level of 0.07. The Sr2Si1−xAlxO4−2xNx:Eu phosphor exhibited broad excitation bands and both green emission (∼490 nm and ∼550 nm) and red emission (∼619 nm), corresponding luminescence colors can be tuned from green to red with CIE coordinates shifting from (0.38, 0.465) to (0.569, 0.346), (0.368, 0.498) to (0.432, 0.396) under 254 nm and 365 nm excitation respectively. Furthermore, the cation–anion substitution could improve the thermal stability of the Sr2SiO4:Eu2+ phosphor. Based on the adjustable emission properties from green to red and the optimized thermal stability, Sr2Si1−xAlxO4−2xNx:Eu phosphor could be a good candidate for use in white light emitting diodes.Acknowledgements
The present work was supported by the National Natural Science Foundations of China (Grant No. 21371062, 21671070), the Teamwork Projects funded by the Guangdong Natural Science Foundation (Grant No. S2013030012842), the Project for Construction of High-level University in Guangdong Province, the Provincial Science and Technology Project of Guangdong Province (No. 2016A050502043, 2015B090903074), the Guangzhou Science & Technology Project (No. 201605120833193) funded for Bingfu LEI, the Spectral Funds for the Cultivation of Guangdong College Student Scientific and Technological Innovation (“Climbing Program” Special Funds), and the Student Innovative Project (Grant No. 201610564354).Notes and references
- H. A. Höppe, Angew. Chem., Int. Ed., 2009, 48, 3572–3582 CrossRef PubMed
.
- H. K. Park, J. H. Oh, H. Kang, J. Zhang and Y. R. Do, ACS Appl. Mater. Interfaces, 2015, 7, 4549–4559 CAS
.
- S. P. Liu, J. A. Mares, X. Q. Feng, A. Vedda, M. Fasoli, Y. Shi, H. M. Kou, A. Beitlerova, L. X. Wu, C. D. Ambrosio, Y. B. Pan and M. Nikl, Adv. Opt. Mater., 2016, 4, 731–739 CrossRef CAS
.
- C. H. Huang, W. R. Liu, T. S. Chan and Y. T. Lai, Dalton Trans., 2014, 43, 7917–7923 RSC
.
- H. Daicho, T. Lwasaki, K. Enomoto, Y. Sasaki, Y. Maeno, Y. Shinomiya, S. Aoyagi, E. Nishibori, M. Sakata, H. Sawa, S. Matsuishi and H. Hosono, Nat. Commun., 2012, 3, 1132 CrossRef PubMed
.
- J. Chen, Y. G. Liu, L. F. Mei, Z. Y. Wang, M. H. Fang and Z. H. Huang, J. Mater. Chem. C, 2015, 3, 5516–5523 RSC
.
- K. Li, M. G. Xu, J. Fan, M. M. Shang, H. Z. Lian and J. Lin, J. Mater. Chem. C, 2015, 3, 11618–11628 RSC
.
- M. M. Shang, C. X. Li and J. Lin, Chem. Soc. Rev., 2014, 43, 1372–1386 RSC
.
- G. G. Li, Y. Tian, Y. Zhao and J. Lin, Chem. Soc. Rev., 2015, 44, 8688–8713 RSC
.
- Z. G. Xia and Q. L. Liu, Prog. Mater. Sci., 2016, 84, 59–117 CrossRef CAS
.
- Y. Sato, H. Kato, M. Kobayashi, T. Masaki, D.-H. Yoon and M. Kakihana, Angew. Chem., Int. Ed., 2014, 53, 7756–7759 CrossRef CAS PubMed
.
- Z. G. Xia, C. G. Ma, M. S. Molokeev, Q. L. Liu, K. Rickert and K. R. Poeppelmeier, J. Am. Chem. Soc., 2015, 137, 12494–12497 CrossRef CAS PubMed
.
- H. P. Ji, L. Wang, M. S. Molokeev, N. Hirosaki, R. J. Xie, Z. H. Huang, Z. G. Xia, O. M. ten Kate, L. H. Liu and V. V. Atuchin, J. Mater. Chem. C, 2016, 4, 6855–6863 RSC
.
- K. W. Huang, W. T. Chen, C. I. Chu, S. F. Hu, H. S. Sheu, B. M. Cheng, J. M. Chen and R. S. Liu, Chem. Mater., 2012, 24, 2220–2227 CrossRef CAS
.
- Y. Xia, J. Chen, Y. G. Liu, M. S. Molokeev, M. Guan, Z. Huang and M. Fang, Dalton Trans., 2016, 45, 1007–1015 RSC
.
- L. Shi and H. J. Seo, Opt. Express, 2011, 19, 7147–7152 CrossRef CAS PubMed
.
- H. He, R. L. Fu, X. F. Song, D. L. Wang and J. K. Chen, J. Lumin., 2008, 128, 489–493 CrossRef CAS
.
- K. A. Denault, J. Brgoch, M. W. Gaultois, A. Mikhailovsky, R. Petry, H. Winkler, S. P. DenBaars and R. Seshadri, Chem. Mater., 2014, 26, 2275–2285 CrossRef CAS
.
- C. F. Guo, Y. Xu, F. Lv and X. Ding, J. Alloys Compd., 2010, 497, L21–L24 CrossRef CAS
.
- Z. G. Pan, H. He, R. L. Fu, S. Agathopoulos and X. F. Song, J. Lumin., 2009, 129, 1105–1108 CrossRef CAS
.
- X. J. Li, Y. J. Hua, H. P. Ma, D. G. Deng, G. H. Jia and S. Q. Xu, RSC Adv., 2015, 5, 62659–62669 RSC
.
- Z. Y. Zhao, Z. G. Yang, Y. R. Shi, C. Wang, B. T. Liu, G. Zhu and Y. H. Wang, J. Mater. Chem. C, 2013, 1, 1407–1412 RSC
.
- J. Park, S. J. Lee and Y. J. Kim, Cryst. Growth Des., 2013, 13, 5204–5210 CAS
.
- J. Barzowska, K. Szczodrowski, M. Grinberg, S. Mahlik, K. Anders, R. Piramidowicz and Y. Zorenko, J. Phys.: Condens. Matter, 2013, 25, 425501 CrossRef CAS PubMed
.
- L. C. Ju, X. Xu, L. Y. Hao, Y. Lin and M. H. Lee, J. Mater. Chem. C, 2015, 3, 1567–1575 RSC
.
- R. D. Shannon, Acta Crystallogr., 1976, 32, 751–767 CrossRef
.
- X. J. Li, Y. J. Hua, H. P. Ma, D. G. Deng and S. Q. Xu, CrystEngComm, 2015, 17, 9123–9134 RSC
.
- H. Nagabhushana, D. V. Sunitha, S. C. Sharma, B. D. Prasad, B. M. Nagabhushana and R. P. S. Chakradhar, J. Alloys Compd., 2014, 595, 192–199 CrossRef CAS
.
- Z. G. Xia, M. S. Molokeev, A. S. Oreshonkov, V. V. Atuchin, R. S. Liu and C. Dong, Phys. Chem. Chem. Phys., 2014, 16, 5952–5957 RSC
.
- J. Wang, H. R. Zhang, B. F. Lei, H. W. Dong, H. M. Zhang, Y. L. Liu, M. T. Zheng and Y. Xiao, J. Am. Ceram. Soc., 2015, 98, 1823–1828 CrossRef CAS
.
- Y. Zhang, X. J. Li, K. Li, H. Z. Lian, M. M. Shang and J. Lin, ACS Appl. Mater. Interfaces, 2015, 7, 2715–2725 CAS
.
- W. Li, J. Wang, H. R. Zhang, Y. L. Liu, B. F. Lei, J. L. Zhuang, J. H. Cui, M. Y. Peng and Y. Zhu, RSC Adv., 2016, 6, 33076–33082 RSC
.
- J. Wang, H. R. Zhang, Y. L. Liu, H. W. Dong, B. F. Lei, M. T. Zheng, Y. Xiao, M. Y. Peng and J. Wang, J. Mater. Chem. C, 2015, 3, 9572–9579 RSC
.
Footnote |
| † Electronic supplementary information (ESI) available. See DOI: 10.1039/c6ra28209a |
| This journal is © The Royal Society of Chemistry 2017 |

