 Open Access Article
Creative Commons Attribution 3.0 Unported Licence
Porous carbon derived from aniline-modified fungus for symmetrical supercapacitor electrodes†
Keliang Wang*a,
Ming Xub,
Xiaomin Wanga,
Zhengrong Gu *a,
Qi Hua Fan*c,
William Gibbonsd and
Jason Croatd
aAgricultural and Biosystems Engineering Department, South Dakota State University, Brookings, SD 57007, USA. E-mail: wangsdsu@gmail.com; zhengrong.gu@sdstate.edu
bPetroChina Lanzhou Petrochemical Company, Lanzhou, Gansu 730060, China
cDepartment of Electrical and Computer Engineering, Department of Chemical Engineering and Materials Science, Michigan State University, East Lansing, MI 48824, USA. E-mail: qfan@egr.msu.edu
dBiology and Microbiology Department, South Dakota State University, Brookings, SD 57007, USA
First published on 23rd January 2017
Abstract
N incorporated carbon materials are proven to be efficient EDLCs electrode materials. In this work, aniline modified fungus served as a raw material, and N-doped porous activated carbon is prepared via an efficient KOH activation method. A porous network with a high specific surface area of 2339 m2 g−1 is displayed by the prepared carbon material, resulting in a high accessible surface area and low ion diffusion resistance which is desirable for EDLC electrode materials. In assembled EDLCs, the N–AC based electrode exhibits a specific capacitance of 218 F g−1 at a current density of 0.1 A g−1. Besides, excellent stability is displayed after 5000 continuous cycles at different current densities ranging from 0.1 to 10 A g−1. The present work reveals a promising candidate for electrode materials of EDLCs.
1. Introduction
Supercapacitors have attracted considerable attention due to their high power density, rapid charge/discharge capacity, long life cycle, and excellent stability.1–3 Generally, supercapacitors can be classified into two major types based on the working mechanism: pseudocapacitors and electrical double-layer capacitors (EDLCs). Different from pseudocapacitors, which depend on reversible faradaic reactions occurring at the surface of the electrode materials, EDLCs store electrical energy by electrostatic accumulation of charges in the electric double-layer near the electrode/electrolyte interfaces.4 Likewise, transition metal oxides, hydroxides and their compounds are used as electrode materials for pseudocapacitors,5–7 while carbon materials are suitable for EDLCs electrodes. Although pseudocapacitors possess high specific capacitance and energy density, the low conductivity of the electrode materials, poor rate capability, and high cost greatly restrict their applications.8 In contrast, carbon materials exhibit excellent conductivity and high physicochemical properties with low cost, leading to superior rate capability and long life cycle for EDLCs.So far, carbon materials used for EDLCs electrodes included carbon nanotubes, activated carbon, graphene and carbon fibers.9–12 Of these materials, activated carbon is considered a promising candidate for EDLCs electrode material owing to high specific surface area (SSA), large porosity, and excellent conductivity; factors that are important for EDLCs performance. Activated carbon are typically prepared via physical or chemical activation to produce porous structure with high SSA and wide pore size distribution (micropore, mesopore, and macropores). It is believed that high SSA will provide enough contact area between the electrodes and electrolyte, while pores with different sizes will serve as ion channels and reservoirs of electrolyte to shorten the ion diffusion distance. Both of these factors contribute to capacitance performance.13 However, the capacitance performance of activated carbon based electrodes is still limited and higher specific capacitance is greatly desired.
In recent years, introducing heteroatoms (P, N and B) into activated carbon was found to be efficient to improve EDLCs performance because of the induced pseudo-capacitance via reversible redox reaction and the improved wettability.14–16 In particular, N-doped carbon materials have received considerable attention and a variety of methods were explored to introduce nitrogen. Although carbonizing biomass that contains nitrogen appeared an efficient approach to achieving N-doped carbon, low-cost N-containing biomass species are very limited and the N concentration is low after pyrolysis. Alternatively, using N-rich chemicals to modify low-cost biomass becomes more attractive to preparing N-doped porous carbon via combined pyrolytic chemical activation.
In this work, N-rich aniline was used to modify fungus and the modified raw material was subsequently activated by KOH to obtain N-doped porous carbon. The activated porous carbon exhibited high SSA and desired porosity suitable for EDLC electrode materials. The performance of supercapacitors prepared with the N-doped porous carbon is reported.
2. Experimental
2.1 Preparation of activated carbon
Fungus (3 g), aniline (1.5 mL) and 30 mL ethanol were added into a flask with 30 mL ethanol, followed by stirring at 80 °C until the ethanol was evaporated. Then the mixture was heated at 400 °C for one hour with a heating rate of 10 °C min−1 for 1 h in a muffle furnace (1100 box furnace, Lindberg/Blue M, Thermo Scientific Inc.) under the protection of nitrogen (flow rate was 96 mL min−1). After the precarbonized material was cooled to room temperature, it was mixed with potassium hydroxide (KOH, Fisher Scientific Inc.) in a mass ratio of 1![[thin space (1/6-em)]](https://www.rsc.org/images/entities/char_2009.gif) :
:![[thin space (1/6-em)]](https://www.rsc.org/images/entities/char_2009.gif) 3, in a steel crucible also containing 30 mL deionized water. The crucible was placed in an oven and dried at 110 °C for 24 h. Then, the crucible was transferred into a muffle and activated at 800 °C for 1 h with a heating rate of 10 °C min−1 under N2 protection (flow rate was 96 mL min−1). Afterwards, the carbonized solids were washed with 30 mL 0.1 mol L−1 HCl (Fisher Scientific Inc.) at 110 °C for 1 h in a 60 mL polytetrafluoroethylene (PTFE) autoclave to remove the residual KOH and impurities. Finally, the carbon solids was washed several times with deionized water until the pH stabilized at 7. The material was then dried at 105 °C overnight in an oven. The carbonized samples were denoted as N–AC. Raw fungus and dried mixture of fungus and aniline were carbonized following the same procedures of N–AC preparation but in the absence of KOH, the products were donated as C and N–C, respectively.
3, in a steel crucible also containing 30 mL deionized water. The crucible was placed in an oven and dried at 110 °C for 24 h. Then, the crucible was transferred into a muffle and activated at 800 °C for 1 h with a heating rate of 10 °C min−1 under N2 protection (flow rate was 96 mL min−1). Afterwards, the carbonized solids were washed with 30 mL 0.1 mol L−1 HCl (Fisher Scientific Inc.) at 110 °C for 1 h in a 60 mL polytetrafluoroethylene (PTFE) autoclave to remove the residual KOH and impurities. Finally, the carbon solids was washed several times with deionized water until the pH stabilized at 7. The material was then dried at 105 °C overnight in an oven. The carbonized samples were denoted as N–AC. Raw fungus and dried mixture of fungus and aniline were carbonized following the same procedures of N–AC preparation but in the absence of KOH, the products were donated as C and N–C, respectively.
2.2 Preparation of electrodes
Electrodes were prepared by mixing the prepared carbon samples C, N–C and N–AC (80 wt%) with acetylene black (10 wt%) and PTFE (10 wt%), and then pressing onto a surface area of 1 cm2 nickel foam (EQ-bcnf-16m, MTI Corp.). The electrodes were dried at 60 °C for 12 h in an oven. Afterwards, a sandwich structure was formed by placing two pieces of microporous PP separator celgard-3501 between two electrodes in a coin cell 2032 type system. Finally, the cell was pressed under a pressure of 1000 kg cm−2 to finish the assembly.2.3 Physical characterization
X-ray photoelectron spectroscopy (XPS) was performed on an SSX-100 system (Surface Science Laboratories, Inc.) equipped with a monochromated Al Kα X-ray source. For high resolution data, the lowest binding-energy C 1s peak was set at 285.0 eV and used as the reference for all of the other elements. Raman spectra were obtained on a Horiba LABRam confocal Raman microscopean with excitation wavelength of 532 nm from a diode pumped solidstate laser. Isothermal adsorption analyses with N2 were carried out at 77 K (liquid nitrogen bath), using ASAP2020 Micropore analyzer. The specific surface area was determined by the Brunauer–Emmett–Teller (BET) method and the pore size distribution was calculated according to the density functional theory (DFT) method using NLDFT analysis for carbon with slit pore model. Elemental analysis was conducted using Perkin Elmer 2400 II for C, H and N analysis and LECO Tru Spec Micro was used to analyze O with oxygen module. A transmission electron microscope (TEM) (JEM-2100 LaB6, JEOL) equipped with energy-dispersive X-ray spectroscopy (EDX) was used to study the morphology and microstructure of the materials at an acceleration voltage of 200 kV.2.4 Electrochemical characterization
Cyclic voltammetry (CV) and electrochemical impedance spectroscopy tests were measured on an electrochemical working station (SP-150, BioLogical, France) in 6 mol L−1 KOH electrolyte. The galvanostatic charge/discharge curves were obtained from a battery test system (BTS series, NEWARE, China).3. Results and discussion
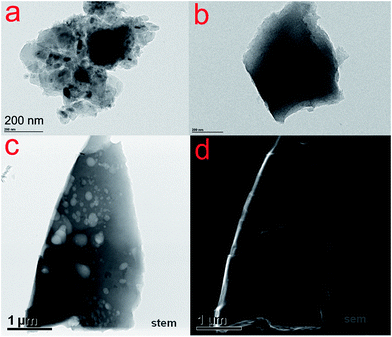
Fig. 1a and b show TEM images of C and N–C, respectively. The C and N–C samples displayed chunk shape without pores. On the other hand, the N–AC sample exhibited a lot of pores with diverse sizes as observed in STEM and SEM image of N–AC (Fig. 1c and d). The porous structure could also be observed in a tomography video (see ESI†). Such a significant difference was attributed to KOH activation since this was the only difference in preparing the materials. As reported by Kaskel,17 etching, gasification and K intercalation were responsible for pore formation, porosity perfection and lattice expansion during the activation process, respectively. Therefore, both chemical activation and physical activation were involved in creating the porous structure, leading to high SSA and porosity of N–AC.To evaluate the surface area and pore structure of N–AC, N2 sorption–desorption isotherm was conducted (Fig. 2a). High SSA of 2339 m2 g−1 was obtained for N–AC, which offered large contact surface area between the electrodes and electrolyte. In addition, the pore size distribution suggested that the pore sizes centered at 27 nm and 34 nm with some micropores and macropores, which would serve as reservoirs and channels for the electrolyte.13 Eventually, these features were expected to improve the capacitance. Raman spectra of C, N–C and N–AC was employed to further characterize the carbon structure. As presented in Fig. 2b, two characteristic peaks located at ∼1346 and 1580 cm−1 were revealed, which was assigned to D-band and G-band, respectively. The D-band reflected degree of disordered graphite with A1g symmetry, while G-band was associated E2g mode of sp2 carbon domains.18 Meanwhile, the intensity of ratio between D-band and G-band represented the degree of graphitization, lower value indicated higher graphitization. Same ratio value of 0.96 was obtained for all the three samples, implying that they had similar degree of graphitization, which could be attributed to the same carbonization temperature (800 °C) and process time.
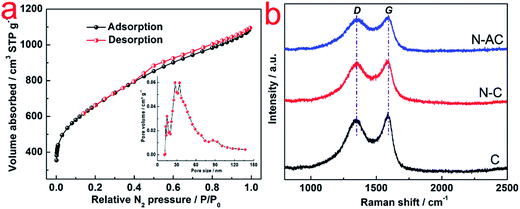 | ||
| Fig. 2 (a) N2 sorption–desorption isotherms of N–AC. The insert in (a) shows pore size distribution of N–AC; (b) Raman spectra of C, N–C and N–AC. | ||
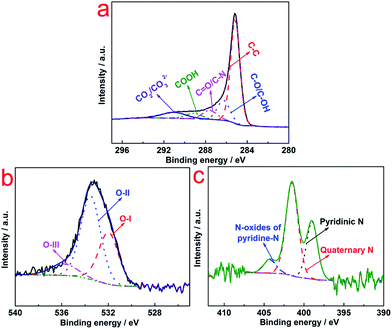
XPS was conducted to investigate the chemical state of N–AC (Fig. 3). Deconvolution of the C 1s spectra (Fig. 3a) showed the most pronounced peak being graphite-like carbon (C–C) at 285 eV and oxygen-containing groups located at different binding energy e.g., C–O/C–OH (∼286 eV), C![[double bond, length as m-dash]](https://www.rsc.org/images/entities/char_e001.gif) O (∼287 eV), COOH (∼289 eV), and CO2/CO32− (∼291 eV).19 These surface functional groups improved the hydrophilic nature of the N–AC and resulted in easy access of the electrolyte to the internal walls of the pores. In high resolution spectrum of O 1s, three types of O species located at 531 eV, 532 eV, and 535 eV, respectively, were detected (Fig. 3b), which were associated with C
O (∼287 eV), COOH (∼289 eV), and CO2/CO32− (∼291 eV).19 These surface functional groups improved the hydrophilic nature of the N–AC and resulted in easy access of the electrolyte to the internal walls of the pores. In high resolution spectrum of O 1s, three types of O species located at 531 eV, 532 eV, and 535 eV, respectively, were detected (Fig. 3b), which were associated with C![[double bond, length as m-dash]](https://www.rsc.org/images/entities/char_e001.gif) O groups (carbonyl/quinone), carbonyl oxygen atoms (phenol/ether) and oxygen atoms (carboxylic groups COOH and/or chemisorbed O2/H2O), respectively.20 This result was consistent with C 1s analysis that these functional groups could improve the wettability of N–AC electrodes and provided more accessible surface for aqueous electrolyte and eventually led to enhanced capacitance. In addition, high resolution spectrum of N 1s was deconvoluted into three peaks at ∼399, 401 and 404 eV (Fig. 3c), which could be attributed to quaternary-N, pyridinic-N and N oxides of pyridinic-N, respectively. It was reported that pseudocapacitance behavior between the ions of electrolytes and the carbon electrode surface could be induced by pyridinic-N,21 which contributed to capacitance performance.
O groups (carbonyl/quinone), carbonyl oxygen atoms (phenol/ether) and oxygen atoms (carboxylic groups COOH and/or chemisorbed O2/H2O), respectively.20 This result was consistent with C 1s analysis that these functional groups could improve the wettability of N–AC electrodes and provided more accessible surface for aqueous electrolyte and eventually led to enhanced capacitance. In addition, high resolution spectrum of N 1s was deconvoluted into three peaks at ∼399, 401 and 404 eV (Fig. 3c), which could be attributed to quaternary-N, pyridinic-N and N oxides of pyridinic-N, respectively. It was reported that pseudocapacitance behavior between the ions of electrolytes and the carbon electrode surface could be induced by pyridinic-N,21 which contributed to capacitance performance.
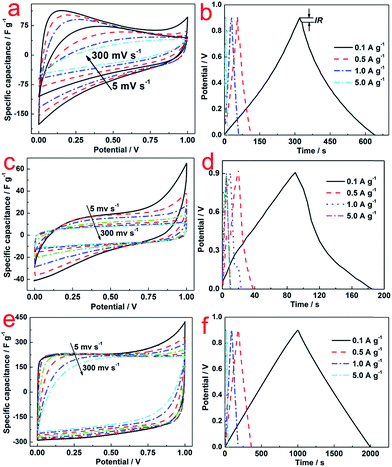
Fig. 4 illustrates the CV curves of C (a), N–C (c) and N–AC (e) electrodes at various scanning rates ranging from 5 to 300 mV s−1 to access the specific capacitance. Distorted rectangular shapes were observed for both C and N–C electrodes, which were significantly different from a typical rectangular shape with a big loop that the N–AC electrodes exhibited. These results indicated that N–AC electrodes possessed better capacitive behavior and higher specific capacitance. In addition, almost no distortion was observed for N–AC electrodes in contrast to the C and N–C electrodes even at increased scanning rates. This result implied efficient charge transfer and electrolyte diffusion in the porous N–AC.22 Moreover, to accurately evaluate the specific capacitance, the following equation23 was used:
 | (1) |
Nyquist plots obtained from KPF electrodes in 6 mol L−1 KOH electrolyte are shown in Fig. 5a. Typically, the resistance (3.0 Ω) consisted of bulk electrolyte resistance (0.8 Ω), interfacial impedance and intra-particle impedance (1.0 Ω), which corresponded to x-intercept at the highest frequency region (R1), semicircle at the mid-frequency region (R2), and the spike at the low-frequency region (R3).25 Among these three types of resistance, R1 and R2 were related to the electrolyte solution, and R3 was associated with intra-particle pores. This was in consistence with the porous structure, high SSA and good conductivity.25
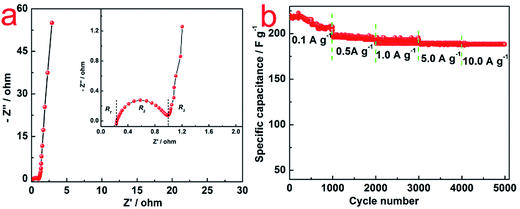 | ||
| Fig. 5 (a) Nyquist plots of N–AC electrodes; (b) cycle life of N–AC electrodes in 6 mol L−1 KOH electrolyte at different current density ranging from 0.1 to 10 A g−1. | ||
Rate capability is an important feature of EDLCs. Cycle life of N–AC electrode was recorded with 6 mol L−1 KOH electrolyte at different current density ranging from 0.1 to 10 A g−1. As shown in Fig. 5b, specific capacitance of 218, 196, 192, 190 and 190 F g−1 were obtained at current density of 0.1, 0.5, 1.0, 5.0 and 10.0 A g−1 for 5000 cycles, respectively. The specific capacitance of N–AC during the cycling kept almost 100% with only a little bit fluctuation in the initial 1000 cycles, indicating excellent stability and long life time of N–AC electrode materials.
4. Conclusions
N-doped porous carbon derived from aniline modified fungus has been prepared via efficient KOH activation. Porous structure with high SSA of 2339 m2 g−1, good conductivity, and N doping could be obtained as a result of combined physical and chemical effect during the pyrolysis, which subsequently facilitated capacitance improvement. The N-doped active carbon exhibited high specific capacitance of 218 and 190 F g−1 at low and high current density of 0.1 and 10.0 A g−1 in 6 mol L−1 KOH solution, respectively. Moreover, superior stability was demonstrated with 5000 charge–discharge cycles at different current densities for assembled EDLCs.Acknowledgements
This research was funded by the following projects: (1) China Scholarship Council; (2) NSF award #1462389; (3) NSF award #1536209; (4) North Central Regional Sun Grant Center at South Dakota State University through a grant provided by the US Department of Energy Bioenergy Technologies Office under award number DE-FG36-08GO88073.References
- C. Zheng, X. Zhou, H. Cao, G. Wang and Z. Liu, J. Power Sources, 2014, 258, 290–296 CrossRef CAS.
- S. Chen, J. Duan, Y. Tang and S. Zhang Qiao, Chem. Eur. J., 2013, 19, 7118–7124 CrossRef CAS PubMed.
- W. Li, F. Zhang, Y. Dou, Z. Wu, H. Liu, X. Qian, D. Gu, Y. Xia, B. Tu and D. Zhao, Adv. Energy Mater., 2011, 1, 382–386 CrossRef CAS.
- S. Sarangapani, B. Tilak and C. P. Chen, J. Electrochem. Soc., 1996, 143, 3791–3799 CrossRef CAS.
- J. Li, W. Zhao, F. Huang, A. Manivannan and N. Wu, Nanoscale, 2011, 3, 5103–5109 RSC.
- S.-I. Kim, J.-S. Lee, H.-J. Ahn, H.-K. Song and J.-H. Jang, ACS Appl. Mater. Inter., 2013, 5, 1596–1603 CrossRef CAS PubMed.
- B. Jiang, L. Zhao, J. Guo, X. Yan, D. Ding, C. Zhu, Y. Huang and Z. Guo, J. Nanopart. Res., 2016, 18, 1–11 CrossRef CAS.
- L. Huang, D. Chen, Y. Ding, S. Feng, Z. L. Wang and M. Liu, Nano Lett., 2013, 13, 3135–3139 CrossRef CAS PubMed.
- P. Simon and Y. Gogotsi, Nature Mater., 2008, 7, 845–854 CrossRef CAS PubMed.
- K. Wang, Y. Cao, X. Wang, Q. Fan, W. Gibbons, T. Johnson, B. Luo and Z. Gu, Energy, 2016, 94, 666–671 CrossRef CAS.
- K. Wang, L. Li, T. Zhang and Z. Liu, Energy, 2014, 70, 612–617 CrossRef CAS.
- X. Chen, H. Wang, H. Yi, X. Wang, X. Yan and Z. Guo, J. Phys. Chem. C, 2014, 118, 8262–8270 CAS.
- B. Li, F. Dai, Q. Xiao, L. Yang, J. Shen, C. Zhang and M. Cai, Energy Environ. Sci., 2016, 9, 102–106 CAS.
- B. You, L. Wang, L. Yao and J. Yang, Chem. Commun., 2013, 49, 5016–5018 RSC.
- Z. S. Wu, K. Parvez, A. Winter, H. Vieker, X. Liu, S. Han, A. Turchanin, X. Feng and K. Müllen, Adv. Mater., 2014, 26, 4552–4558 CrossRef CAS PubMed.
- U. B. Nasini, V. G. Bairi, S. K. Ramasahayam, S. E. Bourdo, T. Viswanathan and A. U. Shaikh, J. Power Sources, 2014, 250, 257–265 CrossRef CAS.
- J. Wang and S. Kaskel, J. Mater. Chem., 2012, 22, 23710–23725 RSC.
- J. Qi, L. Jiang, S. Wang and G. Sun, Appl. Catal. B: Environ., 2011, 107, 95–103 CrossRef CAS.
- J. D. Ding, Y. F. Diao and H. G. Shen, Adv. Mater. Res., 2011, 156, 1211–1214 Search PubMed.
- C. Wang, L. Sun, Y. Zhou, P. Wan, X. Zhang and J. Qiu, Carbon, 2013, 59, 537–546 CrossRef CAS.
- W. Si, J. Zhou, S. Zhang, S. Li, W. Xing and S. Zhuo, Electrochim. Acta, 2013, 107, 397–405 CrossRef CAS.
- Y. Fan, X. Yang, B. Zhu, P.-F. Liu and H.-T. Lu, J. Power Sources, 2014, 268, 584–590 CrossRef CAS.
- W. Wang, Q. Hao, W. Lei, X. Xia and X. Wang, J. Power Sources, 2014, 269, 250–259 CrossRef CAS.
- Q. Wu, Y. Xu, Z. Yao, A. Liu and G. Shi, ACS Nano, 2010, 4, 1963–1970 CrossRef CAS PubMed.
- H. D. Yoo, J. H. Jang, J. H. Ryu, Y. Park and S. M. Oh, J. Power Sources, 2014, 267, 411–420 CrossRef CAS.
Footnote |
| † Electronic supplementary information (ESI) available. See DOI: 10.1039/c6ra27600h |
| This journal is © The Royal Society of Chemistry 2017 |

