DOI:
10.1039/C6RA27865E
(Paper)
RSC Adv., 2017,
7, 8220-8229
Preparation of a polyvinylidene fluoride tree-like nanofiber mat loaded with manganese dioxide for highly efficient lead adsorption
Received
7th December 2016
, Accepted 20th January 2017
First published on 23rd January 2017
Abstract
A novel polyvinylidene fluoride/tetrabutylammonium chloride (PVDF/TBAC) tree-like nanofiber mat loaded with manganese dioxide (MnO2) as a highly efficient lead adsorbent was successfully fabricated. The adsorbent was prepared by in situ polymerization of pyrrole monomer on the surface of the PVDF/TBAC tree-like nanofiber mat, and subsequently reacted with KMnO4 solution to deposit MnO2. The morphology and structure of the as-prepared adsorbent were measured by field emission scanning electron microscopy (FE-SEM) and the tree-like structures can be clearly seen from the FE-SEM images. Fourier transform infrared spectroscopy (FT-IR) results confirmed the presence of PPy and MnO2 layers on the surface of PVDF/TBAC tree-like nanofibers. Thermo-gravimetric analysis (TGA) results exhibited that MnO2 accounted for about 43.27% in the PVDF/TBAC–polypyrrole–MnO2 (PVDF/TBAC–PPy–MnO2) nanofiber mat. The kinetics of Pb2+ adsorption was found to follow a pseudo-second-order rate model. The adsorption isotherms were fitted best with the Langmuir isotherm model. The thermodynamic analysis confirmed that the adsorption process was endothermic and spontaneous. The regeneration experiments showed that the obtained tree-like PVDF/TBAC–PPy–MnO2 nanofiber mat also exhibited high recyclable removal efficiency. XPS analysis showed that ion exchange was the main mechanism for Pb2+ adsorption.
1. Introduction
Recently, heavy metal contamination in wastewater with the rapid increase in global industrial activities has received considerable attention due to the high toxicity and non-biodegradability of the heavy metal ions.1–3 Pb2+ is one of the most common heavy metal ions in polluted water bodies due to its widespread use in industry, especially in battery manufacturing and metal plating.4,5 Besides, it is one of the most toxic heavy metal ions to humans due to its accumulation in the bone, brain, kidney and liver, which may cause many serious diseases.6,7 Hence, it is essential to remove Pb2+ from drinking water or lower the concentration of Pb2+.
Various techniques have been used for this aim, including chemical precipitation,8,9 chemical reduction,10 ion exchange,11,12 membrane separation,13 ultrafiltration,14 biological treatment,15 and adsorption, etc.16–18 Among them, adsorption is an effective and versatile method that is capable of removing trace levels of heavy metal ions from dilute solutions.
Currently, nano-sized metal oxide adsorbents were used for the removal of heavy metal ions, including nanoparticles of ferric oxides (Fe2O3),3,19,20 aluminium oxides (Al2O3),21 cerium oxides (CeO2),22 zinc oxides (ZnO)23 and manganese oxides (MnO2).24–26 MnO2 with advantages of high adsorption capacity and selectivity, have recently been receiving considerable attention.25–27 However, owing to the high surface energy, nano-sized MnO2 particles are inclined to agglomerate during the adsorption process which limits their practical application.28 In addition, the separation of nano-sized MnO2 particles from solutions is still a challenging issue. To solve these problems, nano-sized MnO2 particles can be loaded on supports. Brandão et al.29 first fabricated a new composite material, cellulose acetate-supported MnO2 particles (CA-MnO2), which exhibited excellent Pb2+ adsorption performance. As an increasingly popular nanofabrication technique, electrospinning has emerged as a versatile and effective method for manufacturing long continuous fibers with diameters ranging from several micrometers down to a few nanometers.30,31 Owing to the large specific surface area, electrospun nanofibers become promising candidates for the load of MnO2. As we all know, polyvinylidene fluoride (PVDF) is a material with extraordinary properties including easy mouldability, good toughness, flexibility, durability, excellent chemical and thermal resistance.32,33 Through physical or chemical modification, electrospun PVDF nanofibers can be used in the application of heavy metal ions adsorption.34–37 As reported by the literatures, polypyrrole (PPy) was widely used to reduce high valence of Mn compounds to prepare MnO2.38,39 However, the uniform coating of PPy by in situ polymerization of pyrrole monomer usually occurred on the surface of polymer nanofiber with hydrophilicity.27 Therefore, it was difficult to homogeneously load MnO2 on the surface of PVDF nanofibers due to its hydrophobicity. In our previous work, a novel PVDF/TBAC tree-like nanofiber mat was fabricated via one-step electrospinning for the first time.40 The addition of TBAC significantly enhanced the hydrophilicity of the PVDF/TBAC tree-like nanofiber mat.41 Meanwhile, the emergency of the tree-like branch fibers dramatically increased the specific surface area of nanofiber mat.42 Therefore, the PVDF/TBAC tree-like nanofiber mats are promising supports for the loading of MnO2.
In this contribution, polyvinylidene fluoride/tetrabutylammonium chloride (PVDF/TBAC) tree-like nanofiber mat loading MnO2 as highly efficient lead adsorbent was designed by in situ polymerization of pyrrole monomer, and subsequently reacted with KMnO4 solution to deposit MnO2. The obtained PVDF/TBAC–PPy–MnO2 adsorbents were characterized, and their adsorption properties for removal of Pb2+ from aqueous solution under varied experimental conditions were also investigated. The adsorption kinetics, adsorption isotherm, adsorption thermodynamic, competitive adsorption and reusability of PVDF/TBAC–PPy–MnO2 adsorbent were further studied.
2. Experimental
2.1. Materials
PVDF (Mw = 520![[thin space (1/6-em)]](https://www.rsc.org/images/entities/char_2009.gif) 000) was purchased from Shanghai 3F New Materials Co., Ltd., China. TBAC was purchased from Aladdin Co., Ltd., China. N,N-Dimethylformamide (DMF), acetone, pyrrole, potassium permanganate (KMnO4), NaOH, manganese sulfate (MnSO4), iron(III) chloride hexahydrate (FeCl3·6H2O), lead nitrate [Pb(NO3)2], copper nitrate [Cu(NO3)2] and cadmium nitrate [Cd(NO3)2] were purchased from Tianjin Kermel Co., Ltd., China. All of the materials were used as received without further purification.
000) was purchased from Shanghai 3F New Materials Co., Ltd., China. TBAC was purchased from Aladdin Co., Ltd., China. N,N-Dimethylformamide (DMF), acetone, pyrrole, potassium permanganate (KMnO4), NaOH, manganese sulfate (MnSO4), iron(III) chloride hexahydrate (FeCl3·6H2O), lead nitrate [Pb(NO3)2], copper nitrate [Cu(NO3)2] and cadmium nitrate [Cd(NO3)2] were purchased from Tianjin Kermel Co., Ltd., China. All of the materials were used as received without further purification.
2.2. Preparation of tree-like nanofiber mat
The PVDF/TBAC tree-like nanofiber mat was fabricated by adding certain amount of TBAC into PVDF solution via one-step electrospinning. The exhaustive methods were reported in our published paper.40 The in situ polymerization of pyrrole monomer and redox reaction between the PPy and MnO4− was reported by Wang.27,43 Typically, 1.3 g FeCl3·6H2O was firstly dissolved in 30 mL deionized water and then a piece of PVDF/TBAC tree-like nanofiber mat was added into the solution. 3.2 g pyrrole was dissolved in 100 mL of deionized water. The polymerization was started by mixing the two solutions together. The mixed reaction solution was shaken in a thermostatic shaker bath, operating at 25 °C and 100 rpm for 2 h. Then the PVDF/TBAC–PPy nanofiber mat was taken out, and subsequently added to a 250 mL round bottomed flask which contains 100 mL of KMnO4 solutions. The KMnO4 concentrations were 0.01, 0.05, 0.10 and 0.15 mol L−1, respectively. The reaction solution was shaken in a thermostatic shaker bath, operating at 25 °C and 100 rpm for 10 h. MnO2 was spontaneously deposited onto the surface of PVDF/TBAC–PPy nanofiber through a direct redox reaction between the PPy and MnO4−. Finally, the PVDF/TBAC–PPy–MnO2 nanofiber mat was taken out, washed with deionized water repeatedly to remove MnO2 particles, and then dried in vacuum overnight. As a control, the common PVDF–PPy–MnO2 nanofiber mat was prepared by the same process. Meanwhile, the PVDF–MnO2 and PVDF/TBAC–MnO2 nanofiber mats were prepared as the control samples. The exhaustive processes were as follows. A piece of nanofiber mat was added into 50 mL KMnO4 solution (70 °C, 0.1 M) solution and then NaOH solution (0.5 M) and MnSO4 solution (0.5 M) were added drop-wise to the KMnO4 solution using two separate burettes until a brown precipitate formed. The reaction solution was stirred at 100 rpm by using a heater/magnetic stirrer at 70 °C. Finally, the PVDF–MnO2 and PVDF/TBAC–MnO2 nanofiber mats were taken out, washed with deionized water repeatedly to remove MnO2 particles, and then dried in vacuum overnight.
2.3. Adsorption experiments
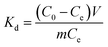
Pb(NO3)2 was used as the source of Pb2+, 10 mg dry PVDF/TBAC–PPy–MnO2 nanofiber mat was directly added into a beaker containing 30 mL 100 mg L−1 Pb2+ solutions with pH value of 6.0 for 24 h. During this process, the beaker was shaken in a thermostatic shaker bath, operating at 25 °C and 100 rpm. 0.1 M HNO3 and 0.1 M NaOH were used to adjust the pH value of the Pb2+ solution. The removal percentage of Pb2+ can be calculated by the following equation:| |
 | (1) |
where C0 is the initial concentration of Pb2+ in solution (mg L−1) and Ce is the equilibrium concentration (mg L−1).
The adsorption isotherms for Pb2+ were established by batch adsorption experiments. 10 mg dry PVDF/TBAC–PPy–MnO2 nanofiber mat was immersed into 30 mL Pb2+ solutions with different initial concentrations ranging from 50 mg L−1 to 250 mg L−1. The initial pH value of the Pb2+ solution was adjusted to 6.0. The solution was shaken in a thermostatic shaker bath at different temperature (25 °C, 35 °C and 45 °C) for 24 h to establish adsorption equilibrium. The equilibrium adsorption amount was calculated by the following equation:
| |
 | (2) |
where
qe is the equilibrium adsorption amount (mg L
−1),
C0 is the initial concentration of Pb
2+ in solution (mg L
−1),
Ce is the equilibrium concentration (mg L
−1),
m is the mass of adsorbent (g), and
V is the volume of solution (L).
The kinetic adsorption performance was studied by adding 10 mg of PVDF/TBAC–PPy–MnO2 nanofiber mat into Pb2+ solutions of different initial concentrations. The initial pH value of the Pb2+ solution is 6.0. The adsorption was carried out with constant shaking at 25 °C. Samples were taken out of the solution at different time, each time 50 μL. The adsorption amount was calculated by the following equation:
| |
 | (3) |
where
qt is the adsorption amount at time
t (mg L
−1),
C0 is the initial concentration of Pb
2+ in solution (mg L
−1),
Ct is the Pb
2+ concentration at time
t (mg L
−1),
m is the mass of adsorbent (g), and
V is the volume of solution (L).
2.4. Desorption experiment
Reusability is one of the important aspects for the practical application of the adsorbent. In order to study the reusability of the adsorbents, 10 mg dry PVDF/TBAC–PPy–MnO2 nanofiber mat was first contacted with 30 mL 100 mg L−1 Pb2+ solution for 24 h at 25 °C to reach adsorption equilibrium. The adsorbents were immersed into 50 mL 0.05 M, 0.10 M, 0.20 M, 0.30 M and 0.50 M HCl solution for 5 h at 25 °C, respectively, and then washed thoroughly with deionized water for using in next cycle of adsorption. The above procedure was repeated for 5 times to test the reusability of the adsorbents.
2.5. Characterization
The morphology of nanofiber mats was observed by field emission scanning electron microscopy (FE-SEM) (S-4800, Hitachi Ltd., Japan). The structural information of nanofiber was characterized by Fourier transform infrared spectroscopy (FT-IR) (TENSOR37, BRUKER, Germany). The Thermo-gravimetric analysis (TGA) (NETZSCH, Germany) for temperatures ranging from 30 to 900 °C was performed at a heating rate of 10 °C min−1 and an air flow of 60 mL min−1. The adsorption mechanism was studied by X-ray photoelectron spectroscopy (XPS) (ThermoFisher K-alpha, England). Ions concentration was measured with an inductively coupled plasma mass spectrometry (Varian 715-ES, USA).
3. Results and discussions
3.1. Characterization of the PVDF/TBAC–PPy–MnO2 nanofiber mat
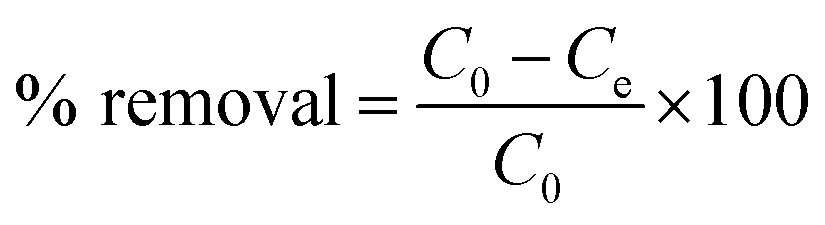
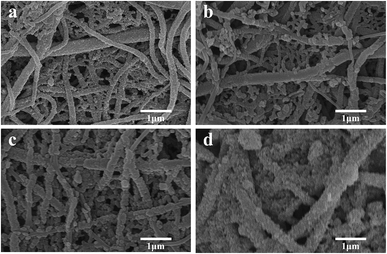
The FE-SEM images of the pure PVDF, PVDF–PPy, PVDF–PPy–MnO2, PVDF–MnO2, PVDF/TBAC, PVDF/TBAC–PPy, PVDF/TBAC–PPy–MnO2 and PVDF/TBAC–MnO2 nanofiber mat were shown in Fig. 1. It was clear that the surface of the pure PVDF nanofiber and PVDF/TBAC tree-like nanofiber became much coarser after the coating of PPy and MnO2. It was worth noting that the hydrophilicity of nanofiber mat reduced after coating with PPy, whereas significantly enhanced after the coating of MnO2. Meanwhile, the tree-like branch fibers provided larger specific surface area for the coating of PPy and MnO2, which was beneficial for the adsorption performance of nanofiber mat. In addition, due to the hydrophobicity of pure PVDF nanofiber mat, PPy couldn't be uniformly coated on the surface of PVDF nanofiber, which led to the lower MnO2 loading amount. For the PVDF–MnO2 and PVDF/TBAC–MnO2 nanofiber mat, a large area of MnO2 agglomerate could be observed and the MnO2 couldn't be homogeneously coated on the surface of nanofiber.
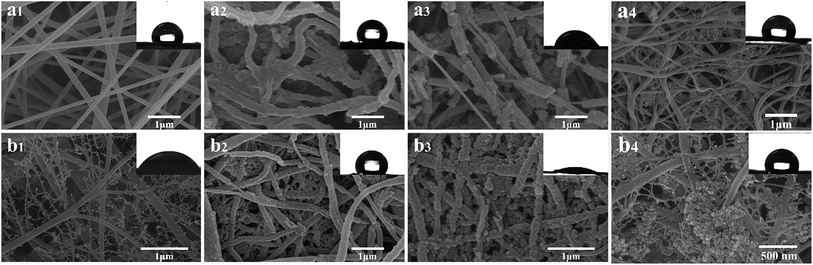 |
| | Fig. 1 FE-SEM images of (a1) PVDF, (a2) PVDF–PPy, (a3) PVDF–PPy–MnO2, (a4) PVDF–MnO2, (b1) PVDF/TBAC, (b2) PVDF/TBAC–PPy, (b3) PVDF/TBAC–PPy–MnO2 and (b4) PVDF/TBAC–MnO2 nanofiber mat (insert: contact angle of nanofiber mat). | |
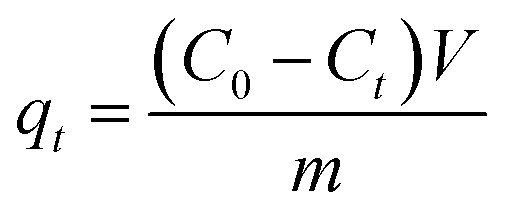
Fig. 2 shows the FT-IR spectroscopy results for the PVDF/TBAC, PVDF/TBAC–PPy, PVDF/TBAC–PPy–MnO2 and PVDF/TBAC–MnO2 nanofiber mats. By comparing the spectrums of PVDF/TBAC and PVDF/TBAC–PPy nanofiber mats, the new band at 1534 cm−1 was assigned to the pyrrole ring vibration. The bands located at 1124 cm−1 was ascribed to the C–N stretching vibrations. The new peaks at 958 and 896 were attributed to C–H stretching vibrations and C–H deformations, respectively.44 In the spectrum of PVDF/TBAC–PPy–MnO2 nanofiber mat, a new broad band at 1628 cm−1 and 3401 cm−1 was corresponded to the stretching vibrations of –OH, which indicate that MnO2 was coated on the surface of PVDF/TBAC–PPy nanofiber mat, and in the presence of MnOOH.27 In the spectra of PVDF/TBAC–PPy–MnO2 and PVDF/TBAC–MnO2 nanofiber mats, the expected characteristic absorption peaks of Mn–O at 450 cm−1, 520 cm−1 and 720 cm−1 did not emerge because of the amorphous state of MnO2, which was consistent with other researches.26
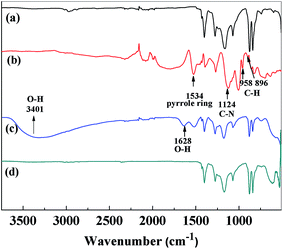 |
| | Fig. 2 FT-IR spectra of (a) PVDF/TBAC, (b) PVDF/TBAC–PPy, (c) PVDF/TBAC–PPy–MnO2 and (d) PVDF/TBAC–MnO2 nanofiber mat. | |
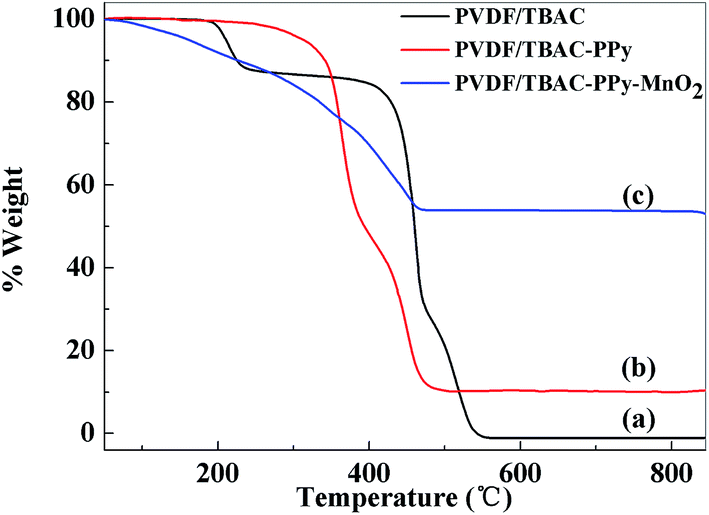
The thermal stabilities of PVDF/TBAC, PVDF/TBAC–PPy and PVDF/TBAC–PPy–MnO2 nanofiber mats were studied by TGA, and the results were shown in Fig. 3. It was clear that degradations of the three materials finished (almost 0, 10.30% and 53.57% remained) at around 550, 480 and 500 °C for PVDF/TBAC, PVDF/TBAC–PPy and PVDF/TBAC–PPy–MnO2 nanofiber mat, respectively. In PVDF/TBAC–PPy nanofiber mat, the residues were the catalyst particles and impurities came from the preparation of PVDF/TBAC–PPy nanofiber mat.27 According to researches, MnO2 particles were stable up to 800 °C. Therefore, the loading amount of MnO2 in PVDF/TBAC–PPy–MnO2 nanofiber mat can be estimated to be about 43.27%.
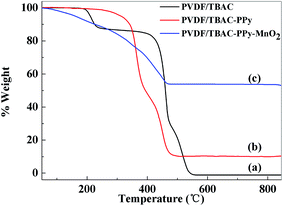 |
| | Fig. 3 Thermo-gravimetric curves for (a) PVDF/TBAC, (b) PVDF/TBAC–PPy and (c) PVDF/TBAC–PPy–MnO2 nanofiber mat. | |
3.2. Adsorption study
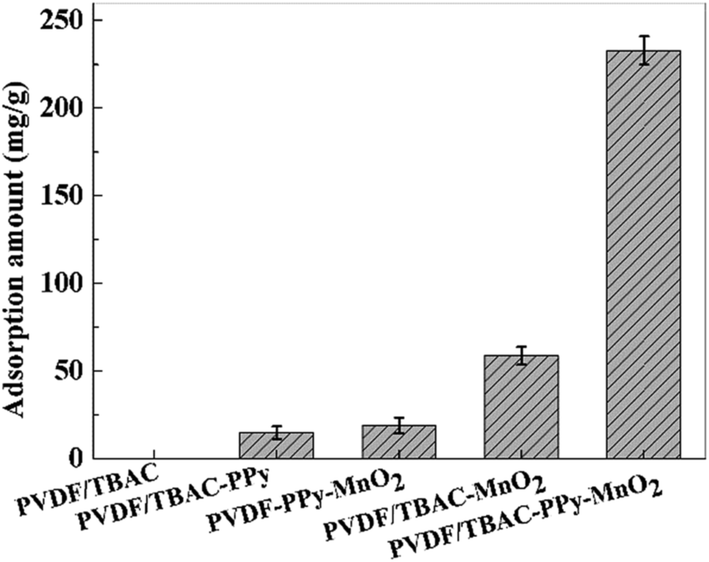
3.2.1. Effect of MnO2 loading ratios. To show the superiority of PVDF/TBAC–PPy–MnO2 nanofiber mat on Pb2+ removal, contrast tests were done between PVDF/TBAC, PVDF/TBAC–PPy, PVDF–PPy–MnO2, PVDF/TBAC–MnO2 and PVDF/TBAC–PPy–MnO2 nanofiber mats, and the results were shown in Fig. 4. It was clear to see that the Pb2+ adsorption amount of PVDF/TBAC–PPy–MnO2 nanofiber mat was significantly higher than that of other adsorbents. This was caused by the fact that the tree-like branch fibers could offer large specific surface area for the loading of MnO2. Meanwhile, the improvement of the hydrophilicity caused by the addition of TBAC enabled the PPy to uniform load on the surface of nanofiber, and then promoted the uniform loading of MnO2. The combination of both gave the PVDF/TBAC–PPy–MnO2 nanofiber mat excellent Pb2+ adsorption performance. However, the PVDF–PPy–MnO2 nanofiber mat showed lower Pb2+ adsorption amount due to the less MnO2 loading amounts caused by its poor hydrophilicity (Fig. 1). According to literature research, the chemical mechanism for the adsorption of polypyrrole (PPy) to metal ions included two steps. Firstly, the N atoms in the PPy chains could be partly changed to N+ after the treatment with HCl solution, therefore Cl− can be recovered via the electrostatic interaction between N+ and Cl− ions. Secondly, the doped Cl− ions were replaced by metal ions through ion exchange.45 However, lead ions are cations, and therefore this apparent selectivity is not related to the anion exchange process as mentioned above. Then, the adsorption capacity of PVDF/TBAC–PPy adsorbent for the lead ion was very low. For the PVDF/TBAC–MnO2 nanofiber mat, the large area of agglomerate of MnO2 led to its low adsorption capacity.
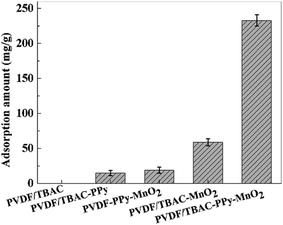 |
| | Fig. 4 The adsorption amount of Pb2+ by different adsorbents. | |
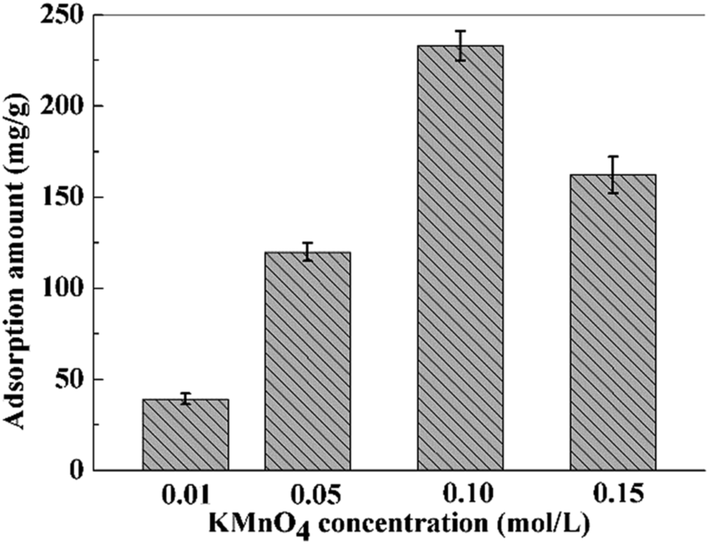
In order to investigate the optimal loading ratios of MnO2, relevant experiments were performed. Adsorbents loaded with different amounts of MnO2 were obtained by regulating the concentration of KMnO4 solutions. The morphologies of PVDF/TBAC–PPy–MnO2 nanofiber mats obtained from different KMnO4 concentrations were shown in Fig. 5 and the effect of KMnO4 concentrations on Pb2+ removal was presented in Fig. 6. It can be clearly seen that the adsorption amount was correlated to the KMnO4 concentration to some extent. This was because that the MnO2 content increased with the increase of KMnO4 concentration to some extent and the coarser surface could provide more effective adsorption sites. However, further increase the KMnO4 concentration, the adsorption amount decreased, which may be attributed to that the dense MnO2 reduced the effective adsorption sites of the PVDF/TBAC–PPy–MnO2 nanofiber mats. It can be concluded that the large specific surface area and the high MnO2 content contributed to the good adsorption performance.
 |
| | Fig. 5 FE-SEM images of PVDF/TBAC–PPy–MnO2 nanofiber mat obtained from different KMnO4 concentration: (a) 0.01 M, (b) 0.05 M, (c) 0.10 M and (d) 0.15 M. | |
 |
| | Fig. 6 The adsorption amount of PVDF/TBAC–PPy–MnO2 nanofiber mat obtained from different KMnO4 concentrations. | |
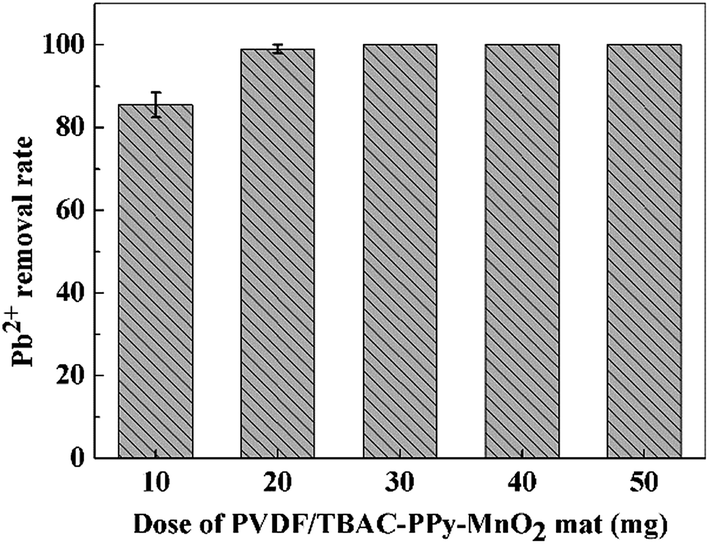
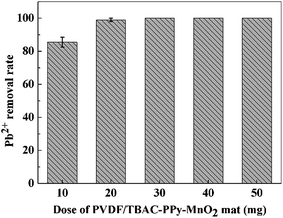
3.2.2. Effect of adsorbent dose. The dosage of adsorbent used in the adsorption process determines the adsorption performance of adsorbent for a given initial concentration of heavy metal ions solution. To study the effect of adsorbent dosage on the Pb2+ removal performance, different amounts of PVDF/TBAC–PPy–MnO2 nanofiber mats were added into 30 mL 100 mg L−1 Pb2+ solution for 24 h. The results were shown in Fig. 7. The results indicated that the Pb2+ removal rate increased slowly (from 85.50% to 99.04%) with the increase of adsorbent dosage (from 10 to 20 mg), which meant that extra PVDF/TBAC–PPy–MnO2 nanofiber mat was waste for 30 mL 100 mg L−1 Pb2+ solution. So we use 10 mg PVDF/TBAC–PPy–MnO2 nanofiber mat to study the effect of PH on the Pb2+ adsorption.
 |
| | Fig. 7 Effect of PVDF/TBAC–PPy–MnO2 nanofiber mat dose on the Pb2+ removal performance. | |
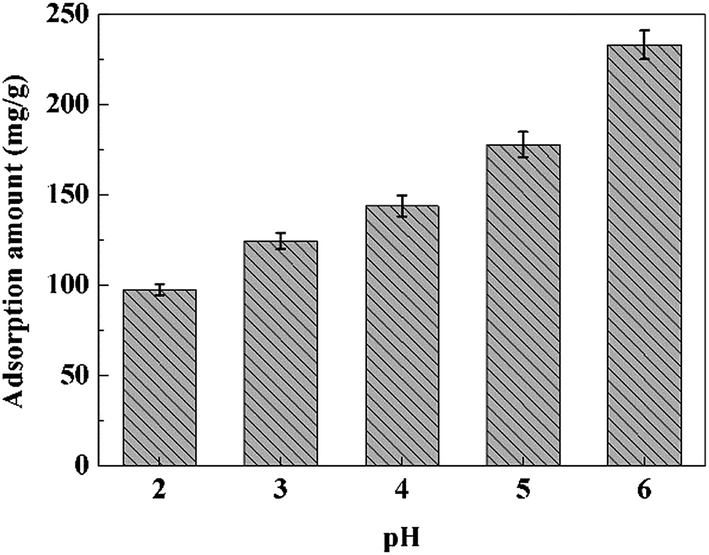
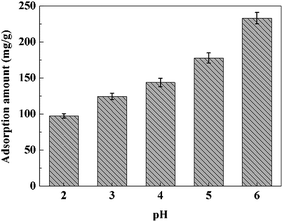
3.2.3. PH effect on the Pb2+ adsorption. Aqueous solution pH value plays a key role on the Pb2+ adsorption behavior because it affects both adsorbent and adsorbate.27 According to the literature, lead ions will precipitate at alkaline solution.46 Therefore, the effect of solution pH on the Pb2+ adsorption of was studied in the pH range of 2.0–6.0, and the results were shown in Fig. 8. It was clear that when the pH of the Pb2+ solution changed from 2.0 to 6.0, the adsorption performance of adsorbent increased from 97.57 mg g−1 to 233.69 mg g−1. The possible mechanism was reported by the literature.27 The increase of pH may cause the less competitive interaction between the hydronium (H3O+) ions and Pb2+ for the same sorption sites on the adsorbent surface. Additionally, the elevated levels of hydrogen ions may damage the surface structure of PVDF/TBAC–PPy–MnO2 nanofiber mat due to the reaction between the metal oxide and hydrogen ions. Therefore, we choose pH value of 6.0 for the remaining experiments.
 |
| | Fig. 8 Effect of pH on the removal of Pb2+ by the PVDF/TBAC–PPy–MnO2 nanofiber mat. | |
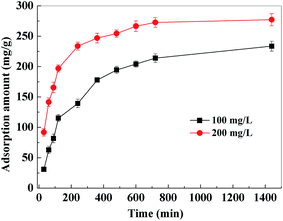
3.2.4. Adsorption kinetics. Fig. 9 shows the results of adsorption kinetics experiments within 24 h at 298 K. During the first 2 h, the adsorption capacity increased rapidly. But the adsorption rate became slow for the next 10 h and adsorption equilibrium was obtained after approximately 12 h. The adsorption equilibrium adsorption amounts of PVDF/TBAC–PPy–MnO2 nanofiber mat for Pb2+ were 233.69 mg g−1 and 277.26 mg g−1 for 100 mg L−1 and 200 mg L−1 initial Pb2+ solution, respectively.
 |
| | Fig. 9 Effect of contact time and initial concentration on the adsorption of Pb2+ by PVDF/TBAC–PPy–MnO2 nanofiber mat. | |
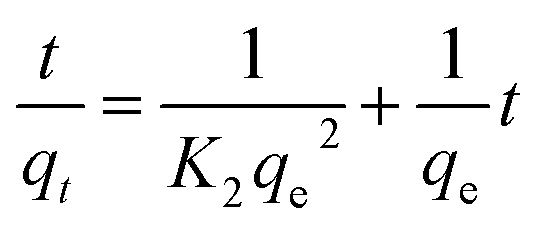
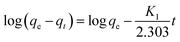
In order to better understand the adsorption behaviors, adsorption kinetic data are often analyzed using two commonly used kinetic models, namely, the pseudo-first-order kinetic model and the pseudo-second-order kinetic model.47,48 These two kinetic models are used to describe the adsorption of solid/liquid systems, which can be expressed in the linear forms as eqn (4) and (5), respectively:
| |
 | (4) |
| |
 | (5) |
where
K1 and
K2 are the pseudo-first-order and the pseudo-second-order rate constants, respectively.
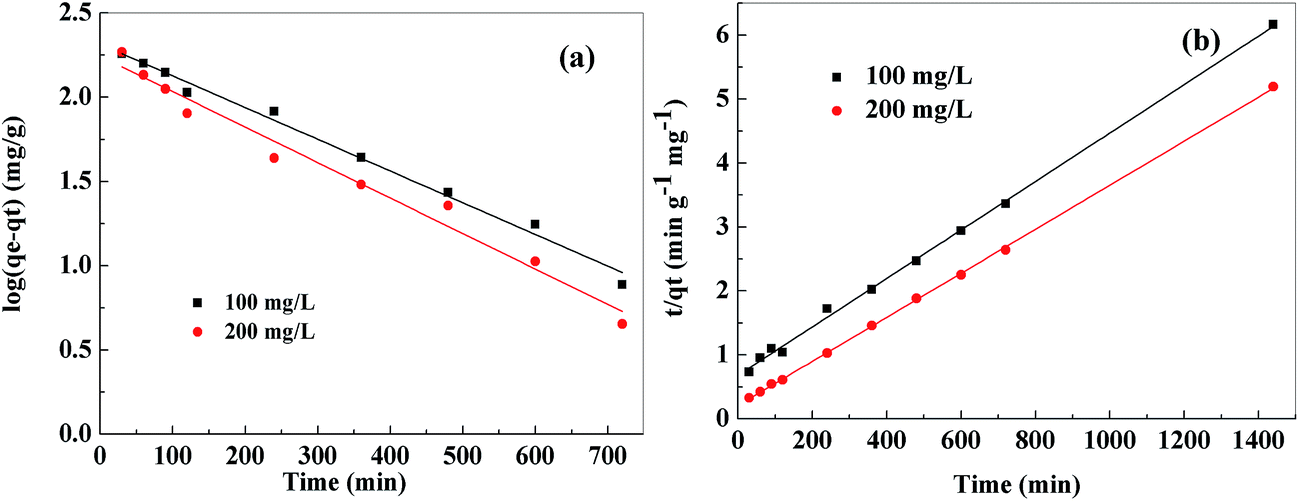
The adsorption kinetic plots for the adsorption of Pb2+ were shown in Fig. 10 and the obtained kinetic parameters were summarized in Table 1. High correlation coefficients (R2 > 0.998) and the proximity between the experimental adsorption amount (qe,exp) and the calculated equilibrium adsorption amount (qe,cal) indicated that heavy metal ions adsorption onto PVDF/TBAC–PPy–MnO2 nanofiber mat could be approximated favorably by the pseudo-second-order model. And pseudo-first-order model did not show goodness of fit. Therefore, the adsorption on PVDF/TBAC–PPy–MnO2 nanofiber mat may be a chemical process through sharing or exchange of electrons between PVDF/TBAC–PPy–MnO2 nanofiber mat and metal ions.49
 |
| | Fig. 10 Pseudo-first-order kinetic model (a), pseudo-second-order kinetic model (b) for adsorption of Pb2+ onto PVDF/TBAC–PPy–MnO2 nanofiber mat. | |
Table 1 Kinetics parameters for Pb2+ adsorption onto the PVDF/TBAC–PPy–MnO2 nanofiber mat
| C0 (mg L−1) |
qe,exp (mg g−1) |
Pseudo-first-model |
Pseudo-second-model |
| K1 (min−1) |
qe,cal (mg g−1) |
R2 |
K2 (min g−1 mg−1) |
qe,cal (mg g−1) |
R2 |
| 100 |
233.69 |
0.0043 |
206.50 |
0.9900 |
2.11 × 10⁻⁵ |
263.85 |
0.9980 |
| 200 |
277.26 |
0.0049 |
175.18 |
0.9763 |
5.62 × 10⁻⁵ |
290.70 |
0.9997 |
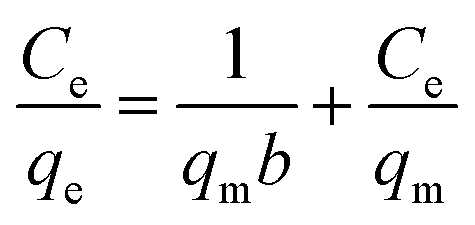
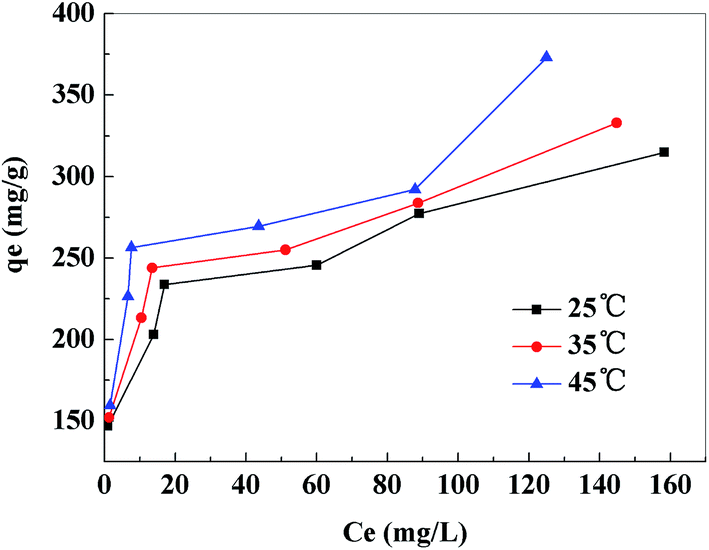
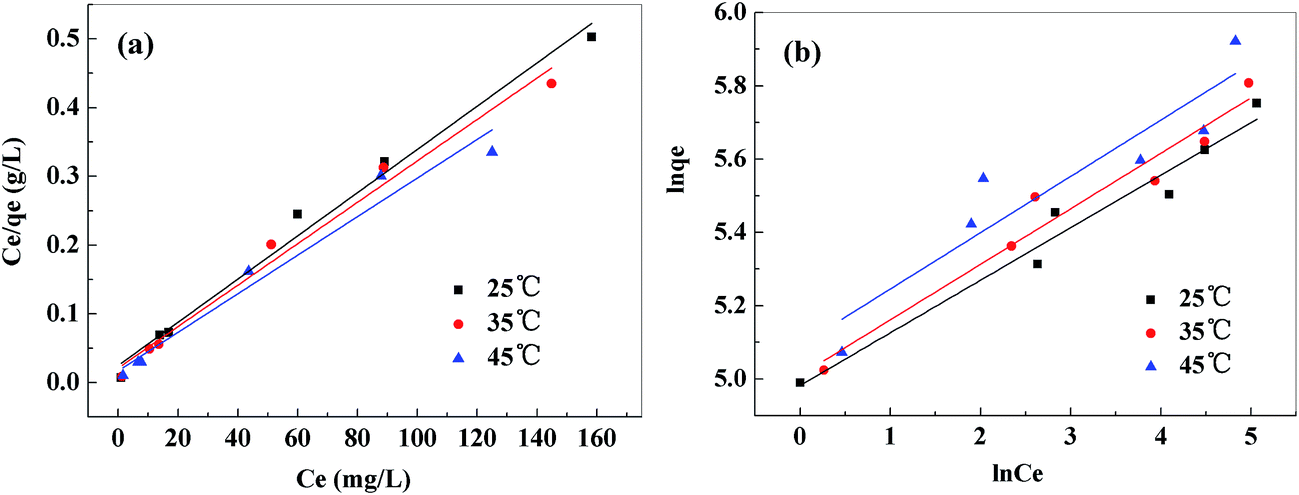
3.2.5. Adsorption isotherm and thermodynamic study. The results of adsorption isotherms of Pb2+ removal by PVDF/TBAC–PPy–MnO2 nanofiber mat at temperature of 25 °C, 35 °C and 45 °C were shown in Fig. 11. The results indicated that there was an increase of the adsorption amount with an increase of solution temperature. Meanwhile, the increase of adsorption amount with the increase of initial solution concentration was slightly faster at higher solution temperature than at low solution temperature. This may be due to an increase in thermal energy of the adsorbing species, which leads to higher adsorption amount and faster adsorption rate. The maximum adsorption capacities of the PVDF/TBAC–PPy–MnO2 adsorbent for heavy metals were evaluated using the two well-known models of Langmuir and Freundlich isotherms.19,50,51 The Langmuir model is based in the assumption of adsorption homogeneity, representing equally available adsorption sites, monolayer surface coverage, and no interaction between adsorbed species. The linear form of Langmuir isotherm equation is given by eqn (6):| |
 | (6) |
where Ce (mg g−1) is the equilibrium concentration on heavy metal ions in solution, qe is the adsorption amount at equilibrium concentration (mg g−1), qm (mg g−1) is the maximum adsorption capacity and b (L mg−1) is the Langmuir constant relate to the energy of adsorption.
 |
| | Fig. 11 Equilibrium isotherms of Pb2+ onto PVDF/TBAC–PPy–MnO2 nanofiber mat. | |
The Freundlich isotherm describes reversible adsorption and is not restricted to the formation of the monolayer. The Freundlich model takes the following form:
| |
 | (7) |
where
Kf and 1/
n constants are related to the adsorption capacity and intensity of adsorption.
The values of these parameters, as analyzed from the plots shown in Fig. 12, were summarized in Table 2. The higher values of correlation coefficient revealed that Langmuir model better fitted the isotherm data well compared to the Freundlich model. The results indicated that this adsorption process took place on the adsorption sites acted as monolayer adsorption on the surface of the PVDF/TBAC–PPy–MnO2 adsorbent under the applied test conditions. The maximum adsorption capacity calculated from the Langmuir model increased from 318.47 to 355.87 mg g−1 as the temperature increased from 25 °C to 45 °C. This value was larger than those reported in literatures for other MnO2 adsorbents, as shown in Table 3.
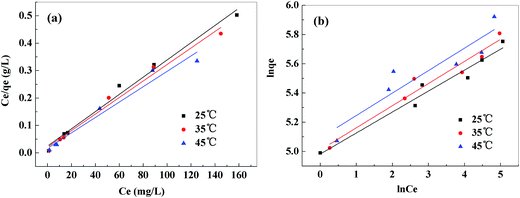 |
| | Fig. 12 Langmuir isotherm model (a), Freundlich isotherm model (b) for adsorption of Pb2+ onto PVDF/TBAC–PPy–MnO2 nanofiber mat. | |
Table 2 Langmuir and Freundlich isotherm parameters for Pb2+ adsorption onto the PVDF/TBAC–PPy–MnO2 nanofiber mat
| Temperature (°C) |
Langmuir model |
Freundlich model |
| qm (mg g−1) |
b (L mg−1) |
R2 |
Kf (mg g−1) |
1/n |
R2 |
| 25 |
318.47 |
0.1260 |
0.9853 |
145.84 |
0.1434 |
0.9547 |
| 35 |
332.22 |
0.1420 |
0.9822 |
149.88 |
0.1516 |
0.9412 |
| 45 |
355.87 |
0.1648 |
0.9621 |
162.70 |
0.1537 |
0.8314 |
Table 3 Comparison of the maximum adsorption capacities for Pb2+ onto PVDF/TBAC–PPy–MnO2 nanofiber mat with other MnO2 adsorbents reported in previous literatures
| Adsorbent |
Qmax (mg g−1) |
References |
| Magnetic halloysite nanotubes@manganese oxide nanocomposite |
59.9 |
52 |
| Hydrous MnO2–poly(N-hydroxymethyl acrylamide/2-hydroxyethyl acrylate) hydrogel |
100.18 |
24 |
| MnO2-coated SD300 resin |
140.9 |
53 |
| Triethylenetetramine functionalized cellulose acetate grafted with the copolymer-MnO2 composite |
196.84 |
54 |
| γ-MnO2 |
200 |
55 |
| Magnetic Fe3O4–MnO2 nanoplates |
208.17 |
56 |
| Nano manganese oxide |
230 |
57 |
| Polyacrylonitrile/PPy/MnO2 |
251.89 |
27 |
| PVDF/TBAC–PPy–MnO2 |
318.47 |
This study |
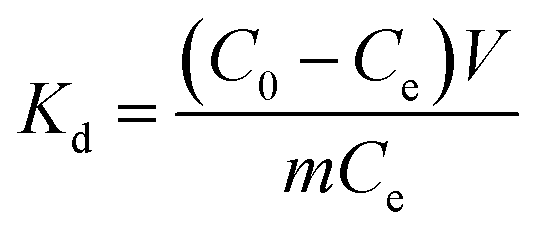
The thermodynamic parameters such as changes in standard Gibbs free energy change (ΔG0), enthalpy change (ΔH0) and entropy change (ΔS0) for the adsorption of Pb2+ by PVDF/TBAC–PPy–MnO2 adsorbent were determined by the following equations:58,59
| |
 | (8) |
| |
 | (9) |
| | |
ΔG0 = −RTlnKd
| (10) |
where
R (J mol
−1 K
−1) is the gas constant,
m (g) is the adsorbent dose and
T (K) is the absolute solution temperature.
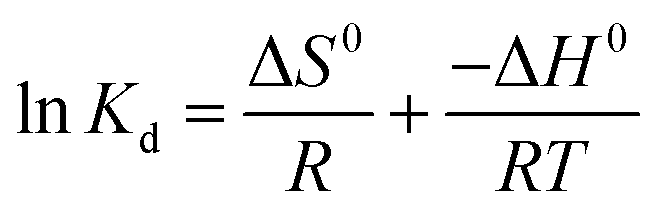
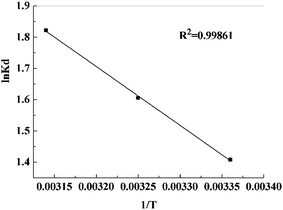
The value of ΔH0 and ΔS0 were obtained from the slope and intercept of the plots of lnKd versus 1/T, as shown in Fig. 13. The related parameters were calculated and presented in Table 4. The positive value of ΔH0 confirmed that the adsorption process was endothermic in nature, while the positive entropy change (ΔS0) suggested an increase in randomness at the PVDF/TBAC–PPy–MnO2 adsorbent–solution interface. And the decrease in ΔG0 values with the increasing temperature indicated that the adsorption process was spontaneous.
 |
| | Fig. 13 Plots to determine thermodynamic parameters of Pb2+ onto PVDF/TBAC–PPy–MnO2 nanofiber mat. | |
Table 4 Thermodynamic parameters for Pb2+ uptake by the PVDF/TBAC–PPy–MnO2 nanofiber mat
| Temperature (K) |
ΔG0 (kJ mol−1) |
ΔH0 (kJ mol−1) |
ΔS0 (J mol−1 K−1) |
| 298 |
−3.4882 |
— |
— |
| 308 |
−4.1118 |
15.6655 |
64.3151 |
| 318 |
−4.8182 |
— |
— |
3.3. Coexisting metal ions
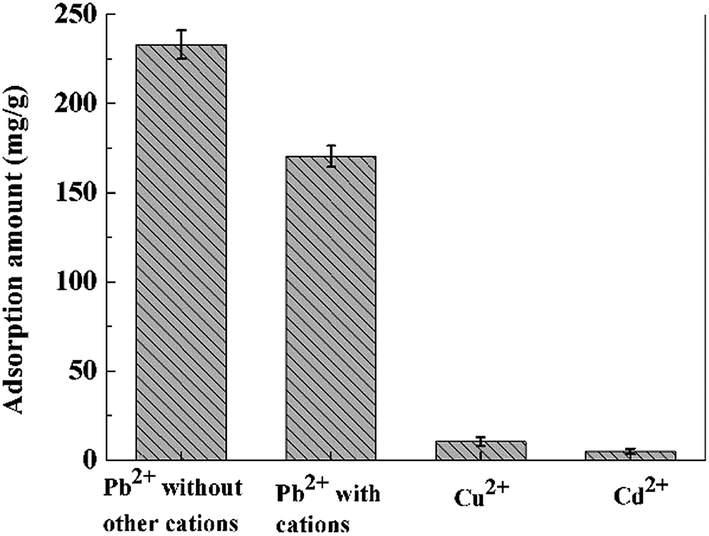
It is very significant to investigate the adsorption process in multicomponent heavy metal ion system since the natural and industrial effluents rarely contain one kind of heavy metal. In this study, Cu2+ and Cd2+ were used as the coexisting metal ions. 10 mg PVDF/TBAC–PPy–MnO2 nanofiber mats were immersed into 30 mL mixed solution, which contained Pb2+, Cu2+ and Cd2+. The initial concentration of each metal ion was 100 mg L−1, and the pH value of the solution was 6.0. Fig. 14 shows the effects of coexisting metal ions on Pb2+ adsorption performance. As observed, the Pb2+ adsorption performance was slightly decreased due to the presence of Cu2+ and Cd2+ in the solution. However, the adsorption amounts of Cu2+ and Cd2+ were negligibly small. So the selectivity of PVDF/TBAC–PPy–MnO2 nanofiber mat to Pb2+ was very good.
 |
| | Fig. 14 Effect of coexisting metal ions on the Pb2+ adsorption. | |
3.4. Regeneration study
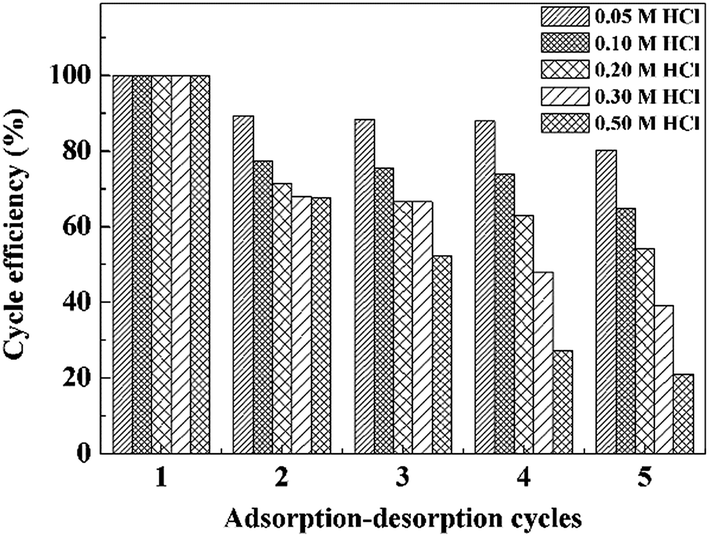
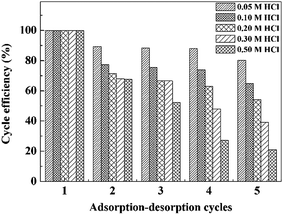
In order to improve sustainable use of the adsorbent for subsequent application and reduce the overall cost treatment, adsorbent regeneration study was performed. Since the adsorption of Pb2+ onto the PVDF/TBAC–PPy–MnO2 nanofiber mat was pH-dependent and the higher pH was beneficial for the Pb2+ adsorption. Desorption of Pb2+ from the adsorbent can be achieved by decreasing the pH values of the system. Different concentrations of HCl were investigated to determine the conditions for unloading the Pb2+ from the metal-adsorbed PVDF/TBAC–PPy–MnO2 nanofiber mat, and the results for four cycles were exhibited in Fig. 15. It was clear that the adsorption efficiency of the Pb2+ decreased as the concentration of HCl increased from 0.05 M to 0.50 M. When 0.05 M HCl was used for the regeneration, the Pb2+ adsorption efficiency still remained more than 80% of its original adsorption capacity after five times usage. However, when the concentration of HCl was higher than 0.20 M, the adsorption capacity of the adsorbent dropped dramatically after three adsorption/desorption cycles. This was attributed to the instability of MnO2 at a high acid concentration and the MnO2 was partially off from the surface of PVDF/TBAC–PPy–MnO2 adsorbents.27 Thus 0.05 M HCl was selected to be eluent for desorption of Pb2+ from the surface of adsorbent.
 |
| | Fig. 15 Effects of acid concentration on the regeneration performance. | |
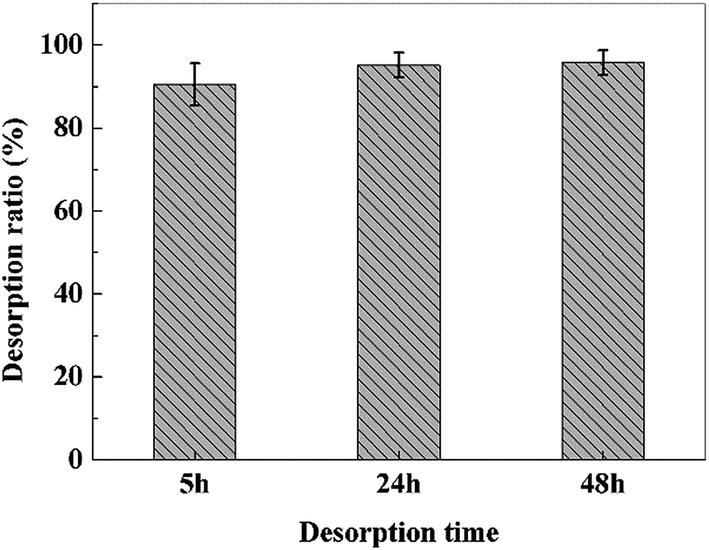
To investigate the desorption efficiency of the lead-loaded adsorbents, the adsorbents were desorbed with 50 mL 0.05 M HCl solution for 5 h, 24 h and 48 h, respectively, and the results were shown in Fig. 16. It could be seen that the desorption ratio of adsorbents desorbed for 5 h were above 90%. When the desorption time increased to 24 h and 48 h, both the desorption ratios were above 95%. This results indicated that desorption equilibrium was obtained after approximately 12 h. However, considering the practical application, the desorption time was selected to be 5 h.
 |
| | Fig. 16 Desorption efficiency of different desorption time for lead-loaded PVDF/TBAC–PPy–MnO2 nanofiber mat. | |
The regeneration experiments in this study indicated that the PVDF/TBAC–PPy–MnO2 nanofiber mat can be used repeatedly as efficient adsorbents for practical wastewater treatment at an optimal concentration of acid. Furthermore, only a tiny amount of MnO2 might fall off from the surface of the adsorbents during the multiple desorption and washing steps. Due to the low-toxicity of MnO2,60 there was almost no risk of secondary contaminants. Therefore, the prepared PVDF/TBAC–PPy–MnO2 nanofiber mat in the present study will be an excellent candidate for the Pb2+ removal from the contaminated water based on the high adsorption capacity, good regeneration together with convenient separation.
3.5. Adsorption mechanism
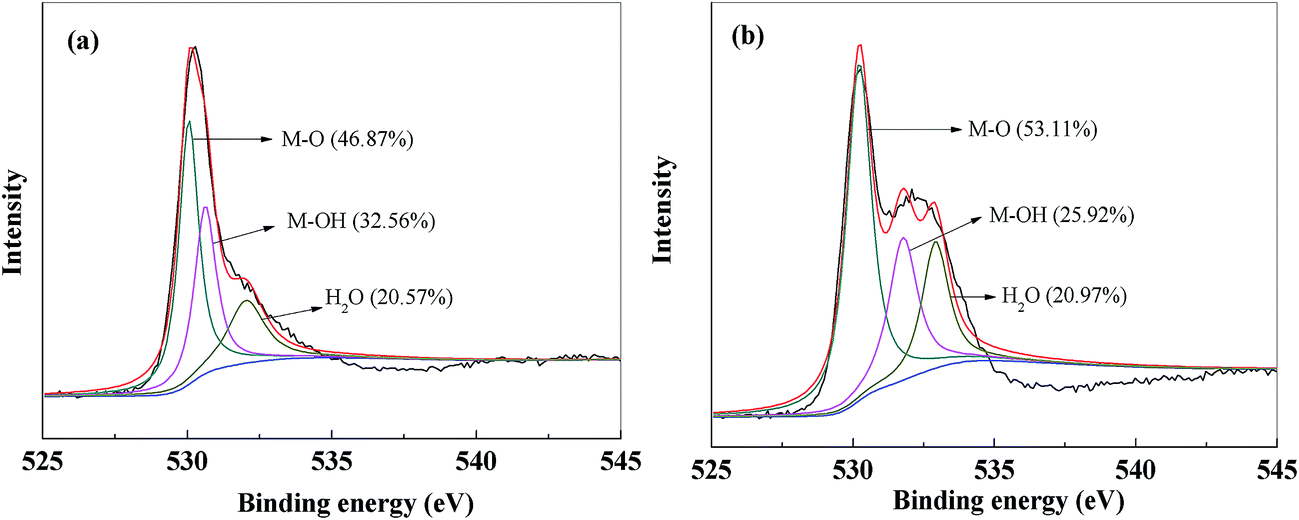
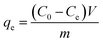
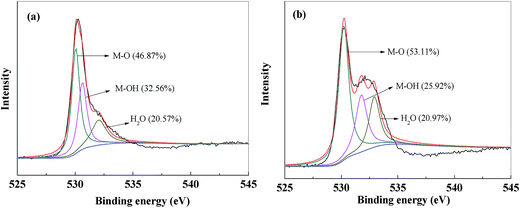
The XPS spectra of O 1s before and after Pb2+ adsorption were compared to better understand the adsorption process, and the results were shown in Fig. 17. Before the Pb2+ adsorption, the O 1s spectrum of PVDF/TBAC–PPy–MnO2 nanofiber mat can be divided into three peaks at around 530.0 eV, 531.3 eV and 533.1 eV, which can be assigned to metal oxide (M–O), hydroxyl boned to metal (M–OH) and adsorbed H2O in the adsorbent, respectively.25,27 After Pb2+ adsorption, it was clear that the area ratio of the peak at 530.0 eV assigned to M–O increased by 6.24% (from 46.87% to 53.11%). While the area ratio of the peak at 531.3 eV assigned to M–OH decreased by 6.64% (from 32.56% to 25.92%). It was obvious that the decreased M–OH area ratio equaled to that of M–O, which meant that the M–OH and M–O groups on the surface of PVDF/TBAC–PPy–MnO2 adsorbent participated in the Pb2+ adsorption process. The main adsorption mechanism maybe an exchange reaction between Pb2+ and protons existed on the surface of manganese oxide,24 which may be written as eqn (11)–(14):| | |
MnOH + Pb2+ ⇆ (MnO−Pb)+ + H+
| (11) |
| | |
MnO− + Pb2+ ⇆ MnO−Pb2+
| (12) |
| | |
2MnOH + Pb2+ ⇆ (MnO−)2Pb2+ + 2H+
| (13) |
| | |
2MnO− + Pb2+ ⇆ (MnO−)2Pb2+
| (14) |
 |
| | Fig. 17 XPS spectra of O 1s of PVDF/TBAC–PPy–MnO2 nanofiber mat before (a) and after (b) Pb2+ adsorption. | |
4. Conclusions
Tree-like PVDF/TBAC–PPy–MnO2 nanofiber mat with high adsorption performance towards Pb2+ was successfully fabricated by electrospinning and followed by in situ polymerization of pyrrole monomer, and subsequently reacted with KMnO4 solution. FT-IR results confirmed the presence of MnO2 layer on the surface of the PVDF/TBAC–PPy–MnO2 nanofiber mat. Kinetics of the Pb2+ adsorptions was found to follow pseudo-second-order rate model. The adsorption isotherms were fitted better with Langmuir isotherm model. The thermodynamic analysis confirmed that the adsorption process was endothermic and spontaneous. The regeneration experiments showed that the obtained tree-like PVDF/TBAC–PPy–MnO2 nanofiber mat also exhibited high recyclable removal efficiency. XPS analysis showed that ion exchange was the main mechanism for the Pb2+ adsorption. Therefore, the tree-like PVDF/TBAC–PPy–MnO2 nanofiber mat may be applied as a promising adsorbent in heavy metal ions waste water treatment.
Acknowledgements
This work was supported by National Natural Science Foundation of China (51673148), the National Key Technology Support Program (2015BAE01B03), the Science and Technology Plans of Tianjin (15PTSYJC00230), the National Key Research and Development Project (2016YFB0303304), the Innovation Fund for Technology of China (14C26211200298) and the Innovation Fund for Technology of Tianjin (14ZXCXGX00776).
References
- R. Zhao, X. Li, B. L. Sun, M. Q. Shen, X. C. Tan, Y. Ding, Z. Q. Jiang and C. Wang, Chem. Eng. J., 2015, 268, 290–299 CrossRef CAS.
- R. Rojas, M. R. Perez, E. M. Erro, P. I. Ortiz, M. A. Ulibarri and C. E. Giacornelli, J. Colloid Interface Sci., 2009, 331, 425–431 CrossRef CAS PubMed.
- S. Rajput, C. U. Pittman and D. Mohan, J. Colloid Interface Sci., 2016, 468, 334–346 CrossRef CAS PubMed.
- D. Bulgariu and L. Bulgariu, Bioresour. Technol., 2013, 129, 374–380 CrossRef CAS PubMed.
- Y. Y. Xu, Q. F. Dang, C. S. Liu, J. Q. Yan, B. Fan, J. P. Cai and J. J. Li, Colloids Surf., A, 2015, 482, 353–364 CrossRef CAS.
- S. H. Jang, B. G. Min, Y. G. Jeong, W. S. Lyoo and S. C. Lee, J. Hazard. Mater., 2008, 152, 1285–1292 CrossRef CAS PubMed.
- H. Yin, X. H. Feng, G. H. Qiu, W. F. Tan and F. Liu, J. Hazard. Mater., 2011, 188, 341–349 CrossRef CAS PubMed.
- T. A. Kurniawan, G. Y. S. Chan, W. H. Lo and S. Babel, Chem. Eng. J., 2006, 118, 83–98 CrossRef CAS.
- Q. Y. Chen, Z. Luo, C. Hills, G. Xue and M. Tyrer, Water Res., 2009, 43, 2605–2614 CrossRef CAS PubMed.
- V. Pena-Caballero, R. Aguilar-Lopez, P. A. Lopez-Perez and M. I. Neria-Gonzalez, Desalin. Water Treat., 2016, 57, 13056–13065 CrossRef CAS.
- S. A. Cavaco, S. Fernandes, M. M. Quina and L. M. Ferreira, J. Hazard. Mater., 2007, 144, 634–638 CrossRef CAS PubMed.
- B. Shah and U. Chudasama, J. Hazard. Mater., 2014, 276, 138–148 CrossRef CAS PubMed.
- S. M. Doke and G. D. Yadav, Chem. Eng. J., 2014, 255, 483–491 CrossRef CAS.
- M. Schwarze, M. Gross, M. Moritz, G. Buchner, L. Kapitzki, L. Chiappisi and M. Gradzielski, J. Membr. Sci., 2015, 478, 140–147 CrossRef CAS.
- S. Hena, J. Hazard. Mater., 2010, 181, 474–479 CrossRef CAS PubMed.
- M. Kumari, C. U. Pittman and D. Mohan, J. Colloid Interface Sci., 2015, 442, 120–132 CrossRef CAS PubMed.
- X. Z. Wu, L. L. Luo, Z. Y. Chen and K. L. Liang, Appl. Surf. Sci., 2016, 364, 86–95 CrossRef CAS.
- S. Ghoohestani and H. Faghihian, Desalin. Water Treat., 2016, 57, 4049–4058 CrossRef CAS.
- Y. Ren, H. A. Abbood, F. B. He, H. Peng and K. X. Huang, Chem. Eng. J., 2013, 226, 300–311 CrossRef CAS.
- K. Li, Y. W. Wang, M. Huang, H. Yan, H. Yang, S. J. Xiao and A. M. Li, J. Colloid Interface Sci., 2015, 455, 261–270 CrossRef CAS PubMed.
- Y. X. Zhang, Y. J. Ye, Z. L. Liu, B. Li, Q. Z. Liu, Q. C. Liu and X. H. Li, J. Alloys Compd., 2016, 662, 421–430 CrossRef CAS.
- A. R. Contreras, E. Casals, V. Puntes, D. Komilis, A. Sanchez and X. Font, Global NEST J., 2015, 17, 536–543 Search PubMed.
- X. Zhang, Y. Wang, Y. F. Liu, J. L. Xu, Y. D. Han and X. X. Xu, Appl. Surf. Sci., 2014, 316, 333–340 CrossRef CAS.
- Q. Zhu and Z. K. Li, Chem. Eng. J., 2015, 281, 69–80 CrossRef CAS.
- C. Z. Hu, F. Y. Liu, H. C. Lan, H. J. Liu and J. H. Qu, J. Colloid Interface Sci., 2015, 446, 359–365 CrossRef PubMed.
- J. Zhu, S. A. Baig, T. T. Sheng, Z. M. Lou, Z. X. Wang and X. H. Xu, J. Hazard. Mater., 2015, 286, 220–228 CrossRef CAS PubMed.
- C. Luo, J. Q. Wang, P. Jia, Y. X. Liu, J. H. An, B. Cao and K. Pan, Chem. Eng. J., 2015, 262, 775–784 CrossRef CAS.
- Y. T. Zhou, H. L. Nie, C. Branford-White, Z. Y. He and L. M. Zhu, J. Colloid Interface Sci., 2009, 330, 29–37 CrossRef CAS PubMed.
- M. S. B. Brandão and F. Galembeck, Colloids Surf., 1990, 48, 351–362 CrossRef.
- S. Y. Xie, X. Y. Liu, B. W. Zhang, H. J. Ma, C. J. Ling, M. Yu, L. F. Li and J. Y. Li, J. Mater. Chem. A, 2015, 3, 2552–2558 CAS.
- Y. Li, J. Zhang, C. Xu and Y. F. Zhou, Sci. China: Chem., 2016, 59, 95–105 CrossRef CAS.
- R. Gopal, S. Kaur, Z. W. Ma, C. Chan, S. Ramakrishna and T. Matsuura, J. Membr. Sci., 2006, 281, 581–586 CrossRef CAS.
- X. Zhuang, L. Shi, K. Jia, B. Cheng and W. Kang, J. Membr. Sci., 2012, 429, 66–70 CrossRef.
- Z. J. Zhang and D. L. Hao, Adv. Mater. Res., 2014, 898, 465–469 CrossRef.
- M. Y. Bai and J. C. Tsai, Fibers Polym., 2014, 15, 2265–2271 CrossRef CAS.
- M. S. Birajdar, S. D. Wanjale and S. P. Lonkar, J. Appl. Polym. Sci., 2013, 130, 4508–4515 CAS.
- X. Zhao, L. Song, J. Fu, P. Tang and F. Liu, J. Hazard. Mater., 2011, 189, 732–740 CrossRef CAS PubMed.
- J. G. Wang, Y. Yang, Z. H. Huang and F. Kang, J. Mater. Chem., 2012, 22, 16943–16949 RSC.
- J. Zang and X. Li, J. Mater. Chem., 2011, 21, 10965–10969 RSC.
- Z. J. Li, Y. Z. Xu, L. L. Fan, W. M. Kang and B. W. Cheng, Mater. Des., 2016, 92, 95–101 CrossRef CAS.
- Z. Li, W. Kang, H. Zhao, M. Hu, N. Wei, J. Qiu and B. Cheng, Nanomaterials, 2016, 6, 152–162 CrossRef.
- Z. J. Li, W. M. Kang, H. H. Zhao, M. Hu, J. G. Ju, N. P. Denga and B. W. Cheng, RSC Adv., 2016, 6, 91243–91249 RSC.
- J. Q. Wang, K. Pan, Q. W. He and B. Cao, J. Hazard. Mater., 2013, 244, 121–129 CrossRef PubMed.
- J. F. Zang and X. D. Li, J. Mater. Chem., 2011, 21, 10965–10969 RSC.
- J. Wang, C. Luo, G. Qi, K. Pan and B. Cao, Appl. Surf. Sci., 2014, 316, 245–250 CrossRef CAS.
- L. Lalhmunsiama, S. M. Lee and D. Tiwari, Chem. Eng. J., 2013, 225, 128–137 CrossRef.
- Y. Jiang, H. Pang and B. Liao, J. Hazard. Mater., 2009, 164, 1–9 CrossRef CAS PubMed.
- M. Bhaumik, C. Noubactep, V. K. Gupta, R. I. McCrindle and A. Maity, Chem. Eng. J., 2015, 271, 135–146 CrossRef CAS.
- S. J. Allen, Q. Gan, R. Matthews and P. A. Johnson, J. Colloid Interface Sci., 2005, 286, 101–109 CrossRef CAS PubMed.
- L. Q. Guo, P. R. Ye, J. Wang, F. F. Fu and Z. J. Wu, J. Hazard. Mater., 2015, 298, 28–35 CrossRef CAS PubMed.
- Y. Yu, R. G. Peng, C. Yang and Y. H. Tang, J. Mater. Sci., 2015, 50, 5799–5808 CrossRef CAS.
- D. Afzali and M. Fayazi, J. Taiwan Inst. Chem. Eng., 2016, 63, 421–429 CrossRef CAS.
- Y. Xiong, X. M. Lu and H. C. Tao, Desalin. Water Treat., 2016, 57, 2018–2027 CrossRef CAS.
- A. A. Yakout, R. H. El-Sokkary, M. A. Shreadah and O. G. A. Hamid, Carbohydr. Polym., 2016, 148, 406–414 CrossRef CAS PubMed.
- N. Chung Le and D. Van Phuc, Adv. Nat. Sci.: Nanosci. Nanotechnol., 2015, 6, 025014–025021 CrossRef.
- J. H. Zhao, J. Liu, N. Li, W. Wang, J. Nan, Z. W. Zhao and F. Y. Cui, Chem. Eng. J., 2016, 304, 737–746 CrossRef CAS.
- J. Al Abdullah, A. G. Al Lafi, W. Al Masri, Y. Amin and T. Alnama, Water, Air, Soil Pollut., 2016, 227, 1–11 CrossRef CAS.
- S. Deng, G. S. Zhang, X. Wang, T. Zheng and P. Wang, Chem. Eng. J., 2015, 276, 349–357 CrossRef CAS.
- N. Mohammadi, H. Khani, V. K. Gupta, E. Amereh and S. Agarwal, J. Colloid Interface Sci., 2011, 362, 457–462 CrossRef CAS PubMed.
- S. Hernández, C. Ottone, S. Varetti, M. Fontana, D. Pugliese, G. Saracco, B. Bonelli and M. Armandi, Materials, 2016, 9, 296–309 CrossRef.
|
| This journal is © The Royal Society of Chemistry 2017 |
Click here to see how this site uses Cookies. View our privacy policy here. 
 Open Access Article
 This Open Access Article is licensed under a Creative Commons Attribution-Non Commercial 3.0 Unported Licence
 *c
*c