
 Open Access Article
 This Open Access Article is licensed under a
 Creative Commons Attribution 3.0 Unported Licence
Graphene oxide and adenosine triphosphate as a source for functionalized carbon dots with applications in pH-triggered drug delivery and cell imaging†
Ming Zhangab,
Ninglin Zhou *abc,
Ping Yuanab,
Yutian Suab,
Maoni Shaoab and
Cheng Chiab
*abc,
Ping Yuanab,
Yutian Suab,
Maoni Shaoab and
Cheng Chiab
aJiangsu Collaborative Innovation Center for Biological Functional Materials, College of Chemistry and Materials Science, Nanjing Normal University, Nanjing 210023, China. E-mail: zhouninglin@njnu.edu.cn
bJiangsu Key Laboratory of Biofunctional Materials, Jiangsu Engineering Research Center for Biomedical Function Materials, Nanjing 210023, China
cNanjing Zhou Ninglin Advanced Materials Technology Company Limited, Nanjing 211505, China
First published on 30th January 2017
Abstract
A folate-functionalized carbon dot-based nanocarrier system has been successfully synthesized for cancer cell targeted drug delivery. We hydrothermally synthesized blue photoluminescent N,P-CDs using adenosine triphosphate and graphene oxide as the starting materials. The particle size of the N,P-CDs was ca. 3.8 nm. An anticancer drug, doxorubicin (DOX), was grafted onto the carbon dots via electrostatic interactions, and a more specific anticancer agent (DOX/N,P-CDs) was obtained. The DOX/N,P-CDs were characterized by H-NMR, C-NMR and UV-vis analysis. In addition, the DOX/N,P-CDs showed a pH-dependent release and were easily absorbed by cells. When compared to DOX, DOX/N,P-CDs nanoparticles exhibited the same cytotoxicity towards human cervical cancer cells (HeLa cells) and human pulmonary adenocarcinoma cells (A549 cells). Hemolysis test results indicated that DOX/N,P-CDs were safe for blood-contact applications and were suitable for intravenous administration. Owing to their intrinsic biocompatibility, N,P-CDs can be used for cell imaging and drug delivery with excellent targeting property.
1. Introduction
In recent decades, a new type of drug delivery system, namely, nanodrug delivery systems (NDDS), has received great attention in research. Drug-loaded nanoparticles have excellent properties for slow-release and targeted drug delivery, reducing the side effects of drugs.1–4 As a new zero-dimensional carbon nanomaterial, carbon dots have novel properties such as a stable skeleton structure, surface capable of modification, good water solubility, excellent optical properties and biocompatibility.5–7 Based on this, a variety of pH-responsive nanoparticle-based drug delivery systems for controlled drug release have been developed.8–10 Traditionally, drug-loaded systems based on fluorescent nanoparticles have two characteristics: photoluminescence and drug nanocarriers.11–13 However, designing and synthesizing a drug delivery system with a dual function of imaging and delivery represents a substantial challenge due to the complexity of the intracellular microenvironment and diversity of drug-controlled release. We have been working to solve this problem, with the objective to produce a drug-loaded carbon dot-based system that has a delivery and imaging dual role.It is well known that doxorubicin (DOX) is active in a variety of cancers, particularly breast cancer, acute leukemia and malignant lymphoma.14–16 This has led to DOX becoming one of the most widely used anticancer drugs, which has attracted much attention worldwide for more than forty years.17–19 DOX shows a therapeutic effect on a variety of tumors, as it is a non-specific drug that can kill tumor cells belonging to different growth periods.20–22 However, it can also produce a wide range of biological and chemical effects in the human body, such as strong cytotoxic effects, mutations and carcinogenic effects.23–25 In the clinical treatment of cancer with DOX, the efficacy of the drug increases with the dose, and tumor cell growth is inhibited. However, at the same time, toxic side effects also increase, leading to enormous problems in clinical applications. In order to improve the efficacy and reduce the side effects of drugs, several clinical researchers have studied DOX with a focus on the development of drug-loaded particles. Wang prepared hollow CDs from bovine serum albumin via hydrothermal synthesis, which showed potential in both cell imaging and cancer therapy applications.26 Ding described a simple and green method for synthesizing DNA-CDs using genomic DNA, which provided a novel platform for fluorescent vehicles for fluorescence bioimaging and drug delivery.27 The pH in tumor tissues is 6.5–7.2,28,29 whereas the lysosomes in tumor cells are more acidic. This pH difference provides an ideal trigger for the controlled release of drugs. Based on this, investigators have developed a variety of pH-responsive nanoparticle-based drug delivery systems for controlled drug release.30–33 The local slow release of DOX has been achieved by the development of carbon-based delivery systems. Therefore, carbon dots can be used to maintain an effective drug concentration in the tumor area through a slow and sustained drug release, improving the utilization of the drug and reducing the frequency of drug administration. This will make cancer treatments safer and more effective, and will reduce suffering in patients.34–36
Herein, we hydrothermally synthesized blue photoluminescent N,P-CDs using adenosine triphosphate and graphene oxide as starting materials prepared from our improved Brodie method.37,38 First, 1-(3-dimethylaminopropyl)-3-ethylcarbodiimide hydrochloride (EDC·HCl) and N-hydroxysuccinimide (NHS) sufficiently activated the carboxyl surface of GO, and then ATP was grafted onto GO by electrostatic interactions and chemical bonding. The N,P-CDs were prepared from graphene oxide-adenosine triphosphate (GO-ATP) via hydrothermal method, and would be used as a new type of fluorescent vehicle for drug delivery. Therefore, physicochemical properties such as fluorescence, morphology, size, and zeta potential were characterized. As DOX has inherent fluorescence, it served to form a dual emission delivery system. The release of the loaded DOX could be triggered at lower intracellular pH values.
2. Experimental
2.1. Materials
Graphite powder was purchased from Sinopharm Chemical Reagent Co. Ltd (Shanghai, China). Adenosine triphosphate (ATP) was purchased from Macklin Biochemical Company (Shanghai, China). Doxorubicin (DOX) was purchased from Shanghai Aladdin Company (Shanghai, China). Chloroacetic acid was purchased from Shanghai Jinshan Chemical Plant (Shanghai, China). All other chemicals were of analytical grade and used as received. Double-distilled water (18.2 MΩ) was obtained from a Milli-Q system (Millipore, Bedford, MA, USA) and was used in the experiments.S. aureus and E. coli were provided by the Jiangsu Provincial Center for Disease Control and Prevention. Human cervical cancer cells (HeLa cells) and human pulmonary adenocarcinoma cells (A549 cells) were purchased from the Cell Bank of Culture Collection of the Chinese Academy of Sciences (Shanghai, China). Fresh whole blood was provided by Jiangsu blood center. Ethical approval for the blood-based experiments was obtained from the National Health and Family Planning Commission. Informed consent from the blood donors was obtained for these experiments. Dulbecco's modified eagle medium (DMEM) was purchased from Thermo Fisher HyClone (USA). Fetal bovine serum (FBS) was obtained from SunShine Biotechnology Co., Ltd. (China). 3-(4,5-Dimethylthiazol-2-yl)2,5-diphenyl tetrazolium bromide (MTT) was purchased from Amresco (USA). Hoechst 33258 was purchased from Gibco Co., Ltd. (China).
2.2. Preparation of GO-ATP
Graphite oxide (GO) was prepared via modified Brodie method. Graphite, fuming nitric acid and potassium chlorate were allowed to react for 24 h at 20 °C, and ammonia was added to neutralize the product. Finally, product was filtered and dried to obtain graphite oxide.GO powder was added to 40 mL of deionized water and the mixture was sonicated for 3 h to obtain a uniform solution. EDC·HCl (0.15 g) and NHS (0.05 g) were dissolved in deionized water (5 mL). The GO solution was added to the EDC·HCl–NHS solution, and final mixture was agitated at room temperature for 30 min to fully activate the surface carboxyl groups. The carboxylic GO solution was transferred to a 100 mL flask, and then ATP of different qualities were added. The pH was adjusted to 7.4, and mixture was agitated for 8 h. The resulting GO-ATP was separated by centrifugation at 11![[thin space (1/6-em)]](https://www.rsc.org/images/entities/char_2009.gif) 000g for 30 min. The obtained solid was then dried in a 70 °C blast drying oven to afford the final GO-ATP product.
000g for 30 min. The obtained solid was then dried in a 70 °C blast drying oven to afford the final GO-ATP product.
2.3. Synthesis of N,P-CDs
GO-ATP (0.5 g) was dissolved in 25 mL of deionized water to form a homogeneous solution. After stirring for 30 min, the mixture was sealed into a 50 mL Teflon-lined stainless steel autoclave, followed by hydrothermal treatment at 200 °C for 10 h. After cooling to room temperature, a black solution was obtained and named N,P-CDs. To further purify the C-dots, the solution was centrifuged at 3000 rpm for 10 min to remove small volumes of liquid and filtered through a 0.22 μm membrane to remove large or agglomerated particles. The purification of the N,P-CDs was conducted through a dialysis tube (3500 Da molecular weight cut-off) for about 24 h in the dark. The obtained N,P-CD solution was concentrated to a powder with a vacuum freeze-drying machine and the final solid was stored in a refrigerator at 4 °C until use.2.4. Instruments and characterization
Photoluminescence (PL) spectra were recorded with a molecular fluorescence spectrometer (Cary Eclipse, varian, USA). (FT-IR) Nexus 670 FTIR type (Nicolet) infrared spectrometer was used to analyze the infrared spectrum of the sample. The FTIR test conditions were: 64 scans were collected at a resolution of 4 cm−1 in a scanning range of 4000–500 cm−1 by the potassium bromide tablet method. The fluorescence lifetime was recorded using time-resolved fluorescence lifetime microscopy (FM-4P-TCSPC, Horiba Jobin Yvon, USA). X-ray diffraction (XRD) analyses were performed using a D/Max 2500 V/PC diffractometer (Rigaku Corporation, Japan). The XRD test conditions were as follows: Cu target, K α-ray, tube voltage of 40 kV, tube current of 100 mA, and a scanning speed of 2° min−1. Thermogravimetric measurements were performed on a Perkin-Elmer TG 7 instrument at a heating rate of 10 °C min−1 up to 800 °C in a nitrogen atmosphere. Ultraviolet-visible (UV-vis) absorption spectra were recorded using a UV absorption spectrophotometer (Cary-50, varian, USA). Proton nuclear magnetic resonance spectroscopy data (H-NMR and C-NMR) were obtained with a 400 MHz WB Solid-State NMR Spectrometer (Switzerland). The surface composition and elemental analysis were conducted via X-ray photoelectron spectroscopy (XPS, EscaLab-250, Thermo, USA). A Malvern ZEN 3600 Zetasizer (Malvern Instruments, UK) was used to measure the hydrodynamic size and zeta potential. The morphologies of the samples were characterized using a transmission electron microscope (TEM, H-7650, Hitachi, Japan) and via scanning electron microscopy (SEM, JSM-5610, Japan). The fluorescent images of cells were acquired via laser scanning confocal microscopy (TI-E-A1R, Nikon, Japan) and upright fluorescence microscopy (XSP-63X, Nikon, Japan).2.5. Quantum yield (Φ) measurements
The specific experimental procedure for the quantum yield measurements was as follows: first, a small amount of quinine sulfate (Φst = 0.54) was dissolved in 0.1 M H2SO4, while the N,P-CDs were dissolved in deionized water. Then, the absorbance values of the N,P-CD and quinine sulfate solutions were measured at 360 nm, whilst ensuring that the absorbance for both samples was less than 0.1. In addition, the integral fluorescence intensity of N,P-CDs and quinine sulfate were obtained by recording both PL emission spectra at an excitation wavelength of 360 nm. Finally, the quantum yield of N,P-CDs was calculated using the following equation:| Φ = Φst(Kx/Kst)(ηx/ηst)2 |
2.6. Drug loading
Doxorubicin (DOX) was loaded onto the N,P-CDs by a dialysis method, as described in previous studies.39 To prepare the blank N,P-CDs solution, N,P-CDs (0.2 mM) were dissolved in ultrapure water, followed by ultrasonication treatment at room temperature. Then, doxorubicin (DOX, 0.1 mg mL−1) was added to the blank N,P-CD solution and stirred for 12 h in the dark. Subsequently, this mixture was dialyzed (1000 Da molecular weight cut-off) against deionized water for 48 h.2.7. Size stability test
The freeze-dried DOX/N,P-CDs were dissolved in deionized water to a final concentration of 10−4 g mL−1, the pH and temperature were adjusted, and the DOX/N,P-CD diameter was measured by dynamic light scattering (DLS) at different pH and temperature values.2.8. In vitro drug release study
The drug release was investigated in a phosphate buffer saline (PBS) medium at pH 7, 6.5 and 5. The DOX/N,P-CDs solution (10 mL) was dialyzed against a buffer solution at pH 7, 6.5 and 5 and kept in the dark with gentle stirring. Finally, the concentration of dissociated DOX and the cumulative release rate with respect to the buffer solution was monitored based on the DOX absorbance at 488 nm.402.9. Cell culture
Human cervical cancer cells (HeLa cells) and human pulmonary adenocarcinoma cells (A549 cells) were maintained in DMEM (high glucose) and cultured at 37 °C in a humidified atmosphere containing 5% CO2. The medium was supplemented with 10% newborn bovine serum, penicillin (100 U mL−1) and streptomycin (100 U mL−1).2.10. Cell and bacterial imaging
Bacterial culturing and sample handling were performed in a sterile clean room. S. aureus bacterial fluid was seeded by 1:100 dilution of the culture medium (containing 1.0 g of NaCl, 0.6 g of beef extract and 2.0 g of peptone in 200 mL of ultrapure water). The cultures were incubated at 37 °C whilst shaking until the solution was turbid. Subsequently, the N,P-CD solution was diluted to a final concentration of 0.5 mg mL−1 by liquid medium and then incubated with N,P-CDs for 6 h at 37 °C whilst shaking. The S. aureus monolayer was washed three times with phosphate-buffered saline (PBS, pH = 7.4) and fixed with 3% paraformaldehyde on a solid for 30 min. Cell uptake was detected using an upright fluorescence microscope.
For mammalian cell imaging, the cellular uptake of DOX/N,P-CDs by A549 cells was investigated using a confocal laser scanning microscope (CLSM). Cells were seeded at a density of 1 × 10⁵ cells per well onto a 35 mm Petri dish and incubated at 37 °C for 12 h. Then, DOX, DOX/N,P-CD, and N,P-CD solutions were diluted to a final concentration of 0.1 mg mL−1, 30 μg mL−1, and 0.5 mg mL−1 by liquid medium, and cells were incubated with the DOX, DOX/N,P-CDs, and N,P-CDs for 3 h at 37 °C. The cell monolayer was washed three times with phosphate-buffered saline (PBS, pH = 7.4) and fixed with 3% paraformaldehyde on a solid for 30 min.41 Cellular uptake and DOX delivery were detected using a confocal laser scanning microscope.
2.11. Effect of pH slow release liquid on cell morphology
First, 50% fused HeLa cells were seeded in 6-well plates and then incubated in 5% CO2 for 24 h. The medium was withdrawn, and 1 mL of the release liquid was added into phosphate-buffered saline (PBS) medium at pH 7, 6.5, and 5. The release liquid was diluted in DMEM to a concentration of 10 μg mL−1. The cell morphology was observed by fluorescence inverted microscopy after incubation in 5% CO2 for 24 h. In the meantime, 50% fused HeLa cells were seeded in 6-well plates and then incubated in 5% CO2 for 24 h. The release liquid (1 mL) was added into a phosphate buffer saline (PBS) medium at pH 7, 6.5, and 5. The release liquid at different pH was diluted in DMEM to a concentration of 10 μg mL−1. The medium was withdrawn after incubated in 5% CO2 for 24 h, and 1 mL of Hoechst 33342 dissolved in DMEM was added. Then, the medium was withdrawn again and washed three times with phosphate-buffered saline (PBS, pH = 7.4). The cell morphology was observed using a fluorescence inverted microscope.422.12. In vitro cytotoxicity assays (MTT)
The biocompatibility of N,P-CDs, DOX, and DOX/N,P-CDs was evaluated. First, HeLa and A549 cells were seeded in 96-well plates at a density of 1 × 10⁴ cells per well and then incubated in 5% CO2 for 24 h. Then, N,P-CDs, DOX, and DOX/N,P-CDs solutions were added and incubated for further 48 h. The N,P-CDs, DOX, and DOX/N,P-CDs solutions were prepared in DMEM to concentrations of the order of 800, 400, 200, 100 and 50 μg mL−1. After 48 h, 20 μL of MTT solution (5 mg mL−1) was added to each well and further incubated for 4 h. The medium was withdrawn, and 100 μL of DMSO was added to each well to dissolve the purple formazan crystals formed. Finally, the absorbance was measured at 562 nm using a BioTek synergy 2 Multi-Mode microplate reader. Untreated cells served as the control group. The relative rate of cell growth was determined from the following formula:| RGR = [(Dt − Db)/(Dnc − Db)] × 100% |
2.13. Hemolytic test
The hemolytic test was tested to evaluate the blood compatibility of N,P-CDs, DOX, and DOX/N,P-CDs. Fresh anticoagulated blood from human volunteers (2 mL) was diluted into 2.5 mL of normal saline solution. Then, samples with various concentrations of N,P-CDs, DOX, and DOX/N,P-CDs were prepared in normal saline solution and kept at 37 °C for 30 min. The diluted blood (0.2 mL) was added to the N,P-CDs, DOX, and DOX/N,P-CD solutions. Mixtures were kept at 37 °C for 60 min, and then centrifuged at 1500 rpm for 10 min. The supernatant was transferred to a 96-well plate where the absorbance was measured at 545 nm using a BioTek synergy 2 Multi-Mode microplate reader. Positive controls consisted of 0.2 mL of diluted blood in 10 mL of deionized water, whereas negative controls consisted of 0.2 mL of diluted blood in 10 mL of normal saline solution. The hemolysis rate was calculated as follows:| Hemolysis rate (%) = [(Dt − Dnc)/(Dpc − Dnc)] × 100% |
2.14. Platelet adhesion test
The synthesized N,P-CDs were dispersed in PVA, placed into a glass surface dish, and finally kept at room temperature for 72 h. Subsequently, the samples were cut into square pieces, immersed in PBS for 24 h, and transferred to a 24-well microtiter plate. After that, 0.5 mL of platelet rich plasma (PRP) were added, and the 24-well microtiter plate was kept at 37 °C. The samples were washed with PBS 3 times, and subsequently the dead bacteria were fixed with a glutaraldehyde solution (2.5%, v/v). Finally, samples were dehydrated with ethanol solutions of different concentrations (25%, 50%, 70%, 80%, 90%, 100%).2.15. Statistical analyses
Data are presented as the mean ± standard deviation (SD). All data used for the charts in this article were obtained from three independent measurements. Statistical analysis of data was performed by one way analysis of variance (ANOVA).3. Results and discussion
3.1. Characterization of GO-ATP
Energy Dispersive X-ray (EDX) spectroscopy showed the characteristic absorption peaks at 1.03 keV and 2.02 keV of Na and P, respectively, which confirmed that ATP had been successfully grafted onto GO (Fig. 1A). The SEM images of GO and GO-ATP are presented in the insets of Fig. 1A, where it can be seen that there is no evident difference between GO and GO-ATP, indicating that ATP does not change the morphology of GO to a certain extent. Moreover, FT-IR spectroscopy also confirmed that ATP had been successfully grafted onto GO (Fig. 1B). Other structural properties of GO-ATP were characterized by XRD (Fig. 1C) and Raman spectroscopy (Fig. 1D). The layer spacing is largest when the mass ratio of GO and ATP reaches 1:4, which basically indicates that the adsorption and chemical bonding of ATP on the GO layer reaches saturation, and the intercalation of ATP molecules is the maximum. Finally, the quality ratio of GO to ATP of 1:4 was selected as the optimal ratio.
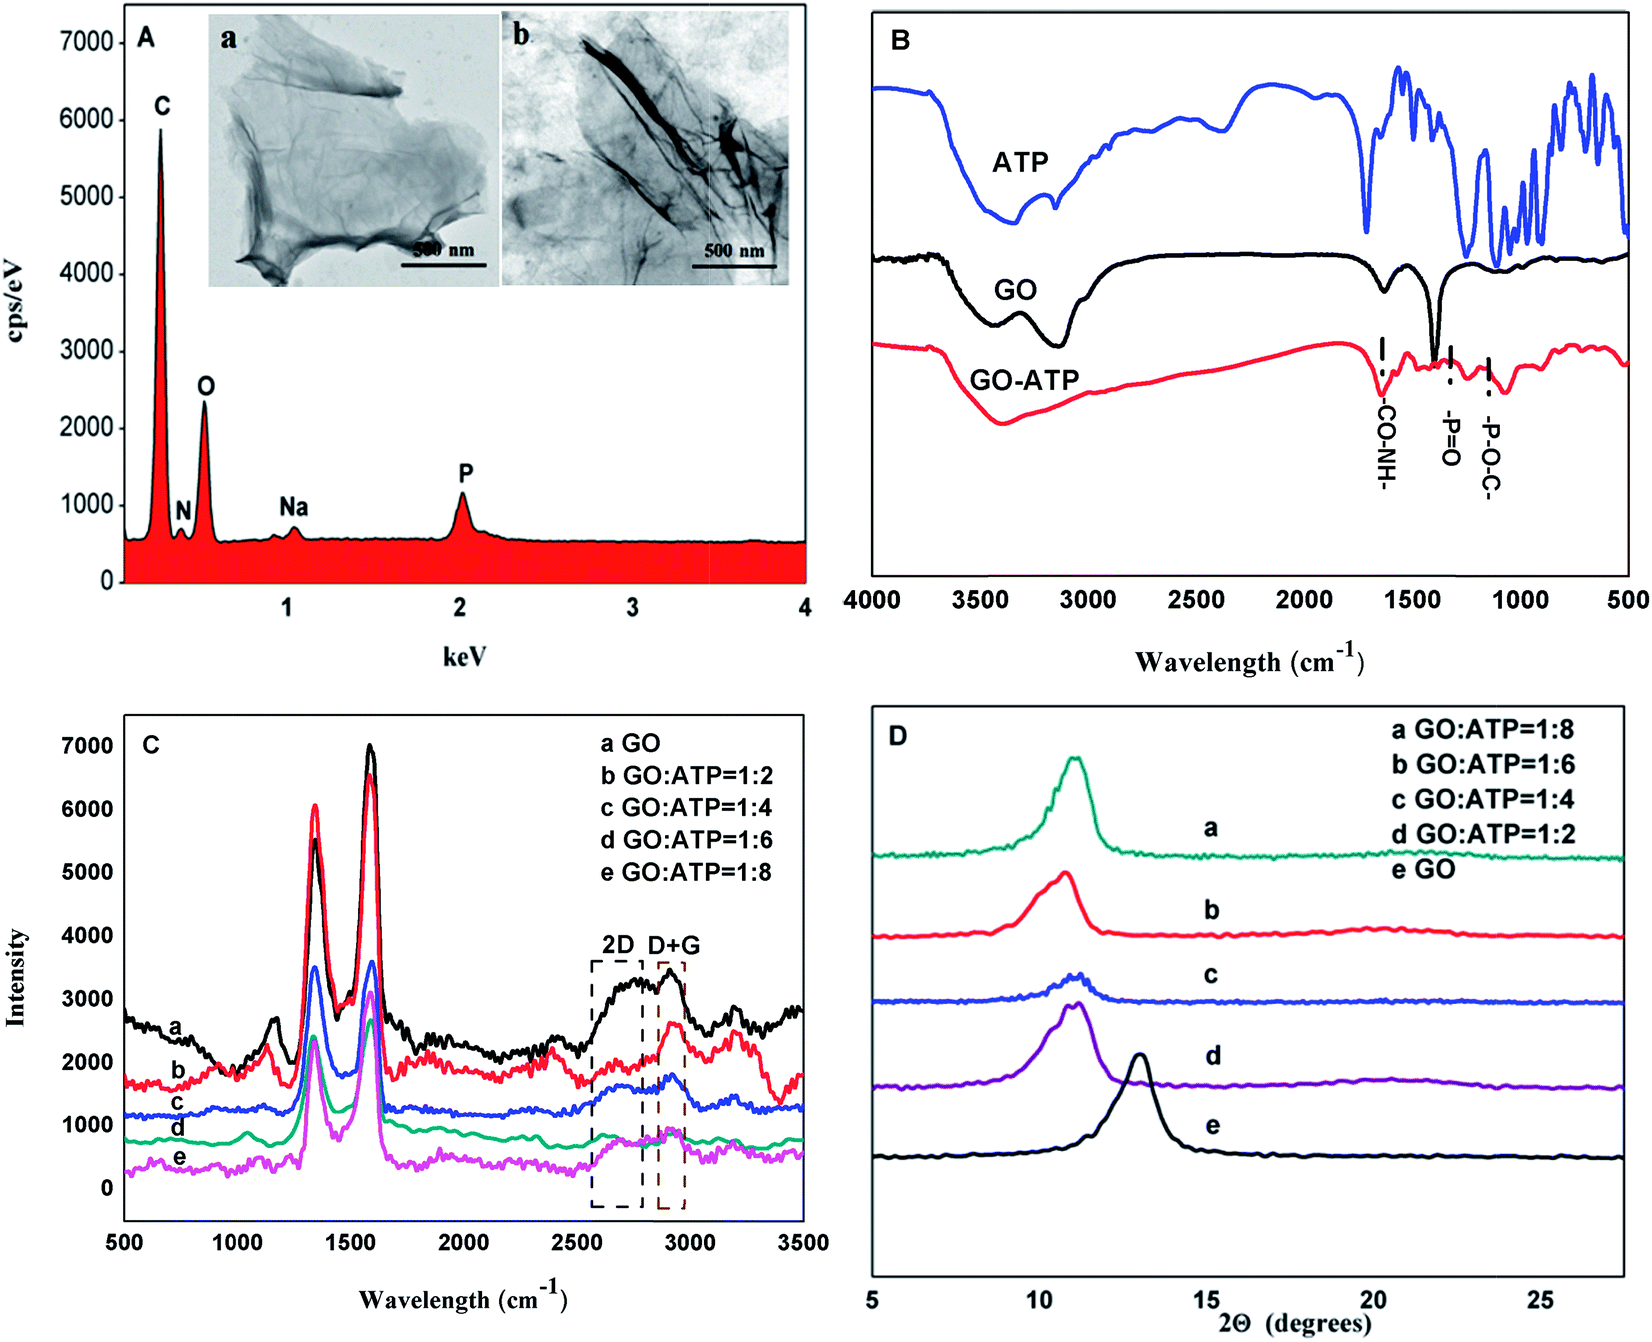 | ||
| Fig. 1 (A) EDX spectrum of GO-ATP. Inset: SEM images of GO (a) and GO-ATP (b). (B) FTIR spectra of ATP, GO and GO-ATP. (C) XRD spectra of GO-ATP with different mass ratios of GO and ATP (D) Raman spectra of GO-ATP with different mass ratios of GO and ATP. | ||
3.2. Characterization of N,P-CDs
N,P-CDs were prepared by a hydrothermal method from a solution containing GO and ATP in a stainless steel autoclave at 200 °C for 10 h (Fig. 2A). The size of the as-prepared N,P-CDs were studied by transmission electron microscopy (TEM) and dynamic light scattering (DLS). The TEM image showed that the N,P-CDs were uniform with an average diameter of 3.8 nm for 200 measured particles, and the HR-TEM image indicated that the carbon phase of N,P-CDs was amorphous (inset of Fig. 2B). Correspondingly, DLS measurements indicated that N,P-CDs were well-dispersed with an average size of ca. 3.8 nm (Fig. S1A†). | ||
| Fig. 2 (A) Schematic representation of the synthesis for N,P-CDs. (B) TEM image of N,P-CDs. The inset shows the particle size distribution histogram and the HR-TEM image of an individual N,P-CD. (C) Excitation-dependent emission shifts of N,P-CDs. (D) Fluorescence response of N,P-CDs at different pHs (5 mM sodium phosphate, pH 2–13). (E) Fluorescence lifetime of N,P-CDs measured by monitoring the emission at 430 nm when excited at 360 nm. | ||
The as-prepared N,P-CDs showed excitation and emission peaks at 360 and 430 nm, respectively (Fig. S2A†). Compared to N,P-CDs prepared from ATP, N,P-CDs prepared from GO-ATP showed a stronger fluorescence (Fig. S2B†) and the surface exhibited a larger number of negative charges (Fig. S1C and F†). Correspondingly, N,P-CDs showed the fluorescence characteristics of other CDs, which depended on the excitation wavelength (Fig. 2C and S2C†). The fluorescence response of N,P-CDs at different pHs was studied. N,P-CDs showed low fluorescence intensity at lower and higher pH values. When pH was 5–9, the fluorescence intensity of N,P-CDs did not change significantly (Fig. 2D and S3†). Therefore, as the pH of cells is generally 5–7, N,P-CDs can be suitable for cell imaging. The fluorescence lifetime of N,P-CDs was 5.85 ns, and the fluorescence decay curves of all N,P-CDs can be fitted by a double-exponential formula (Fig. 2E). Moreover, no decrease in photoluminescence intensity was found after continuous irradiation with UV light for 1 h (Fig. S4†). Furthermore, the fluorescence quantum yield (Φ) of the as-prepared N,P-CDs was calculated to be 11.2%.
The XRD pattern of N,P-CDs is shown in Fig. 3A. The diffraction peak centered at 25° is attributed to the (002) plane of the amorphous carbon phase. The thermal stability of N,P-CDs can be clearly appreciated in Fig. S5.† From 25 to 400 °C, the TGA curve leveled off, indicating the release of H2O, CO and CO2. The incompletely carbonized segment of N,P-CDs was converted to carbon materials at temperatures within the range of 400–800 °C. The FT-IR spectrum of N,P-CDs showed strong sharp peaks at 1626, 1535, and 1445 cm−1, which were attributed to C![[double bond, length as m-dash]](https://www.rsc.org/images/entities/char_e001.gif) O, N–H, and CH2, respectively. The broad absorption peak at 3415 cm−1 is attributed to the stretching vibrations of –OH. Owing to the modification with ATP, the absorption peak of PO43− can also be observed in the FT-IR spectrum (Fig. 3B). The X-ray photoelectron spectrum (XPS) of N,P-CDs, shown in Fig. 3C, revealed that N,P-CDs were mainly composed of carbon, oxygen, nitrogen and phosphorus. The XPS spectrum showed binding energy peaks at 398.3, 530.2, 287.4, 193.4 and 130.2 eV, corresponding to N 1s, O 1s, C 1s, P 2s, and P 2p, respectively. The elemental analysis, shown in the inset of Fig. 3C, showed that the composition of N,P-CDs was: C 55.86 wt%, N 12.31 wt%, P 2.20 wt%, H 10.2 wt%, and O 19.43 wt%. As shown in Fig. 3D, the high-resolution C 1s spectrum displays peaks at 284.3, 284.9, 285.5, 286.1, and 287.3 eV, demonstrating the existence of C–C, C–C, C–OH/C–O–C, CN, and C–O bonds, respectively. The high-resolution N 1s spectrum, in Fig. 3E, shows peaks at 397.8, 398.3, 399, and 399.8 eV, ascribed to C–N–C, N–(C)3, pyridinic-like N, and pyrrolic-like N. In the P 2p spectrum, the peaks at 133.3 and 133.83 eV indicated the existence of P 2p3/2 and P–C bond (Fig. 3F). In the O 1s spectrum of N,P-CDs, shown in Fig. S6,† peaks at 530, 530.6, 531.2, and 531.9 eV were ascribed to O–C–O, P–O, C–OH/C–O–C, and P–O, respectively.
O, N–H, and CH2, respectively. The broad absorption peak at 3415 cm−1 is attributed to the stretching vibrations of –OH. Owing to the modification with ATP, the absorption peak of PO43− can also be observed in the FT-IR spectrum (Fig. 3B). The X-ray photoelectron spectrum (XPS) of N,P-CDs, shown in Fig. 3C, revealed that N,P-CDs were mainly composed of carbon, oxygen, nitrogen and phosphorus. The XPS spectrum showed binding energy peaks at 398.3, 530.2, 287.4, 193.4 and 130.2 eV, corresponding to N 1s, O 1s, C 1s, P 2s, and P 2p, respectively. The elemental analysis, shown in the inset of Fig. 3C, showed that the composition of N,P-CDs was: C 55.86 wt%, N 12.31 wt%, P 2.20 wt%, H 10.2 wt%, and O 19.43 wt%. As shown in Fig. 3D, the high-resolution C 1s spectrum displays peaks at 284.3, 284.9, 285.5, 286.1, and 287.3 eV, demonstrating the existence of C–C, C–C, C–OH/C–O–C, CN, and C–O bonds, respectively. The high-resolution N 1s spectrum, in Fig. 3E, shows peaks at 397.8, 398.3, 399, and 399.8 eV, ascribed to C–N–C, N–(C)3, pyridinic-like N, and pyrrolic-like N. In the P 2p spectrum, the peaks at 133.3 and 133.83 eV indicated the existence of P 2p3/2 and P–C bond (Fig. 3F). In the O 1s spectrum of N,P-CDs, shown in Fig. S6,† peaks at 530, 530.6, 531.2, and 531.9 eV were ascribed to O–C–O, P–O, C–OH/C–O–C, and P–O, respectively.
 | ||
| Fig. 3 (A) XRD pattern of N,P-CDs. (B) FT-IR spectrum of N,P-CDs. (C) XPS spectrum of N,P-CDs. (D) C 1s XPS spectrum of N,P-CDs. (E) N 1s XPS spectrum of N,P-CDs. (F) P 2p XPS spectrum of N,P-CDs. | ||
3.3. Characterization of DOX/N,P-CDs
It can be observed in Fig. 4A that DOX has a characteristic absorption peak at 485 nm. On the other hand, the UV-vis absorption spectrum of DOX/N,P-CDs, in addition to the absorption peak at 325 nm, also has the characteristic absorption peak at 488 nm of DOX, which showed that adriamycin had been successfully grafted onto the surface of N,P-CDs. Additionally, the attachment of DOX onto the surface of N,P-CDs was also confirmed by 1H-NMR, 13C-NMR and zeta potentials (Fig. 4B). The zeta potentials of N,P-CDs, DOX, and DOX/N,P-CDs were −28.1, 12.7, and −11.2 mV, respectively. The average DOX/N,P-CD particle size is shown in the TEM image (Fig. 4C) and DSL (Fig. S1B†). The DOX/N,P-CD particle size was ca. 85 nm, suggesting that carbon dots were decorated by DOX. The release of DOX from the DOX/N,P-CD prodrug was evaluated. The release rates gradually increased upon increasing pH (Fig. 4D). The loading and release of DOX were monitored by observing the quenching and recovery of DOX fluorescence (Fig. S7A†). When pH was 7, 6.5, and 5, the release rates were 7%, 38%, and 72% of the total DOX, respectively. Meanwhile, particle size stability tests verified that the drug was released at lower pHs (Fig. S7B†). For cell viability studies, cells were incubated with different doses of N,P-CDs, DOX and DOX/N,P-CDs for 48 h, and the results are shown in Fig. 4E and F. With N,P-CDs, the normal growth of HeLa and A549 cells was maintained, so N,P-CDs appeared to be biocompatible. However, cell growth inhibition with both DOX/N,P-CDs and free DOX gradually increased upon increasing DOX concentration and incubation time. Interestingly, DOX/N,P-CDs exhibited a similar cytotoxicity profile as DOX, demonstrating that N,P-CDs did not affect DOX efficacy. | ||
| Fig. 4 (A) UV-vis absorption spectra of N,P-CDs, DOX, and DOX/N,P-CDs. (B) 1H-NMR and 13C-NMR of DOX/N,P-CDs. (C) TEM image of DOX/N,P-CDs. Scale bar = 200 nm. (D) DOX release profile from the DOX/N,P-CD prodrug at 37 °C. (E) Cytotoxicity evaluation of N,P-CDs, DOX, and DOX/N,P-CDs towards A549 cells after 48 h culturing. (F) Cytotoxicity evaluation of N,P-CDs, DOX, and DOX/N,P-CDs towards HeLa cells after 48 h culturing. | ||
It is known that for a nanomaterial to have potential applications as a drug or implanted device, a hemolysis rate lower than 5% is required. Hemolysis testing was conducted to asses the hemolysis properties of N,P-CDs, DOX, and DOX/N,P-CDs. Hemoglobin was released from the blood cells when blood cells were destroyed. As shown in Fig. 5, N,P-CDs and DOX/N,P-CDs exhibited a similar hemolysis rate, whereas DOX showed a much higher hemolysis rate. As shown in Fig. 5, the morphology of red blood cells (RBCs) did not undergo any changes in the presence of DOX/N,P-CDs as compared to the negative and positive controls, not even at a high concentrations (50 μg mL−1) of DOX/N,P-CDs. These results indicate that DOX/N,P-CDs are safe for blood-contact applications and suitable for intravenous administration. Moreover, there was more platelet adhesion on the surface of pristine PVA (Fig. 5E), whereas on the surface of PVA containing N,P-CDs platelet adhesion was relatively less (Fig. 5F), proving that N,P-CDs have a good anticoagulant/hemorrhagic properties and blood compatibility.
 | ||
| Fig. 5 Optical images of RBCs from negative control (A), positive control (B) and 50 μg mL−1 DOX/N,P-CD solution (C). (D) N,P-CDs, DOX, and DOX/N,P-CDs with different concentrations of hemolysis rate. SEM images of platelet rich plasma incubated on pristine PVA (E) and PVA containing N,P-CDs (F). Scale bar = 5 μm. | ||
3.4. Cell morphological analysis
Control groups presented uniformly distribution and didn't inhibite the proliferation of HeLa cells. However, in the experimental groups treated at different pH values with slow-release solution, cells appeared to contain numerous vesicles and presented an uneven surface (Fig. S8i†), indicating that the slow-release solution for HeLa cells also has very good inhibitory effect. The same results can be observed from Fig. S8ii,† where fewer labeled cells could be observed when cells were treated at different pHs with slow-release DOX/N,P-CD solution. These results suggested that the sustained release of the DOX/N,P-CD solution caused chromatin damage in the cells. It was confirmed that the drug activity of DOX in the sustained-release solution was maintained, and that N,P-CDs could be a long-acting, controlled-release drug carrier.3.5. Cell imaging
In vitro cellular imaging of N,P-CDs is an important test for evaluating drug delivery vehicles. Interestingly, the confocal fluorescence microscopy images showed that N,P-CDs were easily taken up by S. aureus and A549 cells. Fig. S9† displays green bacterial images, confirming that N,P-CDs could target A549 cells and S. aureus. As shown in Fig. S9B,† a large number of N,P-CDs were distributed throughout the cell, indicating that N,P-CDs can be used in both cell imaging and drug delivery.3.6. Entry of DOX/N,P-CDs into cells
A drug delivery system needs to be absorbed by the cell. The high affinity binding of DOX and N,P-CDs increases their intracellular uptake as a result of receptor-mediated endocytosis (Fig. 6H). The DOX molecules on the surface of N,P-CDs do not have a remarkable effect on cellular uptake. Green light was observed due to the excitation-dependent emission of N,P-CDs, and green light was also observed in the membrane, cytoplasm and nucleus of A549 cells. The same results can be observed from Fig. S9B.† As shown in Fig. 6, the red fluorescence of DOX was found in the cell nucleus and cytoplasm, suggesting that DOX could be released from DOX/N,P-CDs to enter into the cell nucleus. Furthermore, after 3 hours of incubation, the fluorescence of A549 cells treated with DOX/N,P-CDs was measured by Image J (Fig. S10†), and we found that DOX was released from the DOX/N,P-CDs and had penetrated into the cell nucleus. The confocal microscopy studies revealed that DOX/N,P-CDs exhibited a higher cellular uptake. Thus, this multifunctional nanocarrier system could be a promising nanosized anticancer drug carrier with excellent targeting abilities. | ||
| Fig. 6 LSCM images of A549 cells incubated with DOX/N,P-CDs for 3 h observed under (A) bright field, (B) 488 nm, and (C) 543 nm; (D) merged images of (B) and (C). LSCM images of A549 cells incubated with free DOX for 3 h observed under (E) bright field and (F) 543 nm; (G) merged images of (E) and (F). Scale bar = 20 μm. (H) Schematic illustration of the intracellular release of DOX from the DOX/N,P-CD-based drug delivery system. | ||
4. Conclusion
In this study, fluorescent N,P-CDs could be obtained via a facile and green method. The structure of N,P-CDs was characterized by NMR, UV-vis, XPS and FTIR analysis, and suggested that N and P were successfully grafted onto CDs. DOX/N,P-CDs showed a pH-dependent release, that is, the drug was released faster in a buffer solution at pH 5 than at pH 7.4. Furthermore, DOX/N,P-CDs showed a rapid cellular uptake and retained pharmacodynamic activity of DOX. The prepared fluorescent composite material has a good solubility in water, is biocompatible and exhibits low toxicity. Owing to its excellent properties, the prepared composite material has a broad range of desirable applications in biological labeling and bioimaging.Acknowledgements
This project was supported by the Jiangsu sixth category outstanding talent (2012-NY-031), the science and technology support plan of the Jiangsu province (BE2014327, BE2015367), the Jiangsu Agriculture Science and Technology Innovation Fund CX(15)1016, JHB05-21 and Nanjing-321, and the Priority Academic Program Development of the Higher Education Institutions of Jiangsu (PAPD).References
- T. Feng and Y. Zhao, Nanomaterial-Based Drug Delivery Carriers for Cancer Therapy, Springer, Singapore, 2017, pp. 15–54 Search PubMed.
- Q. Gu, W. Chen and F. Duan, et al., Dalton Trans., 2016, 45(30), 12137–12143 RSC.
- A. Yadav and S. J. S. Flora, Expert Opin. Drug Delivery, 2016, 1–11 CrossRef PubMed.
- P. C. B. Faria, L. I. Santos and J. P. Coelho, et al., Nano Lett., 2014, 14(9), 5458–5470 CrossRef CAS PubMed.
- J. Chen, Y. Li and K. Lv, et al., Sens. Actuators, B, 2016, 224, 298–306 CrossRef CAS.
- J. B. Essner, C. H. Laber and S. Ravula, et al., Green Chem., 2016, 18(1), 243–250 RSC.
- M. Havrdova, K. Hola and J. Skopalik, et al., Carbon, 2016, 99, 238–248 CrossRef CAS.
- Q. Zeng, D. Shao and X. He, et al., J. Mater. Chem. B, 2016, 4(30), 5119–5126 RSC.
- T. Feng, X. Ai and G. An, et al., ACS Nano, 2016, 10(4), 4410–4420 CrossRef CAS PubMed.
- J. Jiao, C. Liu and X. Li, et al., J. Colloid Interface Sci., 2016, 483, 343–352 CrossRef CAS PubMed.
- Y. Zhang, L. Han and Y. Zhang, et al., Nanotechnology, 2016, 27(35), 355102 CrossRef PubMed.
- S. T. Yang, L. Cao and P. G. Luo, et al., J. Am. Chem. Soc., 2009, 131(32), 11308–11309 CrossRef CAS PubMed.
- L. Wang, C. Cheng and S. Tapas, et al., J. Mater. Chem. A, 2015, 3(25), 13357–13364 CAS.
- E. A. Lefrak and S. Rosenheim, et al., Cancer, 1973, 32(2), 302–314 CrossRef CAS PubMed.
- K. M. Tewey, T. C. Rowe and L. Yang, et al., Science, 1984, 226(4673), 466–468 CAS.
- B. K. Sinha, A. Kumar and S. Bhattacharjee, et al., J. Pharmacol. Exp. Ther., 2013, 347(3), 607–614 CrossRef CAS PubMed.
- A. J. Weiss and R. W. Manthel, Cancer, 1977, 40(5), 2046–2052 CrossRef CAS PubMed.
- T. Minko, P. Kopečková and J. Kopeček, Pharm. Res., 1999, 16(7), 986–996 CrossRef CAS.
- Q. Xie, M. Y. Wu and D. X. Zhang, et al., World J. Gastroenterol., 2016, 22(32), 7342 CrossRef PubMed.
- M. Aryal, N. Vykhodtseva and Y. Z. Zhang, et al., J. Controlled Release, 2013, 169(1), 103–111 CrossRef CAS PubMed.
- Y. Shu, J. Lu and Q. X. Mao, et al., Carbon, 2017, 114, 324–333 CrossRef CAS.
- D. M. Green, N. E. Breslow and J. B. Beckwith, et al., J. Clin. Oncol., 1998, 16(1), 237–245 CAS.
- H. G. Keizer, H. M. Pinedo and G. J. Schuurhuis, et al., Pharmacol. Ther., 1990, 47(2), 219–231 CrossRef CAS PubMed.
- L. Bigotte and Y. Olsson, Acta Neuropathol., 1983, 61(3–4), 161–168 CrossRef CAS PubMed.
- Y. Zhang, L. Ge and M. Li, et al., Chem. Commun., 2014, 50(12), 1417–1419 RSC.
- Q. Wang, X. Huang and Y. Long, et al., Carbon, 2013, 59, 192–199 CrossRef CAS.
- H. Ding, F. Du and P. Liu, et al., ACS Appl. Mater. Interfaces, 2015, 7(12), 6889–6897 CAS.
- H. Jia, J. Zhu and X. Wang, et al., Biomaterials, 2014, 35(19), 5240–5249 CrossRef CAS PubMed.
- J. Z. Du, X. J. Du and C. Q. Mao, et al., J. Am. Chem. Soc., 2011, 133(44), 17560–17563 CrossRef CAS PubMed.
- R. Jelinek, Bioimaging Applications of Carbon-Dots, Springer International Publishing, 2017, pp. 61–70 Search PubMed.
- Q. Zhang, F. Liu and K. T. Nguyen, et al., Adv. Funct. Mater., 2012, 22(24), 5144–5156 CrossRef CAS.
- D. Samanta, J. L. Meiser and R. N. Zare, Nanoscale, 2015, 7(21), 9497–9504 RSC.
- S. M. Sharker, S. M. Kim and S. H. Kim, et al., J. Mater. Chem. B, 2015, 3(28), 5833–5841 RSC.
- H. Wang, J. Di and Y. Sun, et al., Adv. Funct. Mater., 2015, 25(34), 5537–5547 CrossRef CAS.
- S. L. D'souza, B. Deshmukh and J. R. Bhamore, et al., RSC Adv., 2016, 6(15), 12169–12179 RSC.
- B. Wang, S. Wang and Y. Wang, et al., Biotechnol. Lett., 2016, 38(1), 191–201 CrossRef CAS PubMed.
- N. Zhou, D. Xu and J. Zhang, et al., J. Biomed. Mater. Res., Part A, 2012, 100(6), 1623–1627 CrossRef PubMed.
- X. Wang, N. Zhou and J. Yuan, et al., J. Mater. Chem., 2012, 22(4), 1673–1678 RSC.
- X. Gong, Q. Zhang and Y. Gao, et al., ACS Appl. Mater. Interfaces, 2016, 8(18), 11288–11297 CAS.
- A. R. Chowdhuri, S. Tripathy and C. Haldar, et al., J. Mater. Chem. B, 2015, 3(47), 9122–9131 RSC.
- Z. Wang, H. Liao and H. Wu, et al., Anal. Methods, 2015, 7(20), 8911–8917 RSC.
- J. Tan, N. Meng and Y. Fan, et al., Mater. Sci. Eng., C, 2016, 61, 681–687 CrossRef CAS PubMed.
Footnote |
| † Electronic supplementary information (ESI) available. See DOI: 10.1039/c6ra27887f |
| This journal is © The Royal Society of Chemistry 2017 |