 Open Access Article
Creative Commons Attribution 3.0 Unported Licence
Facile design of a ZnO nanorod–Ni core–shell composite with dual peaks to tune its microwave absorption properties
Jiushuai Denga,
Qibiao Wangb,
Yuanyuan Zhouc,
Biao Zhao *c and
Rui Zhangc
aState Key Laboratory of Complex Nonferrous Metal Resources Clean Utilization, Faculty of Land Resource Engineering, Kunming University of Science and Technology, Kunming, Yunnan 650093, China
bSHCC Design & Science Research Institute, Shanghai 200032, China
cHenan Key Laboratory of Aeronautical Materials and Application Technology, Zhengzhou University of Aeronautics, Zhengzhou, Henan 450046, China. E-mail: biao_zhao@zzia.edu.cn; Fax: +86-371-60632600; Tel: +86-371-60632007
First published on 30th January 2017
Abstract
In this study, we report a facile one-pot hydrothermal way to prepare magnetic-dielectric Ni/ZnO composites. The effects of different solvents on the sizes and morphologies were investigated. The as-synthesized composites were characterized by X-ray diffraction, scanning electron microscopy, vibrating sample magnetometry, transmission electron microscopy (TEM), and vector network analyses. The results showed that the viscosity of the solvents plays an important role in determining the sizes and morphologies of the Ni/ZnO products. All of the three Ni/ZnO products possessed two wide attractive absorption bands, which could broaden the effective absorption bandwidth. The absorption peaks located at a relatively high frequency were related to strong dielectric resonances, which could induce a high eddy current effect, therefore prompting microwave absorption. Among the three Ni/ZnO composites, the core–shell Ni@ZnO prepared in ethylene glycol solution exhibited the best microwave absorption properties. The optimal reflection loss was −30.2 dB and the effective bandwidth (RL below −10 dB, meaning 90% microwave absorption) could be adjusted in the frequency range of 9.6–14.3 GHz with a low thickness of 1.7–2.5 mm. The outstanding absorption was attributed to suitable impedance matching, an antenna receiver mechanism and a point charge effect, and the interfacial polarization. This study reports a simple method to design a magnetic metal-dielectric semiconductor absorber.
1. Introduction
With the rapid development of electromagnetic (EM) wave technology in the civilian and military fields, such as wireless networks, smartphones, computers, and satellite communications, a number of serious electromagnetic interference (EMI) issues have emerged in daily life, which represent a serious pollution problem.1–5 Note that electromagnetic waves can break DNA, weaken the biological immune systems, and extensively threaten human health.6–9 Hence, there is an urgent need to seek a functional material with efficient EM attenuation, and consequently, many efforts have been devoted to the fabrication of a variety of novel materials to be used as microwave absorbers.10,11 A microwave absorber is a functional material that converts EM energy into other energy types or dissipates EM waves by interference.12,13 Furthermore, it is accepted that microwave absorbing materials should be lightweight, thin, and have a strong absorption ability and wide absorption frequencies.14It is well-known that the microwave absorption properties are manly affected by the microstructure and the dielectric and magnetic losses of the absorbers.15 According to the microwave absorption mechanism, the absorbers can be classified into two categories: dielectric loss materials and magnetic loss materials. Nowadays, for obtaining superior microwave absorption, functional composites containing not only magnetic loss features but also a dielectric loss composition should be designed. These dielectric-magnetic absorbers may possess outstanding microwave absorption properties due to the synergistic effect among their constituents. To date, many types of dielectric-magnetic microwave absorbing materials have been reported such as Ni/SnO2,16 Co/TiO2,7 Ni/BaTiO3,17 Co/C,18 Fe3O4/graphene,19 Fe3O4/ZnO,20 Fe3O4/SiC,21 and hollow carbon@Fe@Fe3O4.22 In these composites, the combination of dielectric loss with magnetic loss renders the materials with superior microwave absorption properties. In particular, the microwave absorption properties of core–shell structured composites, such as Ni@polyaniline,23 Ni/polypyrrole,24 CuO/Cu2O-coated Ni,25 Ni@TiO2,26 and PS@PPy@Ni27 composites, have been investigated in detail. Based on these results, it can be concluded that the cooperation effects between magnetic loss and dielectric loss as well as the interfacial polarization are conductive to an improvement in the materials' microwave absorption capabilities. However, there are limited reports on the microwave-absorption properties of Ni/ZnO composites.
Currently, Ni has been extensively studied in the area of microwave absorption due to its high permeability at GHz frequency ranges and easy preparation, as well as low-cost.28 A few recent studies showed that ZnO could also be used as a microwave absorption material due to its dielectric semi-conductive properties and microwave absorption properties that are closely associated with its morphology.29,30 Liu31 prepared Ni/ZnO nanocapsules by a modified arc-discharge technique, and these Ni/ZnO nanocapsules show excellent microwave absorption properties. In our previous study,32 core–shell structured Ni/ZnO (ZnO polyhedron coating) composites with superior absorption were fabricated by a two-step method. The microwave absorption mainly originated from the core–shell structure and ZnO polyhedrons. However, the preparation of these Ni/ZnO hybrids involved a complex process or harsh condition, which restrict the application of Ni/ZnO. In this study, a facile one-pot hydrothermal method was applied to prepare Ni/ZnO composites. The morphologies of the Ni/ZnO composites could be modulated by controlling the solvents. A core–shell composite composed of ZnO nanorods grown on Ni particles showed outstanding microwave absorption. This study provides a lead to design dielectric-magnetic absorber via an economical and simple method.
2. Experimental section
2.1 Materials
All the chemical reagents applied in the experiments were of commercial grade and used without further modification. Nickel chloride hexahydrate (NiCl2·6H2O), and glycerol were provided from Xilong Chemical Reagent Co. Ltd. (Guangdong, China). Hydrazine hydrate, ethylene glycol, Zn(CH3COO)2·2H2O, and absolute ethanol were supplied from Kaitong Chemical Reagent Co., Ltd. (Tianjin, China).2.2 Synthesis of Ni/ZnO composites
The Ni/ZnO composites were successfully synthesized by a facile one-pot method. Briefly, NiCl2·6H2O (1.2 g, 5.0 mmol) and Zn(CH3COO)2·2H2O (2.2 g, 10 mmol) were slowly dissolved in a mixture containing 30 mL distilled water and 30 mL absolute ethanol under magnetic stirring. Then, hydrazine hydrate (8 mL) was slowly added to the abovementioned mixture solution. After the solution was magnetically stirred for 1 h at room temperature, the solution was moved into a Teflon-lined stainless-steel autoclave (100 mL capacity). The autoclave was then sealed and kept at 140 °C for 15 h, and then naturally cooled down to room temperature. The obtained Ni/ZnO composites were then rinsed several times with ethanol and distilled water. Finally, the products were dried under vacuum at 80 °C for 12 h. To investigate the influence of the morphology of Ni/ZnO composites on the electromagnetic properties, 30 mL absolute ethanol was subsequently replaced by 30 mL ethylene glycol and 30 mL glycerol. For convenience, the Ni/ZnO composites synthesized in the solutions, including absolute ethanol, 1,2-propanediol, and glycerol were denoted as Sample A, Sample B, and Sample C, respectively.2.3 Characterization
Phase analysis of the products was performed by powder X-ray diffraction (XRD, Rigaku SmartLab) using a Cu Kα radiation (λ = 0.15418 nm). The surface morphologies of the samples were characterized using field emission scanning electron microscopy (FESEM, JEOL JSM-7001F), whereas associated energy-dispersive X-ray spectroscopy (EDS Oxford Instruments) was carried out to analyze the elemental compositions of the composites. The transmission electron microscopy (TEM) and high resolution TEM (HRTEM) images were observed using a JEOL JEM-2010 transmission electron microscope. The magnetic hysteresis loops of the samples were characterized using a vibrating sample magnetometer (VSM, LakeShore 7407) at room temperature. An Agilent N5234A vector network analyzer (Agilent, USA) was applied to measure the complex relative permeability (μr = μ′ − jμ′′) and permittivity (εr = ε′ − jε′′) in the frequency range of 0.1–15 GHz for the simulation of the reflection loss. Prior to measurement, mixtures of 50 wt% of the obtained samples and paraffin wax at a certain mass ratio were formed into a suitable ring-shaped sample (outer diameter of 7 mm, inner diameter of 3 mm) with a tunable layer thickness, in which paraffin wax was used as the binder. Finally, the reflection loss (RL, which can describe the microwave absorption) values of the samples with various layer thicknesses could be simulated on the basis of the following equations:6,16,26,33
RL = 20![[thin space (1/6-em)]](https://www.rsc.org/images/entities/char_2009.gif) log10|(Zin − Z0)/(Zin + Z0)| log10|(Zin − Z0)/(Zin + Z0)|
| (1) |
 | (2) |
3. Results and discussion
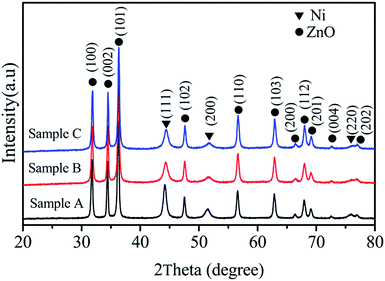
Crystal structures of the synthesized samples were investigated by XRD, and the corresponding results are shown in Fig. 1. Note that the final products prepared in various solvent solutions were composed of Ni and ZnO. For the three Ni/ZnO composites, it can be found that the circle-shaped symbols denote the diffraction peaks of ZnO, and these peaks are well-consistent with the values from the standard card of JCDPS 36-1451. The characteristic peaks at 2θ = 44.7°, 52.0°, and 76.6° could be assigned to the (111), (200), and (220) planes of Ni (JCPDS no. 04-0850). Thus, the XRD results demonstrate the coexistence of ZnO and Ni. The following equations can be used to describe this synchronous reaction process:34,35| Ni2+ + 3N2H4 → [Ni(N2H4)3]2+ | (3) |
| [Ni(N2H4)3]2+ + N2H4 → Ni + 4NH3 + N2 + ½H2 + 2H+ | (4) |
| N2H4·H2O + 2H2O → 2NH4+ + 2OH− | (5) |
| Zn2+ + 2OH− → Zn(OH)2 → ZnO + H2O | (6) |
No diffraction peaks from other materials could be observed, indicating the high purity of the products. Moreover, we also observed that the viscosity of the solvent solution can also affect the crystallinity of Ni in the Ni/ZnO composites.
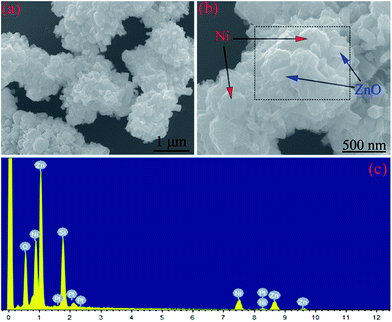
The morphology and microstructure of the Ni/ZnO composites were examined by FESEM. Fig. 2 shows the FESEM images and EDS pattern of the Ni/ZnO composites prepared in the solvent solution containing 30 mL distilled water and 30 mL ethanol. Based on the EDS result (Fig. 2c), it could be found that the as-obtained Ni/ZnO composites were made up of Ni, Zn, and O elements. The existence of the Si peaks originate from the Si slice to support the samples during observation. Pt peaks were also found in the EDS profile because the SEM sample was fabricated by coating platinum onto the sample. From the overview observation (Fig. 2a), interestingly, there are a large number of nanorods radiating from the center. Moreover, plenty nanoparticles can also be observed on the surfaces of the nanorods. With magnification of the FESEM image (Fig. 2b), it can be clearly seen that the nanoparticles are scattered among the nanorods. It is well-known that ZnO is prone to form a one-dimensional structure due to its unique hexagonal wurtzite crystal structure.29,36,37 In combination with XRD analysis, we deduced that the nanorods and nanoparticles were ZnO and Ni products. Under the condition of 30 mL distilled water and 30 mL ethanol, Ni and ZnO did not generate chemical bonds and formed a special structure (such as a core–shell structure). The synthesized Ni/ZnO is only a mixture of scattered Ni nanoparticles and radial-shaped ZnO particles.
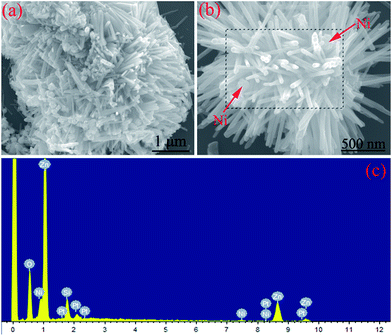 | ||
| Fig. 2 (a and b) Different magnification FESEM images and (c) EDS pattern of Ni/ZnO prepared in the solvent solution containing 30 mL distilled water and 30 mL ethanol. | ||
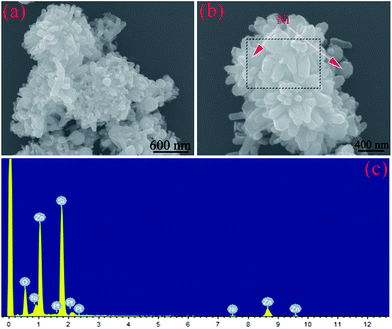
Fig. 3 shows the SEM images and EDS pattern of the Ni/ZnO composites (Sample B) prepared in the solvent solution containing 30 mL distilled water and 30 mL ethylene glycol. From the EDS pattern (Fig. 3c) of the Ni/ZnO composite (marked in Fig. 3b), it could be concluded that the Ni/ZnO composites were made up of Ni, Sn, and O elements. From the different magnification FESEM images (Fig. 3a and b), interestingly, the dispersed Ni and radial-shaped ZnO products are not seen. Instead, we can observe that the ZnO nanorods are grown on Ni nanoparticles to form special core–shell structures. However, the sizes of Ni and ZnO are bigger than those in Sample A, whereas the length of nanorods becomes shorter, which is attributed to the steric hindrance effect of ethylene glycol.38 Thus, it can be concluded that Sample B comprises Ni nanoparticle cores and ZnO nanorod shells. The special core–shell structure is favorable for an enhancement of the microwave absorption properties.10,39
 | ||
| Fig. 3 (a and b) SEM images and (c) EDS pattern of the Ni/ZnO composites prepared in the solvent solution containing 30 mL distilled water and 30 mL ethylene glycol. | ||
When the solvent solution was further changed and glycerol replaced ethanol, it was found that the products were composed of aggregated ZnO nanorods and dispersed Ni nanoparticles (Fig. 4a and b), which is very similar to the case of Sample A. However, with further observation, ZnO could be seen to present an irregular rod-like shape, whereas the Ni particles are scattered among the rods. Note that it could also be seen that Sample C consisted of Ni, ZnO, and O elements according to the EDS result (Fig. 4c). Based on the abovementioned XRD, SEM, and EDS results, we can infer that the various morphologies of the Ni/ZnO composites can be obtained by modulating the solvent solution.
 | ||
| Fig. 4 (a and b) SEM images and (c) EDS pattern of the Ni/ZnO composites prepared in the solvent solution containing 30 mL distilled water and 30 mL glycerol. | ||
For further observing the morphology and structure of the Ni/ZnO composites, the TEM analysis was carried out for the different Ni/ZnO samples prepared at different solvent solution. The TEM images of the samples are depicted in the Fig. 5. As shown in Fig. 5a, it can be clearly seen that Sample A consists of radical-shaped ZnO and dispersed Ni particles. Moreover, some nanoparticles exist among the ZnO nanorods. However, the absence of a special structure or chemical bonds between Ni and ZnO can be noted. Interestingly, for Sample B, the phenomenon that ZnO nanorods are grown on Ni particles to produce core–shell structure can be observed in Fig. 5b. The size and length of the nanorods are bigger and smaller than those of Sample A, respectively. In Fig. 5d, ZnO nanorods and Ni nanoparticles co-exist in Sample C. To further reveal more detailed structural information about the nanorods, the HRTEM and SAED analysis of the nanorods were performed and the results are shown in Fig. 5c and its inset, respectively. The HRTEM image in Fig. 5c clearly exhibits a lattice fringe space of 0.26 nm, which is in accordance with that of the (002) planes of the wurtzite structure of ZnO. The inset of Fig. 5b presents the corresponding selected area electron diffraction (SAED) pattern obtained for the nanorod, which shows the highly crystalline nature and single-crystal feature of the ZnO nanorods.
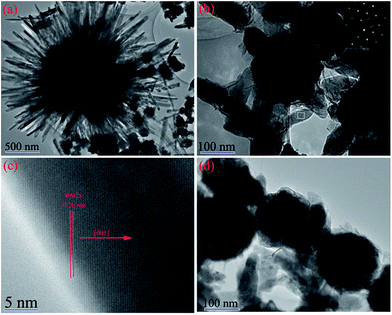 | ||
| Fig. 5 TEM images of the various Ni/ZnO composites: (a) Sample A, (b) Sample B, and (d) Sample C; (c) HRTEM image and SAED pattern (inset in Fig. 5b) for the rectangular area in (b). | ||
It was hypothesized that the physical and chemical properties of the solvents would influence the solubility, reactivity, and diffusion nature of the reagents and finally affect the growth and morphology of the samples. The ranking of the boiling points of the three types of solvents tested herein from low to high was ethanol, ethylene glycol, and glycerol, whereas the viscosity sequence of the solvents was ethanol < ethylene glycol < glycerol.40–43 For the ethanol solvent, its lower boiling point gives rise to the highest pressure in closed reaction systems, which is beneficial for the growth of one-dimensional ZnO; moreover, the lowest viscosity facilitates the fast nucleation. Thus, in the mixture solution containing ethanol, ZnO shows perfect one-dimensional rod-like shapes and self-assemble to form a radical-shaped structure. In the solvent solution containing ethylene glycol or the glycerol solvent, a higher viscosity would hamper the growth rate but have a positive effect on the isotropic growth. Thus, the narrow distribution of the crystallite sizes of Ni and ZnO (big size and short length) could be achieved by increasing the hydroxyl numbers of polyol, which indicates that the expected size distributions and morphologies could be obtained by a diffusion-controlled process in the solution. In particular, for the ethylene glycol solvent, the suitable viscosity and boiling point favored the growth of ZnO nanorods on the Ni particles to generate a core–shell structure.
The field-dependent magnetization of the Ni/ZnO composites was investigated at room temperature using a vibrating sample magnetometer (VSM). As shown in Fig. 6, the three samples presented typical ferromagnetic hysteresis loops. Clearly, the magnetization values are mainly attributed to the presence of Ni constituents in these three samples. In general, a high magnetization value is attributed to a strong μ′ and μ′′ value. In the current study, the magnetization only comes from Ni. It was observed that the saturation magnetization (Ms) values were 17.69, 24.50, and 32.27 emu g−1 for Sample A, Sample B, and Sample C, respectively. These Ms values are smaller than those for bulk Ni (55 emu g−1),44 which is due to the nonmagnetic ZnO composition. The low Ms of the as-prepared Sample A is mainly attributed to the perfect growth of ZnO and small Ni nanoparticles in low viscosity ethanol. The saturation magnetization of the Ni/ZnO composites tends to increase with solvent viscosity. This is due to the isotropic growth of ZnO and as the magnetic properties increased, the metal Ni nanoparticle became larger. At the same time, it can also be found that the coercivity (Hc) of the Ni/ZnO composite slightly changed (inset in Fig. 6). For ferromagnetic materials, the anisotropy energy (Ha) can be expressed as follows:14,45
| Ha = 4|K1|/3μ0Ms | (7) |
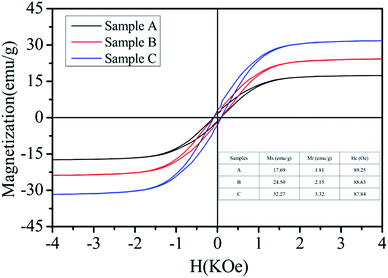 | ||
| Fig. 6 Magnetization curves of the various Ni/ZnO composites measured at room temperature (the inset is the summarized table of the magnetic properties of Ni/ZnO). | ||
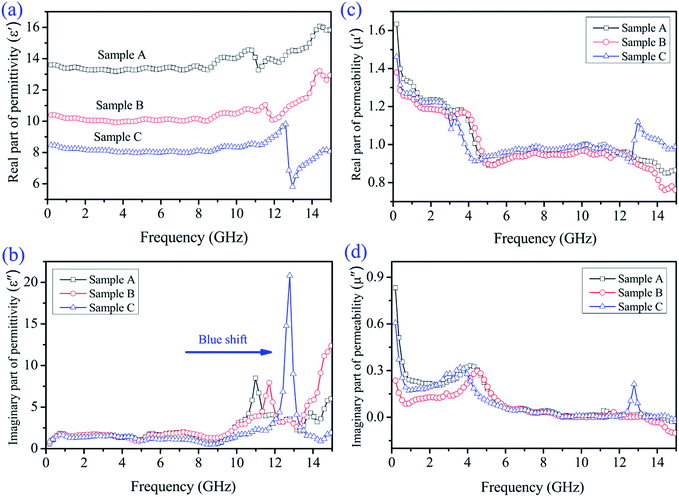
Generally, based on the electromagnetic energy transformation mechanism,46 the reflection and attenuation properties of the microwave absorbing materials are mainly determined by the relative complex permittivity (εr = ε′ − jε′′), the relative complex permeability (μr = μ′ − jμ′′), and a proper matching between the complex permittivity and permeability. The real parts (ε′, μ′) of the complex permittivity/permeability are related with the storage capabilities of the electrical and magnetic energy within the absorber, whereas the imaginary parts (ε′′, μ′′) represent the dissipation (or loss) of the electrical and magnetic energy.47–49 Fig. 7 exhibits the frequency-dependence of the electromagnetic parameters of paraffin composites added with 50 wt% Samples A, B, and C. Fig. 7a shows that the real permittivity (ε′) value decreases from Sample A to C in the investigated region, which is associated with their various morphologies. All the samples exhibited more or less fluctuation, where, in particular, a strong change was observed in the frequency range of 11–13 GHz. The ε′ values of Sample A are the highest among the three Ni/ZnO samples; in other words, this sample features the highest energy storage and polarization.50,51 Fig. 7b shows the imaginary part (ε′′) of the three Ni/ZnO composites, which show a similar trend between the different samples. Sample B presents the highest ε′′ value, which indicates its superior dielectric loss. The curves of the samples present a complicated frequency-dependence behavior. Note that in the range of 11–13 GHz, we can observe a strong resonance peak, which is related to the high conductivity and skin effects, electronic spin, and charge polarization because of the point effects and polarized centers.52,53 This mostly stems from the cooperation effect between Ni nanoparticles and ZnO nanorods. Moreover, based on the free electron theory,7 ε′′ ≈ σ/2πε0f, where σ is the conductivity, it was found that the conductivity of Sample B is higher than that of the other samples in the major measured frequency. This results from the core–shell structure with one-dimensional rod-like ZnO shells connecting with each other to form a conductivity network, which induces conduction. Note that the dielectric resonance peaks show a blue-shift, which is correlated with the high conductivity in the resonance frequency.
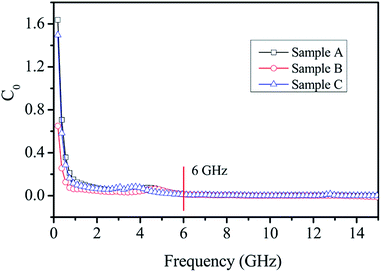
The real part (μ′) and imaginary part (μ′′) of the relative complex permeability of the Ni/ZnO composites are shown in Fig. 7c and d. Both the μ′ and μ′′ of the different Ni/ZnO composites present a similar decreasing trend with the increasing frequency. The μ′ value (Fig. 7c) first exhibits a rapid decrease from 1.6 to 0.9 as the frequency increases from 0.1 to 5.0 GHz, and then the μ′ value keeps relatively constant and shows a fluctuation in the 5.0–12 GHz and 12.0–15.0 GHz ranges, respectively. For the μ′′ value (Fig. 7d), it was found that an obvious resonance peak is located at around 4.0 GHz, which is attributed to the natural resonance of the Ni nanoparticles.54 Furthermore, as for Sample C, another strong resonance peak at about 13.0 GHz can also be observed in the μ′′ value, which corresponds to the strong dielectric loss, and low electric or magnetic energy. As to why there is this condition, it may be attributed to the consumption of the electromagnetic energy,55 and further investigation is underway to assess this notion. Generally, magnetic loss is derived from the hysteresis loss, domain wall resonance, natural resonance, and the eddy current effect. The hysteresis loss from irreversible magnetization is negligible in a weak applied field, whereas the domain wall resonance often takes place in the 1–100 MHz range.56,57 Hence, it is supposed that the natural resonance and eddy current effect contribute to the magnetic loss. If the magnetic loss mainly results from the eddy current effect, the values of C0(C0 = μ′′(μ′)−2f−1) would be equal to a constant value 2πμ0d2σ (where d is the thickness of the absorber, σ is the electrical conductivity, and μ0 is the permeability of a vacuum) and would be independent of the frequency.58 As shown in Fig. 8, the values of C0 drastically decrease in the frequency range of 2.0–8.0 GHz. However, when f is above 6.0 GHz, the values of C0 remain approximately constant. Thus, we can conclude that the magnetic loss is mainly originated from the natural resonance and eddy current effect.
Fig. 9 shows the reflection loss (RL) of the Ni/ZnO samples with different thicknesses versus frequency. At first, to more clearly compare the differences in the microwave absorption properties, the RL values of different Ni/ZnO samples at an absorber layer thickness of 2.0 mm were calculated and are shown in Fig. 9a. Note that all the samples exhibit two wide attractive absorption bands. Moreover, from Sample A to Sample C, the optimal RL peaks shift towards high frequency (blue-shift), which is loosely related with their morphologies. For two RL peaks, the peaks of the three samples are located at high frequency, which is consistent with the strong dielectric resonance (Fig. 7c). This reveals that these RL peaks originate from a strong eddy current effect, which is induced by the high conductivity of the strong resonance. Among the three samples, one can observe that Sample B presents the best microwave absorption properties, which is attributed to its additional core–shell structures between Ni and ZnO nanorods compared with the other two samples. The thickness of the absorber is one of most important factors that not only influence the intensity of the RL peak but also the position of the frequency at the reflection loss minimum. Fig. 9b shows the calculated reflection losses of the core–shell Ni@ZnO (Sample B) composite with different thicknesses. The thickness of Sample B was 2.2 mm, and the minimum reflection loss could reach to −30.2 dB at 10.8 GHz with an efficient frequency bandwidth of about 2.5 GHz at the frequency range of 10.1–12.6 GHz. In fact, the absorption bandwidth is relatively narrow. This may result from the dielectric loss being the main contribution to the absorption, which is mostly apparent in high frequency (>8.0 GHz). The effective bandwidth (RL less than −10 dB, meaning 90% microwave dissipation) can be modulated in the frequency range of 9.6–14.3 GHz with a low thickness of 1.7–2.5 mm. Table 1 shows the microwave absorption properties of some recently reported Ni-based composites.23,24,27,59–63 In comparison with these Ni-based composites, the core–shell structured Ni–ZnO composite shows competitive application in terms of the absorber thickness and absorption efficiency. The frequency at the RL minimum gradually shifts towards lower values with the increasing thickness. The peak shift was attributed to the phenomenon of quarter-wavelength attenuation, in which the absorption meets the phase-match conditions.49,64
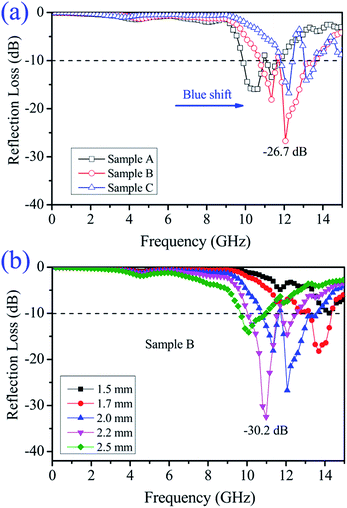 | ||
| Fig. 9 (a) Reflection loss (RL) of the different Ni/ZnO composites with a thickness of 2.0 mm and (b) RL of the core–shell Ni@ZnO (Sample B) composite with various thicknesses. | ||
| Sample | Minimum RL value (dB) | Optimum thickness (mm) | Optimum frequency (GHz) | Frequency range (RL < −10 dB) | Ref. |
|---|---|---|---|---|---|
| Ni fiber | −39.5 | 3.0 | 4.8 | 6.6–8.8 | 59 |
| Ni nanowires | −8.5 | 3.0 | 10 | — | 60 |
| Ni chains | −25.29 | 2.0 | 9.6 | 8.3–10.4 | 61 |
| Ni/SnO2 | −18.6 | 7.0 | 14.7 | 13.8–15.3 | 62 |
| Ni/graphene | −13 | 2.0 | 11.0 | 9.6–12.2 | 63 |
| Ni/polyaniline | −35 | 5.0 | 17.2 | 4.9–6.1 | 23 |
| PS@PPy@Ni | −20.06 | 2.0 | 10.69 | 9.16–13.75 | 24 |
| Ni/polypyrrole | −15.2 | 2.0 | 13.0 | 11–15.4 | 27 |
| Ni/ZnO (sample B) | −30.2 | 2.2 | 10.8 | 10.1–12.6 | This work |
To reveal the internal microwave absorption mechanism behind the EM parameters, the impedance matching ratio (Zr) and attenuation constant (α) of the three Ni/ZnO composites at 0.1–15 GHz were calculated, as shown in Fig. 10. Generally, to design superior absorbing materials, two pivotal factors should be considered. One is the impedance match, requiring the values of permittivity and permeability to tend to be equal, which permits microwaves to enter into the absorber as much as possible.65 The other is the energy attenuation, demanding a strong electromagnetic propagation loss in the interior of the absorbers.66 The impedance matching ratio Zr = |Zin/Z0|7 is shown in Fig. 10a. An absorber exhibits optimal impedance matching if Zr is equal to Z0, and the incident microwave would then obtain zero-reflection at the front surface of the materials. Moreover, on the basis of the transmission line theory, the electromagnetic loss can be expressed by an attenuation constant (α). The EM attenuation constant can be described as follows:17,49
 | (8) |
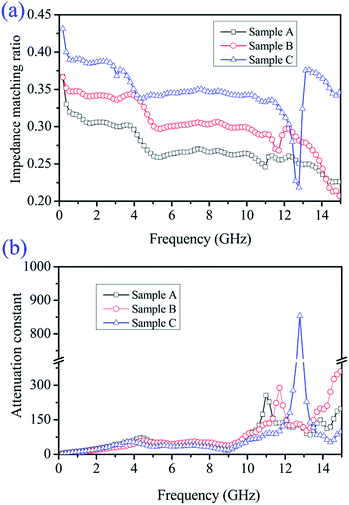 | ||
| Fig. 10 Frequency-dependence of (a) impedance matching ratio (Zr) and (b) attenuation constant (α) of different Ni/ZnO composites. | ||
4. Conclusions
In summary, dielectric-magnetic Ni/ZnO composites with different morphologies were successfully synthesized via a facile one-pot hydrothermal method using different solvents. It was found that the solvents affect the morphologies of the Ni/ZnO composites. The viscosity ranking of the solvents plays a vital role in controlling the sizes and shapes of the Ni/ZnO products. The core–shell Ni@ZnO obtained in the solvent containing ethylene glycol showed excellent microwave absorption properties. The optimal reflection loss minimum was −30.2 dB at 10.8 GHz with an absorber thickness of 2.2 mm. The effective bandwidth (RL less than −10 dB, meaning 90% microwave dissipation) could be modulated in the frequency range of 9.6–14.3 GHz with a low thickness of 1.7–2.5 mm. The superior absorption was attributed to an appropriate impedance match, high attenuation ability, an antenna receiver mechanism, and interfacial polarization. This study paves an easy avenue to design these magnetic metal-dielectric semiconductor absorbers.Acknowledgements
This research project was supported by the National Natural Science Foundation of China (51404119 & 51464029) and the Analysis and Testing Foundation of Kunming University of Science and Technology (2016T20130146).Notes and references
- F. Shahzad, M. Alhabeb, C. B. Hatter, B. Anasori, S. Man Hong, C. M. Koo and Y. Gogotsi, Science, 2016, 353, 1137 CrossRef CAS PubMed.
- H. Wu, G. Wu, Y. Ren, L. Yang, L. Wang and X. Li, J. Mater. Chem. C, 2015, 3, 7677–7690 RSC.
- H. Wu, G. Wu and L. Wang, Powder Technol., 2015, 269, 443–451 CrossRef CAS.
- Y. Ren, L. Yang, L. Wang, T. Xu, G. Wu and H. Wu, Powder Technol., 2015, 281, 20–27 CrossRef CAS.
- W. Hu, L. Wang, Q. Wu and H. Wu, Adv. Powder Technol., 2014, 25, 1780–1785 CrossRef CAS.
- B. Zhao, X. Guo, W. Zhao, J. Deng, G. Shao, B. Fan, Z. Bai and R. Zhang, ACS Appl. Mater. Interfaces, 2016, 8, 28917–28925 CAS.
- X. Zhang, G. Ji, W. Liu, X. Zhang, Q. Gao, Y. Li and Y. Du, J. Mater. Chem. C, 2016, 4, 1860–1870 RSC.
- H. Wu, L. Wang, Y. Wang, S. Guo and Z. Shen, J. Alloys Compd., 2012, 525, 82–86 CrossRef CAS.
- H. Wu, L. Wang, H. Wu and Q. Lian, Appl. Phys. A, 2014, 115, 1299–1307 CrossRef CAS.
- G. Tong, F. Liu, W. Wu, F. Du and J. Guan, J. Mater. Chem. A, 2014, 2, 7373–7382 CAS.
- H. Lv, X. Liang, Y. Cheng, H. Zhang, D. Tang, B. Zhang, G. Ji and Y. Du, ACS Appl. Mater. Interfaces, 2015, 7, 4744–4750 CAS.
- J. Liu, R. Che, H. Chen, F. Zhang, F. Xia, Q. Wu and M. Wang, Small, 2012, 8, 1214–1221 CrossRef CAS PubMed.
- G. Wu, Y. Cheng, Q. Xie, Z. Jia, F. Xiang and H. Wu, Mater. Lett., 2015, 144, 157–160 CrossRef CAS.
- Y. Wang, W. Zhang, X. Wu, C. Luo, T. Liang and G. Yan, J. Magn. Magn. Mater., 2016, 416, 226–230 CrossRef CAS.
- H. Yu, T. Wang, B. Wen, M. Lu, Z. Xu, C. Zhu, Y. Chen, X. Xue, C. Sun and M. Cao, J. Mater. Chem., 2012, 22, 21679–21685 RSC.
- B. Zhao, B. Fan, G. Shao, W. Zhao and R. Zhang, ACS Appl. Mater. Interfaces, 2015, 7, 18815–18823 CAS.
- G.-M. Shi, Y.-F. Li, L. Ai and F.-N. Shi, J. Alloys Compd., 2016, 680, 735–743 CrossRef CAS.
- Y. Lü, Y. Wang, H. Li, Y. Lin, Z. Jiang, Z. Xie, Q. Kuang and L. Zheng, ACS Appl. Mater. Interfaces, 2015, 7, 13604–13611 Search PubMed.
- P. F. Guan, X. F. Zhang and J. J. Guo, Appl. Phys. Lett., 2012, 101, 153108 CrossRef.
- G. Wan, G. Wang, X. Huang, H. Zhao, X. Li, K. Wang, L. Yu, X. Peng and Y. Qin, Dalton Trans., 2015, 44, 18804–18809 RSC.
- C. Liang, C. Liu, H. Wang, L. Wu, Z. Jiang, Y. Xu, B. Shen and Z. Wang, J. Mater. Chem. A, 2014, 2, 16397–16402 CAS.
- H. Lv, G. Ji, W. Liu, H. Zhang and Y. Du, J. Mater. Chem. C, 2015, 3, 10232–10241 RSC.
- X. Dong, X. Zhang, H. Huang and F. Zuo, Appl. Phys. Lett., 2008, 92, 3127 Search PubMed.
- P. Xu, X. Han, C. Wang, D. Zhou, Z. Lv, A. Wen, X. Wang and B. Zhang, J. Phys. Chem. B, 2008, 112, 10443–10448 CrossRef CAS PubMed.
- X. Liu, C. Feng, S. W. Or, Y. Sun, C. Jin, W. Li and Y. Lv, RSC Adv., 2013, 3, 14590–14594 RSC.
- B. Zhao, G. Shao, B. Fan, W. Zhao and R. Zhang, Phys. Chem. Chem. Phys., 2015, 17, 2531–2539 RSC.
- W. Li, T. Qiu, L. Wang, S. Ren, J. Zhang, L. He and X. Li, ACS Appl. Mater. Interfaces, 2013, 5, 883–891 CAS.
- B. Zhao, G. Shao, B. Fan, W. Zhao and R. Zhang, Phys. Chem. Chem. Phys., 2015, 17, 6044–6052 RSC.
- H. Li, Y. Huang, G. Sun, X. Yan, Y. Yang, J. Wang and Y. Zhang, J. Phys. Chem. C, 2010, 114, 10088–10091 CAS.
- G.-S. Wang, Y.-Y. Wu, X.-J. Zhang, Y. Li, L. Guo and M.-S. Cao, J. Mater. Chem. A, 2014, 2, 8644–8651 CAS.
- X. Liu, J. Jiang, D. Geng, B. Li, Z. Han, W. Liu and Z. Zhang, Appl. Phys. Lett., 2009, 94, 053119 CrossRef.
- B. Zhao, G. Shao, B. Fan, W. Guo, Y. Xie and R. Zhang, J. Magn. Magn. Mater., 2015, 382, 78–83 CrossRef CAS.
- M. Qiao, X. Lei, Y. Ma, L. Tian, W. Wang, K. Su and Q. Zhang, J. Alloys Compd., 2017, 693, 432–439 CrossRef CAS.
- H.-J. Song, X.-H. Jia, X.-F. Yang, H. Tang, Y. Li and Y.-T. Su, CrystEngComm, 2012, 14, 405–410 RSC.
- Q. Hu, G. Tong, W. Wu, F. Liu, H. Qian and D. Hong, CrystEngComm, 2013, 15, 1314–1323 RSC.
- H. Yan, R. He, J. Johnson, M. Law, R. J. Saykally and P. Yang, J. Am. Chem. Soc., 2003, 125, 4728–4729 CrossRef CAS PubMed.
- G. Z. Shen, Y. Bando, B. D. Liu, D. Golberg and C.-J. Lee, Adv. Funct. Mater., 2006, 16, 410–416 CrossRef CAS.
- Y. Peng, X. Li, R. Yuan and Y. Xiang, Chem. Commun., 2016, 52, 12586–12589 RSC.
- B. Zhao, G. Shao, B. Fan, W. Guo, Y. Chen and R. Zhang, Appl. Surf. Sci., 2015, 332, 112–120 CrossRef CAS.
- L. Duan, S. Jia and L. Zhao, Mater. Res. Bull., 2010, 45, 373–376 CrossRef CAS.
- L. Zhao, H. Zhang, Y. Xing, S. Song, S. Yu, W. Shi, X. Guo, J. Yang, Y. Lei and F. Cao, Chem. Mater., 2008, 20, 198–204 CrossRef CAS.
- B. Zhao, G. Shao, B. Fan, B. Sun, K. Guan and R. Zhang, J. Mater. Sci.: Mater. Electron., 2014, 25, 3614–3621 CrossRef CAS.
- B. Zhao, G. Shao, B. Fan, Y. Xie and B. W. R. Zhang, J. Mater. Res., 2014, 29, 1431–1439 CrossRef CAS.
- J. Guan, L. Liu, L. Xu, Z. Sun and Y. Zhang, CrystEngComm, 2011, 13, 2636–2643 RSC.
- H. Yuan, Y. Xu, H. Jia and S. Zhou, RSC Adv., 2016, 6, 67218–67225 RSC.
- Y. Yang, M. Li, Y. Wu, T. Wang, E. S. G. Choo, J. Ding, B. Zong, Z. Yang and J. Xue, Nanoscale, 2016, 8, 15989–15998 RSC.
- H. Wang, Z. Yan, J. An, J. He, Y. Hou, H. Yu, N. Ma, G. Yu and D. Sun, RSC Adv., 2016, 6, 92152–92158 RSC.
- B. Zhao, G. Shao, B. Fan, W. Zhao, S. Zhang, K. Guan and R. Zhang, J. Mater. Chem. C, 2015, 3, 10862–10869 RSC.
- B. Zhao, W. Zhao, G. Shao, B. Fan and R. Zhang, ACS Appl. Mater. Interfaces, 2015, 7, 12951–12960 CAS.
- L. Wang, H. Xing, Z. Liu, Z. Shen, X. Sun and G. Xu, RSC Adv., 2016, 6, 97142–97151 RSC.
- H. Wu, G. Wu, Q. Wu and L. Wang, Mater. Charact., 2014, 97, 18–26 CrossRef CAS.
- P. C. P. Watts, W. K. Hsu, A. Barnes and B. Chambers, Adv. Mater., 2003, 15, 600–603 CrossRef CAS.
- B. Zhao, W. Zhao, G. Shao, B. Fan and R. Zhang, Dalton Trans., 2015, 44, 15984–15993 RSC.
- B. Zhao, G. Shao, B. Fan, W. Zhao, Y. Chen and R. Zhang, RSC Adv., 2015, 5, 9806–9814 RSC.
- X. Zhang, P. Guan and X. Dong, Appl. Phys. Lett., 2010, 97, 033107 CrossRef.
- M. Wu, Y. D. Zhang, S. Hui, T. D. Xiao, S. Ge, W. A. Hines, J. I. Budnick and G. W. Taylor, Appl. Phys. Lett., 2002, 80, 4404–4406 CrossRef CAS.
- H. Wu, Q. Wu and L. Wang, Mater. Charact., 2015, 103, 1–10 CrossRef CAS.
- C. Chen, Q. Liu, H. Bi, W. You, W. She and R. Che, Phys. Chem. Chem. Phys., 2016, 18, 26712–26718 RSC.
- C. Gong, J. Zhang, X. Zhang, L. Yu, P. Zhang, Z. Wu and Z. Zhang, J. Phys. Chem. C, 2010, 114, 10101–10107 CAS.
- G. Bo, Q. Liang, W. Jianbo, L. Qingfang, L. Fashen, F. Jie and X. Desheng, J. Phys. D: Appl. Phys., 2008, 41, 235005 CrossRef.
- C. Wang, X. Han, P. Xu, J. Wang, Y. Du, X. Wang, W. Qin and T. Zhang, J. Phys. Chem. C, 2010, 114, 3196–3203 CAS.
- B. Zhao, G. Shao, B. Fan, W. Li, X. Pian and R. Zhang, Mater. Lett., 2014, 121, 118–121 CrossRef CAS.
- Y. Cao, Q. Su, R. Che, G. Du and B. Xu, Synth. Met., 2012, 162, 968–973 CrossRef CAS.
- B. Zhao, G. Shao, B. Fan, W. Zhao, Y. Xie and R. Zhang, J. Mater. Chem. A, 2015, 3, 10345–10352 CAS.
- H. Pan, X. Cheng, C. Zhang, C. Gong, L. Yu, J. Zhang and Z. Zhang, Appl. Phys. Lett., 2013, 102, 012410 CrossRef.
- J. Wang, J. Wang, R. Xu, Y. Sun, B. Zhang, W. Chen, T. Wang and S. Yang, J. Alloys Compd., 2015, 653, 14–21 CrossRef CAS.
- B. Zhao, G. Shao, B. Fan, Y. Xie and R. Zhang, J. Magn. Magn. Mater., 2014, 372, 195–200 CrossRef CAS.
- R. Zhuo, H. Feng, Q. Liang, J. Liu, J. Chen, D. Yan, J. Feng, H. Li, S. Cheng and B. Geng, J. Phys. D: Appl. Phys., 2008, 41, 185405 CrossRef.
- Y. Feng, D. Li, L. Jiang, Z. Dai, Y. Wang, J. An, W. Ren, J. He, Z. Wang, W. Liu and Z. Zhang, J. Alloys Compd., 2017, 694, 1224–1231 CrossRef CAS.
- G. Wu, Y. Cheng, Y. Ren, Y. Wang, Z. Wang and H. Wu, J. Alloys Compd., 2015, 652, 346–350 CrossRef CAS.
| This journal is © The Royal Society of Chemistry 2017 |

