 Open Access Article
Creative Commons Attribution 3.0 Unported Licence
Porphyrin based nano-sized imprinted polymer as an efficient modifier for the design of a potentiometric copper carbon paste electrode†
Hamid Reza Rajabi *,
Arezoo Zarezadeh and
Gholamreza Karimipour
Chemistry Department, Yasouj University, Yasouj, 75918-74831, Iran. E-mail: h.rajabi@mail.yu.ac.ir; Fax: +98 741 2242164; Tel: +98 741 2242164
First published on 7th March 2017
Abstract
In this study, a new carbon paste electrode (CPE) modified with porphyrin-based ion imprinted polymer (IIP) was designed and applied for the potentiometric determination of Cu2+ ions in aqueous solutions. The Cu-IIP was prepared using methacrylic acid, ethyleneglycoldimethacrylate monomers, in the presence of a copper complex of 5,10,15,20-tetrakis(4-hydroxyphenyl)-porphyrin. After polymerization, the prepared polymer was eluted by an aqueous solution of hydrochloric acid to leach the imprinted ions, which results in an obvious change in its color from purple to light brown. By microscopic analysis, the mean particle size of the prepared leached IIP was estimated to be around 60 nm. After characterization, the prepared IIP NPs were used as a modifier to design a modified CPE for potentiometric determination of Cu2+ ions in aqueous solutions. As found, at the optimum paste composition, the modified potentiometric sensor exhibited an excellent Nernstian response (30.15 ± 0.2 mV dec−1) to the logarithm of Cu2+ ion concentration over the concentration range of 4.0 × 10⁻⁹ to 2.0 × 10⁻¹ mol L−1. Moreover, the designed sensor showed a low detection limit (2.0 × 10⁻⁹ mol L−1) with a short response time (∼5 s) and acceptable stability (at least 2 months). In addition, the sensor was successfully applied as a reasonable indicator electrode in potentiometric titration (against EDTA) with high precision and accuracy. Applicability of the IIP NP modified CPE was examined and confirmed by analysis of various water samples for the determination of Cu2+ ions.
1. Introduction
Copper is an essential element present in all organisms, which plays a key role during cell respiration, blood formation, as well as in the function of endocrine glands.1,2 Although copper is not a toxic element; however, it is toxic at high concentration.3 So, it is necessary to acquire and develop methods that make it possible to determine copper ions in environmental real samples with high selectivity and accuracy. Some of the common analytical methods for the determination of copper ions are atomic absorption spectrometry,4,5 UV-Vis absorption spectroscopy,6 ion selective electrodes,7 inductively coupled plasma atomic emission spectrometry,8 chemiluminescence,9 stripping voltammetry,10 and fluorescence11 techniques. However, among the analytical methods for determination of copper ions, potentiometric determination of copper using carbon paste electrodes (CPEs) assumes importance in view of its widespread occurrence in various samples.12 This kind of electrode is commonly applied in electrochemical studies due to their high physical stability, long lifetime, low cost, low background current, and easy construction.13 Meanwhile, modification of bare CPE using different compounds can improve the sensor characteristics such as its selectivity, sensitivity, applicability and response time.In recent years, due to high selectivity of ion imprinted polymers (IIP) toward their template, IIP-modified electrodes have attracted considerable interests to develop the selectivity and response behavior of the electrochemical sensors.14,15 IIPs can recognize the target ions with high selectivity by using their cavities or “imprinted sites” which formed in the polymeric network during synthesis.16–19 Up to date, a variety of IIPs have been reported for separation and determination of copper ions using different complexing or chelating agents such as 1-(2-pyridylazo)-2-naphthol,20 4-(2-pyridylazo) resorcinol,21 salen,22 itaconic acid,23 thiosemicarbazide,24 carboxybenzotriazole,25 n-methacrylamidohistidine-dihydrate,26 2,9-dimethyl-1,10-phenanthroline,27 5,6,14,15-dibenzo-1,4-dioxa-8,12-diazacyclopentadecane-5,14-diene.28 However; to the best of our knowledge, a little attention has been paid to the application of nano-scaled porphyrin based IIP as modifiers in the chemically modified CPEs for potentiometric determination of Cu2+ ion.
The aim of this work was to develop a new modified CPE with a porphyrin based Cu-IIP for potentiometric determination of Cu2+ ion. The preparation of Cu-IIP was carried out by a thermal polymerization method, in the presence of copper ion, 5,10,15,20-tetrakis(4-hydroxyphenyl)-porphyrin, methacrylic acid and ethyleneglycoldimethacrylate. Then, the templated copper metal ion was removed from the polymeric particles by leaching with mineral acid and its morphology has been characterized by scanning electron microscopy. The influence of different affecting parameters on the response characteristics of the designed modified electrode was investigated. After optimization the experimental parameters, this potentiometric sensor was tested for Cu2+ ion determination in different water samples as well as an indicator electrode in potentiometric titration.
2. Experimental
2.1. Reagents and materials
All used chemicals were of analytical reagent grade. Double distilled water was used for preparation of solutions and for washing. In the synthesis of Cu-IIP; methacrylic acid (MAA), ethyleneglycoldimethacrylate (EGDMA), and 2,2′-azobisisoobutyronitrile (AIBN) were supplied by DAEJUNG company (Korea). Graphite powder, sodium tetraphenylborate (NaTPB) and paraffin oil (Fluka) were used for the preparation of the unmodified and modified CPEs. Cu(NO3)2·6H2O was commercially available as analytical reagent grade and used without further purification.2.2. Apparatus
All the potential and pH measurements were carried out with a pH/ion meters model 691-ZAGCHIMI (Iran). The surface morphology of the polymers was recorded on a Philips XL30 series instrument using a gold film for loading the dried particles on the instrument. The FT-IR spectra were recorded using a Shimadzu FT-IR 8300 spectrophotometer (Japan).2.3. Synthesis of 5,10,15,20-tetrakis(4-hydroxyphenyl)porphyrin
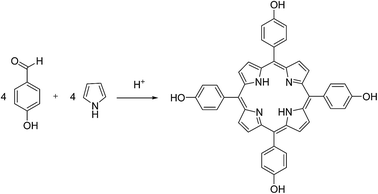
Synthesis of 5,10,15,20-tetrakis(4-hydroxyphenyl)porphyrin (THPP) was carried out in one steps, as shown in Scheme 1. THPP was prepared according to the literature methods via condensation of freshly distilled pyrrole with 4-hydroxybenzaldehyde.29 The product was purified through column chromatography (neural alumina) with 4![[thin space (1/6-em)]](https://www.rsc.org/images/entities/char_2009.gif) :
:![[thin space (1/6-em)]](https://www.rsc.org/images/entities/char_2009.gif) 1 mixture of ethanol–chloroform, as eluent. The obtained solution was evaporated to dryness under vacuum to yield ca. 15% of the porphyrin ligand. 1HNMR (CDCl3) δ: −2.81 (s, 2H, NH), 7.36–8.11 (m, 16H, o- and m-Ph), 8.98 (s, 8H, pyrrole), 10.01 (4H, OH). UV-Vis (λmax nm in THF): λmax (log
1 mixture of ethanol–chloroform, as eluent. The obtained solution was evaporated to dryness under vacuum to yield ca. 15% of the porphyrin ligand. 1HNMR (CDCl3) δ: −2.81 (s, 2H, NH), 7.36–8.11 (m, 16H, o- and m-Ph), 8.98 (s, 8H, pyrrole), 10.01 (4H, OH). UV-Vis (λmax nm in THF): λmax (log![[thin space (1/6-em)]](https://www.rsc.org/images/entities/char_2009.gif) ε): 419 (4.92: Soret band) and 515 (3.65), 550 (3.43), 593 (3.25), 650.5 (3.25) [Q-bands].
ε): 419 (4.92: Soret band) and 515 (3.65), 550 (3.43), 593 (3.25), 650.5 (3.25) [Q-bands].
2.4. Preparation of Cu2+-ion imprinted polymers
The synthesis of Cu-IIP was carried out by precipitation polymerization method. Briefly, 0.1 mmol of copper nitrate and 0.1 mmol of THPP and 0.4 mmol of MAA were placed into 23 mL of ethanol–acetonitrile mixture (2![[thin space (1/6-em)]](https://www.rsc.org/images/entities/char_2009.gif) :
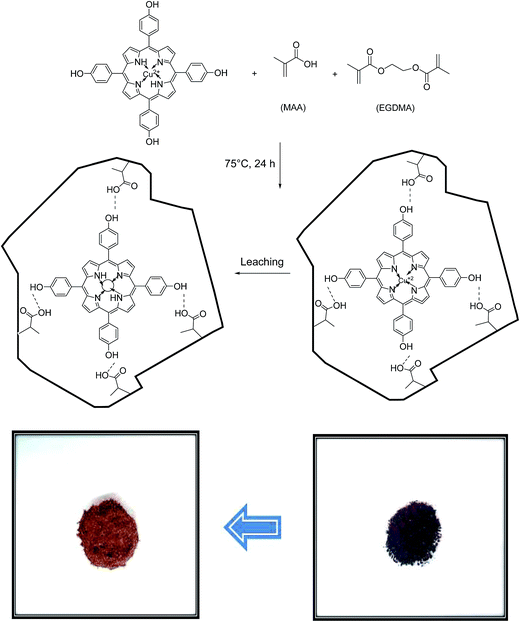
:![[thin space (1/6-em)]](https://www.rsc.org/images/entities/char_2009.gif) 1) as porogen solvent and mixed with continuous stirring for 1 h. Then, 4.0 mmol of EGDMA and 50 mg AIBN (as free radical initiator) was added to the solution, successively. Next, the solution was purged with N2 gas for 10 min and the vial was placed in a heated oil bath at 75 °C for 24 h. After the completion of polymerization reaction, the resulting polymer was then dried, crushed and grounded into powder. The obtained particles were treated with HCl aqueous solution to release the copper ions.30 As shown in Scheme 2, the obvious change in the color from dark brown in unleached IIPs to light brown after the leaching process, can be attributed to the successful removal of Cu2+ ions from the polymeric matrix.31 Finally, pH of the prepared sorbent was adjusted to neutral by several washing with double distilled water.
1) as porogen solvent and mixed with continuous stirring for 1 h. Then, 4.0 mmol of EGDMA and 50 mg AIBN (as free radical initiator) was added to the solution, successively. Next, the solution was purged with N2 gas for 10 min and the vial was placed in a heated oil bath at 75 °C for 24 h. After the completion of polymerization reaction, the resulting polymer was then dried, crushed and grounded into powder. The obtained particles were treated with HCl aqueous solution to release the copper ions.30 As shown in Scheme 2, the obvious change in the color from dark brown in unleached IIPs to light brown after the leaching process, can be attributed to the successful removal of Cu2+ ions from the polymeric matrix.31 Finally, pH of the prepared sorbent was adjusted to neutral by several washing with double distilled water.
2.5. Preparation of unmodified and modified CPE
Unmodified CPEs were prepared by mixing 70 mg of graphite powder with 30 mg of paraffin oil with a mortar and pestle. Then, the mixture was filled into a syringe tube with a radius of 1.0 mm and compressed tightly to avoid the possible air gaps. A copper wire was inserted into the opposite end to establish an electrical contact. The external electrode surface was smoothed with soft paper. The Cu-IIP modified CPE was prepared by thorough mixing of graphite powder, paraffin oil, IIP and ionic additive in proportions of 61, 28, 10 and 1% (w/w), respectively.2.6. Measurements of electromotive force (emf)
The emf measurements with the constructed CPEs were carried out with the following cell assemblies:Ag/AgCl, KCl (satd)//test solution/CPE.
Sodium chloride solution was prepared and used as supporting electrolyte, to maintain constant ionic strength (μ). The performance of the electrodes was investigated by measuring the emfs of Cu2+ ion solutions (25 mL) in the range of 1.0 × 10⁻⁸ to 5.0 × 10⁻¹ mol L−1, by serial dilution. In each solution, while stirring after reaching the equilibrium, calibration graphs were constructed by plotting the recorded potentials vs. logarithmic function of Cu2+ concentrations. The obtained graphs were then employed for the characterization of the slope and linear range of the CPEs and also subsequent determination of unknown amount of Cu2+ ion.
2.7. Selectivity of the designed CPE
The potentiometric selectivity of the sensor towards different inorganic cations was evaluated by applying the separate solution method (SSM) (using 0.001 mol L−1 of Cu2+ ion solutions and interfering ions) and also fixed interference method (FIM) (using 0.001 mol L−1 of interfering ions and varying amount of Cu2+ ion).323. Results and discussion
3.1. Characterization of the prepared copper ion imprinted polymers
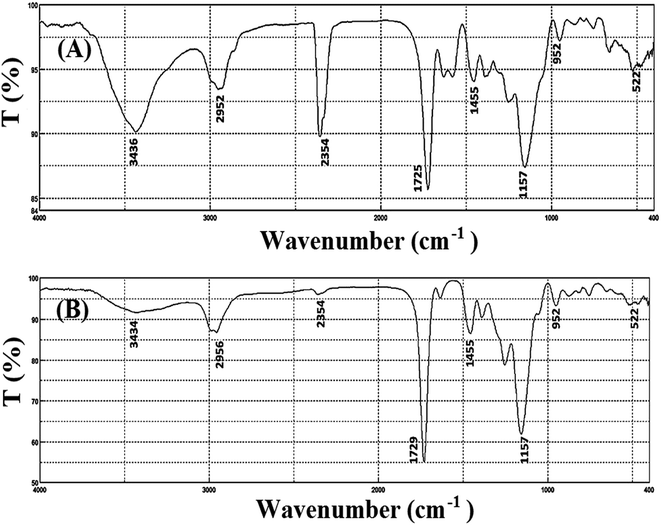
Characterization of the prepared porphyrin-based Cu-IIP was performed by various techniques such as colorimetry, FT-IR and SEM. As it is obvious from Fig. 1, IR spectra of leached and unleached sample show similar pattern; which it referred to the similarity in their polymeric backbones and stability of the polymeric network during the acid washing process.21 Consequently, it can be concluded that THPP is held in the polymer structure, even after leaching process. Moreover, the absorption bands located at around 950, 1500–1700 and 3400–3600 cm−1 probably related to the stretching vibrations of C–N, C![[double bond, length as m-dash]](https://www.rsc.org/images/entities/char_e001.gif) C in the benzene aromatic ring and free –OH groups, respectively. Beside, the slight shifts from 1257, 1725 and 2952 cm−1 (in un-leached sample) to 1260, 1729 and 2956 cm−1 (in leached sample) was observed after removal of Cu2+ ion from the un-leached sample. The similar shifts in IR results after removal of the imprinted ion from the polymeric network were reported, previously.33,34
C in the benzene aromatic ring and free –OH groups, respectively. Beside, the slight shifts from 1257, 1725 and 2952 cm−1 (in un-leached sample) to 1260, 1729 and 2956 cm−1 (in leached sample) was observed after removal of Cu2+ ion from the un-leached sample. The similar shifts in IR results after removal of the imprinted ion from the polymeric network were reported, previously.33,34
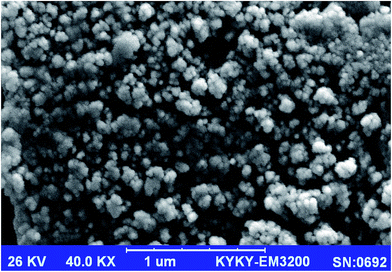
Fig. 2 shows SEM image of the Cu-IIP particles prepared by thermal polymerization method, which reveals the approximate particle size and the morphological structure characterization the of the IIP particles.33 As demonstrated, the prepared IIP particles are in nano-scaled size with average particle size of 57 nm, with slightly irregular in shape. The observed aggregations and irregularity in the particles are usually due to the synthetic method, grinding and sieving steps; which gave irregular particles with different sizes.34
3.2. Potentiometric assay of copper ion by the IIP modified CPE
| No. | Graphite (mg) | IIP (mg) | Paraffin (mg) | Additive (mg) | Slope (mV per decade) | Concentration linear range (M) | R2 |
|---|---|---|---|---|---|---|---|
| 1 | 70 | — | 30 | — | 24.1 | 1 × 10⁻⁶ to 5 × 10⁻¹ | 0.980 |
| 2 | 70 | — | 29 | 1 | 25.28 | 1 × 10⁻⁶ to 5 × 10⁻¹ | 0.985 |
| 3 | 65 | 4 | 30 | 1 | 27.1 | 1 × 10⁻⁶ to 5 × 10⁻¹ | 0.984 |
| 4 | 63 | 6 | 30 | 1 | 28.5 | 1 × 10⁻⁶ to 5 × 10⁻¹ | 0.980 |
| 5 | 63 | 8 | 28 | 1 | 33.5 | 1 × 10−6.5 to 1 × 10⁻¹ | 0.995 |
| 6 | 61 | 10 | 28 | 1 | 30.15 | 4.0 × 10⁻⁹ to 2.0 × 10⁻¹ | 0.997 |
| 7 | 59 | 12 | 28 | 1 | 26.83 | 1 × 10⁻⁵ to 5 × 10⁻¹ | 0.981 |
The blank electrode without the modifier (i.e. Cu-IIP NPs) showed poor response characteristics toward Cu2+ ion (sensor no. 1). The electrode showed remarkable sensitivity for Cu2+ ion in the presence of Cu-IIP NPs. As obtained, linearity of the electrode improved by increasing the amount of Cu-IIP NPs until 10 wt%. Lowering the IIP content in the electrode composition decreased the sensor response characteristics. It is may be arise from the lack of required recognition sites in the electrode surface.34 Meanwhile, by using more amounts of Cu-IIP NPs in the paste content (i.e. sensor no. 7), sensitivity and slope of the electrode decreased. It may be due to change in homogeneity and/or conductivity in the paste composition as well as possible saturation of the paste.35 The presence of ionic additive (i.e. NaTPB) had a beneficial influence on the performance characteristics of the CPE, which addition of 1% NaTPB increases the slope of the sensor from a poor value to a Nernstian value. The presence of anionic additives in the paste composition by reduction the ohmic resistance can improve the exchange kinetics, response time and selectivity of the electrodes.36 As shown in Table 1, the Cu-IIP modified CPE with graphite power/paraffin oil/IIP/additive percentage ratio of 61![[thin space (1/6-em)]](https://www.rsc.org/images/entities/char_2009.gif) :
:![[thin space (1/6-em)]](https://www.rsc.org/images/entities/char_2009.gif) 28
28![[thin space (1/6-em)]](https://www.rsc.org/images/entities/char_2009.gif) :
:![[thin space (1/6-em)]](https://www.rsc.org/images/entities/char_2009.gif) 10
10![[thin space (1/6-em)]](https://www.rsc.org/images/entities/char_2009.gif) :
:![[thin space (1/6-em)]](https://www.rsc.org/images/entities/char_2009.gif) 1.0 exhibited the maximum sensitivity and linearity (4.0 × 10⁻⁹ to 2.0 × 10⁻¹ M) with an excellent Nernstian slope of 30.15 mV per decade. Thus, the composition of electrode no. 6 was selected as the optimum electrode composition for other experiments. In addition, some control experiments by using NIP in the paste content were established for copper determination. The results show that the NIP-based sensor offers a concentration linear range from 10−6 to 10−1 M; however, the selectivity of the sensor for copper in the presence of other cations was declined, significantly (Fig. S1†).
1.0 exhibited the maximum sensitivity and linearity (4.0 × 10⁻⁹ to 2.0 × 10⁻¹ M) with an excellent Nernstian slope of 30.15 mV per decade. Thus, the composition of electrode no. 6 was selected as the optimum electrode composition for other experiments. In addition, some control experiments by using NIP in the paste content were established for copper determination. The results show that the NIP-based sensor offers a concentration linear range from 10−6 to 10−1 M; however, the selectivity of the sensor for copper in the presence of other cations was declined, significantly (Fig. S1†).
Fig. 4 shows the potential responses of the chemically modified CPEs toward different transition metal ions including Co2+, Fe2+, Mn2+, Hg2+, Ni2+ and Zn2+ ions at optimum conditions. As it is clear from the results, the modified electrode shows an acceptable response toward Cu2+ ions over other metal ions with the similar charge and size. Thus, it can be hoped that the constructed sensor act as a promising sensor for selective and sensitive determination of Cu2+ ions in the presence of other transition and heavy metal ions in different matrices. By considering Fig. 4, limit of detection was obtained from extrapolation of the linear region of the calibration curve to the base-line potential. Test solutions were maintained at ionic strength of 0.1 with NaCl and the pH value was maintained at 4.5. The modified sensor exhibited linear response to the logarithm of the Cu2+ ions concentration (pCu2+) within the concentration range of 4.0 × 10⁻⁹ to 2.0 × 10⁻¹ mol L−1 with a low detection limit of 2.0 × 10⁻⁹ mol L−1.
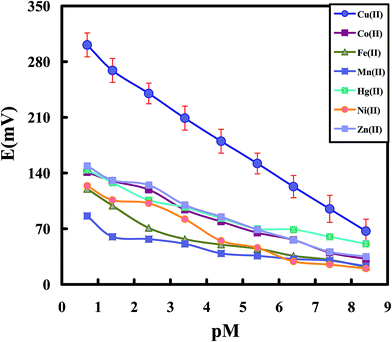 | ||
| Fig. 4 Potentiometric response of the Cu-IIP modified CPE toward various cations under optimum conditions. | ||
To investigate temperature effect on response characteristics of the modified sensor, calibration curve (Ecell vs. −log[Cu2+]) were constructed at temperature range of 15–45 °C (Table S1†). As obtained, the electrode exhibits good Nernstian behavior over the studied temperature range with high thermal stability, so that the electrode was usable up to 45 °C. The observed deviation from the Nernstian behavior of the sensors over the applied temperature may be attributed the change in the diffusion coefficient of the ion as well as possible bleeding of the paste components at high temperature.39
3.3. Life time, repeatability and reproducibility
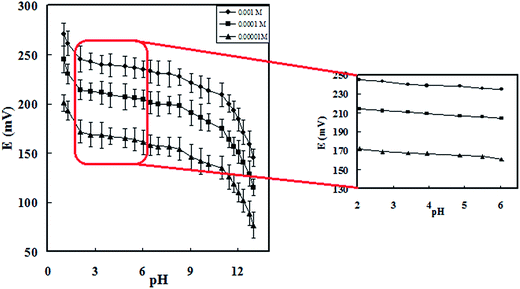
In life time studies, repeated monitoring of potentials and calibration over several days gave good slope, linearity, and correlation coefficient. The IIP modified CPE can be used for, at-least, two months without any measurable divergence (Table S2†). The electrode was kept in buffer solution with pH 5.0–7.0 to avoid drying, cracking and poisoning when it was not in use. To evaluate the reproducibility of this electrode, five electrodes with the same composition were constructed and their responses were recorded, at optimum conditions. According to the calculated standard deviation corresponded to the Cu2+ solution (0.59, n = 5) difference in response of the electrodes were not significant. The electrodes showed acceptable response with the average slope of 29.85 mV per decade and linearity of 4.0 × 10⁻⁹ to 5.0 × 10⁻¹ mol L−1 (Table S3†). In addition, for repeatability study, the standard deviations of 5 replicate measurements with one paste electrode were measured. According to the results (Table S4†), the modified electrode showed good repeatability with the average slope of 29.80 mV and average correlation coefficient of 0.992 at the concentration range between 4.0 × 10⁻⁹ and 5.0 × 10⁻¹ mol L−1 of Cu2+ ion with a low standard deviation of 0.44.3.4. Selectivity coefficient and comparison
To calculate the selectivity coefficient of the modified CPE toward Cu2+ ions over other cations, SSM (0.001 mol L−1 of Cu2+ ion solutions and interfering ions) and FIM (0.001 mol L−1 of interfering ions and varying concentration of Cu2+ ion) were used as the two recommended methods for studying influence of interferences ions in ion selective electrodes by IUPAC.32 In this study, some cations including Co2+, Zn2+, Hg2+, Pb2+, Mn2+, and Fe2+ were chosen as possible interferences for selectivity study. The selectivity coefficients found by SSM and FIM are listed in Table 2. It is obvious that the proposed Cu2+ sensor is highly selective with respect to the most of cations. The surprisingly high selectivity of the designed CPE modified with IIP for copper ions over other cations most probably arises from the strong tendency of the IIP carrier for copper ions. Moreover, by considering the selectivity coefficients, most of the tested ions do not have significant effect on the response of the modified electrode. Meanwhile, comparison of the calculated selectivity coefficients with other reports12,40–49 for the same metal ions clearly indicate that the selectivity of the designed sensor is comparable with others and the ions showed a negligible interference in the performance of the sensor.| Selectivity coefficients | Selectivity method | Ref. | |||||
|---|---|---|---|---|---|---|---|
| Co2+ | Mn2+ | Zn2+ | Fe2+ | Pb2+ | Hg2+ | ||
| a Abbreviations: FIM: fixed interference method; MPM: matched potential method; SSM: separate solution method. | |||||||
| 8.50 × 10⁻⁵ | — | 2.78 × 10⁻⁴ | — | 3.60 × 10⁻⁵ | 1.33 × 10⁻⁴ | FIM | 12 |
| 2.60 × 10⁻³ | — | 5.30 × 10⁻³ | 3.7 × 10⁻³ | 9.10 × 10⁻³ | 1.60 × 10⁻³ | SSM | 40 |
| 1.26 × 10⁻³ | 1.00 × 10⁻⁴ | 5.01 × 10⁻³ | — | 7.94 × 10⁻³ | 1.26 × 10⁻⁴ | FIM | 41 |
| 3.12 × 10⁻³, 3.32 × 10⁻⁵ | — | 2.19 × 10⁻⁴, 8.42 × 10⁻⁷ | — | 5.92 × 10⁻³, 8.83 × 10⁻⁵ | — | MPM and SSM | 42 |
| 4.41 × 10⁻³ | — | 4.24 × 10⁻³ | — | 3.10 × 10⁻³ | 7.13 × 10⁻² | MPM | 43 |
| 2.8 | — | 2.3 | — | 1.8 | 0.8 | FIM | 44 |
| — | — | 2.82 × 10⁻¹ | — | 0.25 | — | SSM | 45 |
| — | — | 1.97 × 10⁻¹, 7.80 × 10⁻² | — | 7.31 × 10⁻⁴, 7.11 × 10⁻⁴ | 1.25 × 10⁻⁴, 6.27 × 10⁻⁴ | MPM and FIM | 46 |
| 2.39 × 10⁻⁴ | 8.54 × 10⁻⁶ | 2.17 × 10⁻³ | — | 3.03 × 10⁻⁵ | 8.58 × 10⁻⁵ | MPM | 47 |
| 2.57, 3.43 | — | 2.90, 3.30 | — | 1.40, 2.74 | — | SSM and FIM | 48 |
| — | 1.30 × 10⁻³ | 1.10 × 10⁻⁴ | — | 3.30 × 10⁻⁴ | — | MPM | 49 |
| 1.32 × 10⁻⁴, 1.00 × 10⁻⁴ | 6.02 × 10⁻⁴, 7.76 × 10⁻⁴ | 3.16 × 10⁻⁴, 1.58 × 10⁻⁴ | 7.24 × 10⁻³, 6.31 × 10⁻³ | 1.41 × 10⁻⁴, 2.00 × 10⁻⁴ | 5.01 × 10⁻³, 6.31 × 10⁻³ | SSM and FIM | This work |
The reported data in Table 3 give a comparison between some important characteristics of the modified electrode with previously reported ones with respect to slope, response time, pH, linear range and detection limit.12,40–49 It is noteworthy that the selectivity coefficients, linear range, slope and response time of the proposed electrodes are considerably improved with respect to those of the previously reported Cu2+ ion selective electrodes (Table 3). By considering Tables 2, 3 and Fig. 4; it can be concluded that the modified electrode was superior in comparison with the previously reported Cu2+ sensors as its linear range, Nernstian slope and detection limit.
| No. | Ionophore | Slope (mV per decade of concentration) | Concentration linear range (mol L−1) | Response time (s) | Detection limit (mol L−1) | Working pH | RSD (%) | Ref. |
|---|---|---|---|---|---|---|---|---|
| a Abbreviations: (1) 3,4-dihydro-4,4,6-trimethyl-2(1H)-pyrimidinethione, (2) 5,6,7,8,9,10-hexahydro-2H-1,13,4,7,10-benzodioxatriazacyclopentadecine-3,11(4H,12H)-dion, (3) multiwalled carbon nanotube-2-((3silylpropylaminoethylimino) methyl)phenol, (4) [2-mercapto-5-(1-methyl-5-nitroimidazole-2-yl)-1,3,4-thiadiazole], (5) 1,3,5-tris(8-quinolinoxymethyl)-2,4,6-trimethylbenzene, (6) multi walled carbon nanotubes, (7) β-cyclodextrin, (8) phenanthroline-tetraphenyl borate, (9) 2-methoxy-6-(((3-(trimethoxysilyl)propyl)imino) methyl) phenol chemically bonded to multiwalled carbon nanotubes, (10) 3-(2-methyl-2,3-dihydrobenzothiazol-2-yl)-2H-chromen-2-one. | ||||||||
| 1 | DTPT | 30.0 | 9.8 × 10⁻⁷ to 7.6 × 10⁻² | 45 | 7.0 × 10⁻⁷ | 1.0–5.5 | — | 12 |
| 2 | L1 | 29.7 | 1.0 × 10⁻⁸ to 1.0 × 10⁻¹ | <22 | 9.1 × 10⁻⁹ | 2.7–6.2 | — | 38 |
| 3 | MMNIT | 31.0 | 7.9 × 10⁻⁹ to 3.2 × 10⁻² | 5 | 3.5 × 10⁻⁹ | 2.0–5.5 | — | 39 |
| 4 | Polysiloxane | 29.4 | 2.3 × 10⁻⁷ to 1.0 × 10⁻³ | 8 | 2.7 × 10⁻⁸ | 2.3–5.4 | <3% | 40 |
| 5 | Etioporphyrin | 30.3 | 1.3 × 10⁻⁶ to 1.3 × 10⁻² | 5 | 9.0 × 10⁻⁷ | 4.5–8.5 | <1% | 41 |
| 6 | MO8HQ | 30.0 | 1.0 × 10⁻⁵ to 1.0 × 10⁻¹ | 15 | 6.3 × 10⁻⁶ | 4.0–7.0 | — | 42 |
| 7 | MWCNT | 28.4 | 1.0 × 10⁻⁶ to 1.0 × 10⁻² | 1.05 | 1.1 × 10⁻⁶ | 3.0–5.5 | — | 43 |
| 8 | β-CD | 28.9 | 3.1 × 10⁻⁷ to 1.0 × 10⁻² | 9 | 3.1 × 10⁻⁷ | 3.5–7.0 | — | 44 |
| 9 | Phen:TPB | 29.4 | 1.0 × 10⁻⁶ to 1.0 × 10⁻² | 8–11 | 1.0 × 10⁻⁶ | 3.8–5.0 | — | 45 |
| 10 | MMSPIMP–MWCNTs | 29.5 | 4.1 × 10⁻⁸ to 1.0 × 10⁻² | 20 | 1.6 × 10⁻⁸ | 3.5–5.5 | <1% | 46 |
| 11 | L2 | 29.3 | 1.0 × 10⁻⁶ to 1.0 × 10⁻¹ | 15 | 7.9 × 10⁻⁷ | 2.0–9.0 | — | 47 |
| 12 | Cu-IIP | 30.2 | 4.0 × 10⁻⁹ to 2.0 × 10⁻¹ | 5 | 2.0 × 10⁻⁹ | 2.0–6.0 | 1% | This work |
3.5. Practical applications for water analysis and as indicator electrode
For testing the sensor for practical application in aqueous media, it was used for determination of copper in different water samples. The water samples including mineral water, tap water (from Yasouj University Lab) and Beshar river water (from Boyer-Ahmad location) were collected and prepared according to literature.39,48 The results are illustrated in Table 4. The results (RSD% ∼ 1%, recovery ranges of 100.0–106.3%) reveal that the constructed sensor works well under laboratory conditions.| Sample | Added (mol L−1) | Found (mol L−1) | Recovery (%) | RSD (%) |
|---|---|---|---|---|
| Tap water | 0.00 | 0.005 × 10⁻⁵ | — | 0.80 |
| 1.0 × 10⁻⁵ | 1.01 × 10⁻⁵ | 101.0 | 1.10 | |
| 1.0 × 10⁻⁴ | 1.03 × 10⁻⁴ | 103.0 | 1.40 | |
| River water | 0.00 | 0.078 × 10⁻⁵ | — | 0.50 |
| 1.0 × 10⁻⁵ | 1.06 × 10⁻⁵ | 106.0 | 1.05 | |
| 1.0 × 10⁻⁴ | 1.00 × 10⁻⁴ | 100.0 | 0.60 |
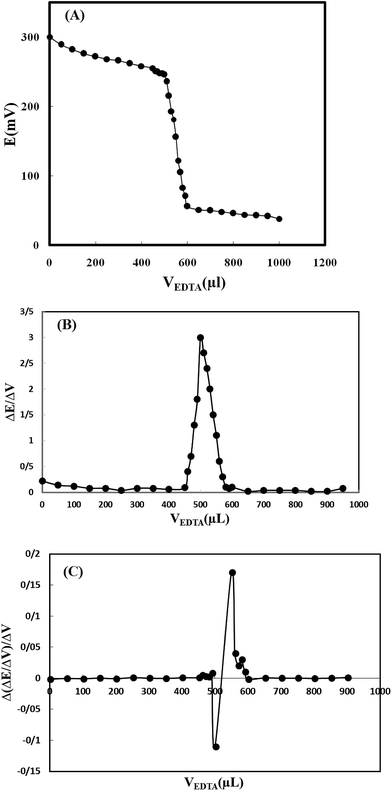
Moreover, in order to test the modified electrode in different applications; it was also used as an indicator electrode for determination of copper content in a typical titration of Cu2+ and EDTA solutions. For this purpose, 50 mL of Cu2+ solution (5.0 × 10⁻⁴ mol L−1) was titrated potentiometrically, against 5.0 × 10⁻² mol L−1 EDTA solutions using the electrode as an indicator electrode. The results indicated that the amount of copper ion can be accurately determined with the modified electrode (Fig. 5). The first and second order derivation titration curves were also plotted and the average titration error was calculated to be 3.0%.
4. Conclusion
In summary, a selective Cu-IIP NPs base on 5,10,15,20-tetrakis(4-hydroxyphenyl)porphyrin (THPP) was synthesized for recognition of Cu2+ ion in aqueous solutions. The IIP was successfully used as a copper recognition element in carbon paste electrode. The modified electrode by Cu-IIP NPs showed a short response time (∼5 s), Nernstian slope (∼30 mV per decade), wide linear range and low detection limit. As compared, in some cases, this sensor was improved the electrode characteristics and has better figures of merit than others (Table 4). Moreover, simple construction, high precision, good thermal stability, long life time and reasonable applicability of the sensor for water analysis were some advantages of the modified sensor. Briefly, comparison between the sensor characteristics with those of the previously reported ones clearly shows that the proposed sensor can be categorized as an efficient copper sensor. Meanwhile, the short response time, good linearity, sensitivity and selectivity of the designed nano-sized IIP based-CPE make it as a potential sensor for on-line flow electrochemical analysis purposes in different environmental and biological real samples with various matrices.References
- D. G. Barceloux, J. Clin. Toxicol., 1999, 37, 217–230 CAS.
- B. Jankiewicz, B. Ptaszyński and A. Turek, Pol. J. Environ. Stud., 1999, 8, 35–38 CAS.
- Z. M. Grahovac, S. S. Miti and E. T. Pecev, J. Serb. Chem. Soc., 2003, 68, 219–226 CrossRef CAS.
- M. H. Mashhadizadeh, M. Amoli-Diva, M. R. Shapouri and H. Afruzi, Food Chem., 2014, 151, 300–305 CrossRef CAS PubMed.
- M. Behbahani, J. Abolhasani, M. M. Amini, O. Sadeghi, F. Omidi, A. Bagheri and M. Salarian, Food Chem., 2015, 173, 1207–1212 CrossRef CAS PubMed.
- R. A. Nalawade, A. M. Nalawade, G. S. Kamble and M. A. Anuse, Spectrochim. Acta, Part A, 2015, 146, 297–306 CrossRef CAS PubMed.
- U. Baig and A. A. Khan, J. Ind. Eng. Chem., 2015, 29, 392–399 CrossRef CAS.
- M. C. Bruzzoniti, R. M. De Carlo, C. Sarzanini, R. Maina and V. Tumiatti, Talanta, 2012, 99, 703–711 CrossRef CAS PubMed.
- M. H. Sorouraddin, J. L. Manzoori and M. Iranifam, Talanta, 2005, 66, 1117–1121 CrossRef CAS PubMed.
- M. B. Gholivand and A. A. Romiani, Anal. Chim. Acta, 2006, 571, 99–104 CrossRef CAS PubMed.
- H. Abdollahi, M. Shamsipur and A. Barati, Spectrochim. Acta, Part A, 2014, 127, 137–143 CrossRef CAS PubMed.
- A. Abbaspour and S. M. M. Moosavi, Talanta, 2002, 56, 91–96 CrossRef CAS PubMed.
- K. Vytřas, I. Švancara and R. Metelka, J. Serb. Chem. Soc., 2009, 74, 1021–1033 CrossRef.
- H. R. Rajabi, M. Roushani and M. Shamsipur, J. Electroanal. Chem., 2013, 693, 16–22 CrossRef CAS.
- M. B. Gholivand, M. Shamsipur, S. Dehdashtian and H. R. Rajabi, Mater. Sci. Eng., C, 2014, 36, 102–107 CrossRef CAS PubMed.
- H. R. Rajabi and S. Razmpour, Spectrochim. Acta, Part A, 2016, 153, 45–52 CrossRef CAS PubMed.
- H. R. Rajabi, M. Shamsipur, M. M. Zahedi and M. Roushani, Chem. Eng. J., 2015, 259, 330–337 CrossRef CAS.
- V. Vatanpour, S. S. Madaeni, S. Zinadini and H. R. Rajabi, J. Membr. Sci., 2011, 373, 36–42 CrossRef CAS.
- M. Shamsipur and H. R. Rajabi, Microchim. Acta, 2013, 180, 243–252 CrossRef CAS.
- H. Ashkenani and M. A. Taher, J. Electroanal. Chem., 2012, 683, 80–87 CrossRef CAS.
- D. K. Singh and S. Mishra, Chromatographia, 2009, 70, 1539–1545 CAS.
- S. Walas, A. Tobiasz, M. Gawin, B. Trzewik, M. Strojny and H. Mrowiec, Talanta, 2008, 76, 96–101 CrossRef CAS PubMed.
- M. J. Kuras and E. Wieckowska, Polym. Bull., 2015, 72, 3227–3240 CrossRef CAS.
- M. Roushani, S. Abbasi and H. Khani, Environ. Monit. Assess., 2015, 187, 601–605 CrossRef PubMed.
- M. A. Abu-Dalol, A. A. Salam and N. S. Nassory, Int. J. Electrochem. Sci., 2015, 10, 6780–6793 Search PubMed.
- R. Say, E. Birlik, A. u. Ersöz, F. Yılmaz, T. Gedikbey and A. Denizli, Anal. Chim. Acta, 2003, 480, 251–258 CrossRef CAS.
- H. Ebrahimzadeh, M. Behbahani, Y. Yamini, L. Adlnasab and A. A. Asgharinezhad, React. Funct. Polym., 2013, 73, 23–29 CrossRef CAS.
- M. Shamsipur, J. Fasihi, A. Khanchi, R. Hassani, K. Alizadeh and H. Shamsipur, Anal. Chim. Acta, 2007, 599, 294–301 CrossRef CAS PubMed.
- Z. Jing, G. Yang, C. Shaokui, Z. Wennan, W. Dongmei, C. Huifang and L. Tianxuan, Chem. Mag. Org., 2002, 8, 39–42 Search PubMed.
- H. R. Rajabi, M. Shamsipur and S. M. Pourmortazavi, Mater. Sci. Eng., C, 2013, 33, 3374–3381 CrossRef CAS PubMed.
- M. Shamsipur, H. R. Rajabi, S. M. Pourmortazavi and M. Roushani, Spectrochim. Acta, Part A, 2014, 117, 24–33 CrossRef CAS PubMed.
- G. G. Guilbault, R. A. Durst, M. S. Frant, H. Freiser, E. H. Hansen, T. S. Light, E. Pungor, G. Rechnitz, N. M. Rice, T. J. Rohm, W. Simon and J. D. R. Thomas, Pure Appl. Chem., 1976, 48, 127–132 Search PubMed.
- M. A. Abu-Dalo, A. A. Salam and N. S. Nassory, Int. J. Electrochem. Sci., 2015, 10, 6780–6793 CAS.
- F. Luo, S. Huang, X. Xionga and X. Lai, RSC Adv., 2015, 5, 67365–67371 RSC.
- K. Yoshimatsu, K. Reimhult, A. Krozerc, K. Mosbach, K. Sode and L. Ye, Anal. Chim. Acta, 2007, 584, 112–121 CrossRef CAS PubMed.
- M. Shamsipur, M. Hosseini, K. Alizadeh, M. M. Eskandari, H. Sharghi, M. F. Mousavi and M. R. Ganjali, Anal. Chim. Acta, 2003, 486, 93–99 CrossRef CAS.
- M. Shamsipur, M. Javanbakht, M. F. Mousavi, M. R. Ganjali, V. Lippolis, A. Garau and L. Tei, Talanta, 2001, 55, 1047–1054 CrossRef CAS PubMed.
- M. H. Mashhadizadeh, A. Mostafavi, R. Razavi and M. Shamsipur, Sens. Actuators, B, 2002, 86, 222–228 CrossRef CAS.
- A. Shokrollahi, M. Ghaedi, H. R. Rajabi and A. H. Kianfar, Chin. J. Chem., 2009, 27, 258–266 CrossRef CAS.
- M. Shamsipur, F. Mizani, A. A. Saboury, H. Sharghi and R. Khalifeh, Electroanalysis, 2007, 19, 587–596 CrossRef CAS.
- M. H. Mashhadizadeh, K. Eskandari, A. Foroumadi and A. Shafiee, Talanta, 2008, 76, 497–502 CrossRef CAS PubMed.
- H. M. Abu-Shawish, S. M. Saadeh and A. R. Hussien, Talanta, 2008, 76, 941–948 CrossRef CAS PubMed.
- Y. M. Issa, H. Ibrahim and O. R. Shehab, J. Electroanal. Chem., 2012, 666, 11–18 CrossRef CAS.
- S. K. Mittal, A. Kumar, N. Gupta, S. Kaur and S. Kumar, Anal. Chim. Acta, 2007, 585, 161–170 CrossRef CAS PubMed.
- M. Soleimani and M. G. Afshar, Int. J. Electrochem. Sci., 2013, 8, 8719–8729 CAS.
- T. Awad Ali, A. M. Eldidamony, G. G. Mohamed and D. M. Elatfy, Int. J. Electrochem. Sci., 2014, 9, 2420–2434 Search PubMed.
- T. Awad Ali, G. G. Mohamed, M. M. I. El-Dessouky, S. M. Abou El-Ella and R. T. F. Mohamed, J. Solution Chem., 2013, 42, 1336–1354 CrossRef.
- M. Ghaedi, S. Y. Shajaripour Jaberi, S. Hajati, M. Montazerozohori, A. Asfaram, B. Mirtamizdoust and M. Zare, IEEE Sens. J., 2015, 15, 2882–2889 CrossRef CAS.
- M. R. Ganjali, S. Aghabalazadeh, M. Khoobi, A. Ramazani, A. Foroumadi, A. Shafiee and P. Norouzi, Int. J. Electrochem. Sci., 2011, 6, 52–62 CAS.
Footnote |
| † Electronic supplementary information (ESI) available. See DOI: 10.1039/c6ra27288f |
| This journal is © The Royal Society of Chemistry 2017 |

