 Open Access Article
Creative Commons Attribution 3.0 Unported Licence
Th(IV) recovery from aqueous waste via hollow fiber renewal liquid membrane (HFRLM) in recycling mode: modelling and experimental validation
Sareh Ammari Allahyaria,
Seyed Javad Ahmadib,
Abdolhamid Minuchehr a and
Amir Charkhi
 *b
*b
aNuclear Engineering Department, Shahid Beheshti University, P.O. Box: 1983963113, Tehran, Iran
bMaterial and Nuclear Fuel School, Nuclear Science and Technology Research Institute, Tehran, Iran. E-mail: acharkhi@aeoi.org.ir; Tel: +98-21-82063626
First published on 23rd January 2017
Abstract
In the present work, the experimental investigation and mathematical modelling of Th(IV) recovery has been carried out by using the recycling mode of the hollow fiber renewal liquid membrane (HFRLM) process. Experiments were done at various operational conditions: the concentrations of TBP (tri-butyl phosphate) diluted in kerosene as a liquid membrane (LM), the nitrate and thorium(IV) ions concentration in the feed and flow rates of the feed and strip phases in the membrane module. The results indicate that practically more than 96% of thorium can be removed from an aqueous phase containing 198 ppm Th(IV) and 2 M NO3− by using the LM comprising of 30% (v/v) of TBP while the feed and stripping solutions were being circulated at the flow rates of 5.6 mL min−1 within 7 hours. In addition, a rigorous mathematical model has been developed to predict the experimental data. For this purpose, one-dimensional time dependent mass conservation equations in the longitude direction of the shell and lumen sides and in the radial direction of liquid membrane are numerically solved. The reasonable agreement between the experimental and the predicted data suggests the validity of the developed model. Therefore, this model might be useful for the design and optimization of the recovery of Th(IV) in the HFRLM process in the recycling mode.
1 Introduction
Thorium(IV) is a radiotoxic element of the actinide group, which due to its specific physiochemical properties has been utilized in a variety of industrial applications.1 In addition, it has been considered as the most important replaced element for uranium in nuclear fuels.2 These applications can produce many toxic and radioactive wastes. Finding a more efficient method for the separation of thorium from these wastes is desired due to prevention of its release to the environment and its recovery as a valuable element.3Recently, liquid membrane (LM) separation technology has been used as a suitable replacement for the traditional methods of solvent extraction. This technique is a cost effective and energy efficient method via which a high pre-concentration factor in the separation of various elements can be obtained.4 Furthermore, different configurations of membrane contactors have been utilized to maximize the efficiency of the process with a long-term stability. These include non-dispersive solvent extraction (NDSX),5 hollow fiber supported liquid membrane (HFSLM),6 pseudo-emulsion-based hollow-fiber strip dispersion (PEHFSD),7,8 hollow fiber contained liquid membrane (HFCLM)9 and hollow fiber renewal liquid membrane (HFRLM).10 Among these configurations, the HFRLM has been preferred due to its several advantages over the other methods. Because of the renewal effect of the liquid membrane layer developed at the inner surface of the fibers and the high membrane surface area, the mass transfer rate is higher than the conventional methods in the hollow fibers. In addition, the continuous replenishment of the liquid membrane embedded in the pores of hollow fibers causes the long-time stability of the liquid membrane. Moreover, due to lateral shear forces, no secondary pollution could be created by the emulsification. Finally, the low investment costs due to the low energy consumption and low carrier consumption as well as the easy scale-up of the process and the wide range of operation region are some other advantages of this process.11 As a result, the HFRLM process would have potential applications, which include the removal of the organic pollutants, the aroma recovery,12,13 the pharmaceuticals extraction,14 the recovery of metallic compounds from industrial wastewaters and hydrometallurgical processes.15–19
In order to provide an appropriate tool to consider some engineering issues like the detailed design, the estimation of cost, the scale up and optimization of the HFRLM process, it is necessary to develop a simple and precise mathematical model. Bringas et al. reported an overview on the different approaches of the mathematical modeling of hollow fiber liquid membrane contactors.20 Generally, two different approaches have been considered in the research: the diffusional-kinetic and mixed-kinetic approaches. In the diffusional-kinetic approach, the instantaneous chemical reactions (complexation and de-complexation) have been considered, therefore the global rate of the process depends only on the diffusional mass transport. In the later approach, the global rate of the process depends on both the diffusional mass transport and the reaction kinetic. In addition, the mathematical modelling of the fluid flow in a hollow fiber contactor has been categorized as a rigorous or simplified model. The simplified model is generally used for quick calculations by assuming the average properties and the concentrations on each side of the membrane, and by writing the macroscopic balances of the mass, momentum and energy. In the rigorous model and in the most accurate form, the equations of change and the interfacial chemical reactions might be considered in the differential form, and solution of this set of equations reveals useful information about the velocity, the temperature, the pressure and the concentration profiles. Zhongqi et al. introduced a simplified mathematical modeling of copper(II) transport through the HFRLM, which was in good agreement with the experimental results.11 They assumed that the fast complexation of solute with the carrier had been carried out at the aqueous–organic interfaces. At another work,21 the authors investigated the effects of pH on the mass transfer of copper in the HFRLM system by incorporating counter transport of hydrogen ions as well as the chelating reaction in the individual mass transfer resistances. The individual mass transfer resistance of the strip phase was neglected. Yang and coworkers have also mathematically modeled the transfer of CuSO4 in the HFRLM process in different operating conditions such as the single-pass, the recycling and the cascade modes. By considering the non-ideal flow in the shell side, a new mass transfer correlation was proposed according to Peclet number. The experimental results proved the reliability and accuracy of the model.22
In the present work, recovery of thorium in HFRLM process in the recycling mode is mathematically modelled based on the rigorous diffusional-kinetic model. Due to the comparatively high recovery of the small values of the solute, the recycling mode is preferable to the one-through mode. Since there has been few attempts to model the HFRLM process in the recycling mode, in this study a novel, simple and precise mathematical model has been developed based on the mass conservation in the longitude direction of the shell, the lumen sides, and radial direction of the liquid membrane phase as well. Unlike the previous works, variation of the renewal liquid membrane layer concentration at the inner surface of the lumen side has been considered for the first time in the modelling of the HFRLM.22 The dependent PDE equations have been solved numerically and the results have been validated with the experimental results. In addition, the effect of carrier, the nitrate ion and the initial thorium concentrations and the flow rates of the feed and stripe phases on the recovery of Th(IV) has been mathematically investigated.
1.1 Mathematical model
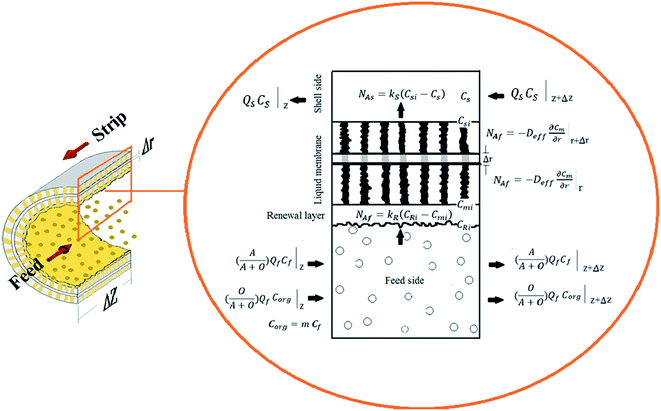
In this study a rigorous model has been developed in the longitude direction of the shell and lumen sides as well as the radial direction of the liquid membrane phase by considering the following assumptions in the hollow fiber renewal liquid membrane in the recycling mode (Fig. 1).(1) The operation is carried out at constant pressure and temperature conditions, so the physiochemical properties of fluids have remained unchanged.
(2) The momentum and energy balances have been neglected.
(3) Due to the instantaneous or fast kinetic of chemical reactions (complexation and de complexation) of Th(IV) with the extractant and the stripping solution, the diffusional-kinetic regime has been considered as a transport mechanism of Th(IV).
(4) The mass conservation of Th(IV) has been considered in a one-dimensional and time dependent mode.
(5) Th(IV) concentration profile in the radial direction of the shell and lumen sides has been neglected.
(6) The extraction of Th(IV) from nitrate media has been considered as an equilibrium reaction.
(7) Fluid flows through the lumen side in a laminar and fully developed regime.
(8) Axial dispersion has been neglected and only the axial convection has been considered.
(9) Mass transfer in the shell and tube sides has been approximated by the film and the renewal theory, respectively.
(10) The fibers have uniform pore size and porosity and they have been modeled as a thin cylindrical pipe with a uniform diameter.
(11) Due to pre-mixing of aqueous and organic phases, which causes a saturated feed in HFRLM, the instability of the liquid membrane phase due to the solubility-related loss would be eliminated.
(12) Due to the rigorous agitation, the concentrations of Th(IV) in the feed and strip reservoir tanks are uniform.
(13) Due to the rigorous agitation and the fast extraction reaction, the aqueous phase of the reservoir tank is assumed to be in equilibrium with the organic droplets.
(14) Due to the fast extraction reaction and formation of fine droplets in aqueous phase, the aqueous phase inside the lumen side has been considered in an equilibrium state with the organic droplets.
Th(IV) mass balances of the aqueous feed and strip solutions as well as the liquid membrane phase are given in eqn (1)–(3), respectively. The variation of Th(IV) concentration inside the liquid membrane droplets dispersed in the feed phase, has also been considered in the eqn (1) by using the term of  . The importance of this term has been neglected at the only model developed up to now for the HFRLM process in the recycling mode.22
Furthermore, the Th(IV) mass balances in the reservoir tanks are represented in eqn (4) and (5).
 | (1) |
 | (2) |
 | (3) |
 | (4) |
 | (5) |
In the above equations NAf and NAs are the feed and strip mass transfer fluxes of Th(IV). By considering the entry of the feed and strip phases counter-currently, the boundary and initial conditions of the eqn (1) and (2) are as the following:
| t = 0, 0 < z < l, Cf = 0, Cs = 0 | (6) |
| t > 0, z = 0, Cf = Cft, z = l, Cs = Cst | (7) |
The initial and boundary conditions of eqn (3) are as the following:
| t = 0, rin < r < rout, Cm = 0 | (8) |
 | (9) |
 | (10) |
The initial conditions in the reservoir tanks are given as the following:
| t = 0, Cft = Cft0, Cst = 0 | (11) |
By considering the local mass transfer coefficients, NAf and NAs could be calculated as bellows:
| NAf = kR(CRi − Cmi) | (12) |
| NAs = ks(Csi − Cs) | (13) |
Thorium is extracted from the nitrate media by using TBP according to the following equilibrium reaction.23
 | (14) |
The equilibrium constant (Keq) of the above reaction is expressed as:
 | (15) |
By considering m as the distribution coefficient of the extraction process, eqn (15) could be written as:
| m = Keq[NO3−1]aq.4[TBP]org2 | (16) |
The distribution coefficient of the back extraction process is the same as the above equation by using the nitrate concentration of strip phase. The equilibrium constant of eqn (14) is 0.6.24 In our previous work,25 the parameters of empirical correlations for kR and ks, mentioned in eqn (12) and (13), were modified and have been used in this study. In addition Deff has been considered as equal to 9.2 × 10⁻¹¹ m2 s−1 due to the following equation:
 | (17) |
The set of partial differential equations given in eqn (1)–(3) is converted to the coupled ordinary differential equations by spatially discretizing the equations.
Then, the obtained set of initial value ODEs is solved by using the 4-th order Runge–Kutta method.
The recovery efficiency R (%) of the system has been calculated by eqn (18).
 | (18) |
The average relative error (ARE), as given in the following equation, has been used in all the experiments to estimate the accuracy of the model.
 | (19) |
2 Material and methods
2.1 Reagents
The aqueous phases have been prepared by using analytical grade reagents. The donor (feed) solution containing 99.16 to 396.65 mg L−1 of Th(IV) and 2 mol L−1 of NaNO3 was prepared by dissolving appropriate amounts of thorium nitrate and sodium nitrate salts, which were provided by Merck company, in deionized water. The pH of the donor phase has been adjusted to 2 by adding an appropriate amount of diluted HNO3 and NaOH solutions and has been measured by a digital pH meter (model Metrohm 691). A 0.1 mol L−1 HNO3 aqueous solution is selected as an acceptor (stripping) phase.The organic liquid membrane phase has been prepared by dissolving tributhylphosphate (TBP) (≥99%) as a carrier in kerosene by the volume ratios of 15–45%. The commercial extractant and solvent of TBP and kerosene were purchased from Merck (Germany) and Sigma-Aldrich company (Germany), respectively.
2.2 Hollow fiber renewal liquid membrane module (HFRLM)
A hollow fiber module containing 50 polypropylene fibers, which were supplied from the Persian Polymer Company, fabricated and prepared for laboratory scale. The main characteristics of the fabricated module are given in Table 1. Furthermore, characterization of utilized hollow fibers by taking SEM images as well as measuring the porosity of membrane has been carried out.| Shell characteristics | |
|---|---|
| Material | Glass |
| Length, (cm) | 35 |
| Internal diameter, 2Ri (cm) | 0.6 |
| Outer diameter (cm) | 0.9 |
| Fiber characteristics | |
|---|---|
| Material | PP (polypropylene) |
| Number of fibers in module | 50 |
| Effective length, l (cm) | 30 |
| Internal diameter, dint (μm) | 275 |
| External diameter, dext (μm) | 375 |
| Effective surface area of module, Aeff (m2) | 6.9 × 10⁻³ |
| Membrane porosity, ε | 0.4 |
| Membrane tortuosity, τ | 2 |
The SEM images of the surface and cross section of hollow fibers were captured with a Scanning Electron Microscope (SEM: model of ZEISS EVO-18). The samples were broken in liquid nitrogen.
Due to measure the bulk porosity of the fibers, the sample hollow fibers were first weighed (w1). Then the weighted fibers were immersed in kerosene solution for 72 hours. By assumption of filling all the empty voids with the liquid membrane phase, the fully impregnated fibers were removed from the kerosene. Any excess kerosene on the outer surface of the fibers was wiped away. Next, the fibers were quickly weighed again. Therefore, the volume of empty void (V) of hollow fiber wall can be calculated by the following relation:
 | (20) |
 . An average value of the porosity which measured for three sets of fibers is about 40%.
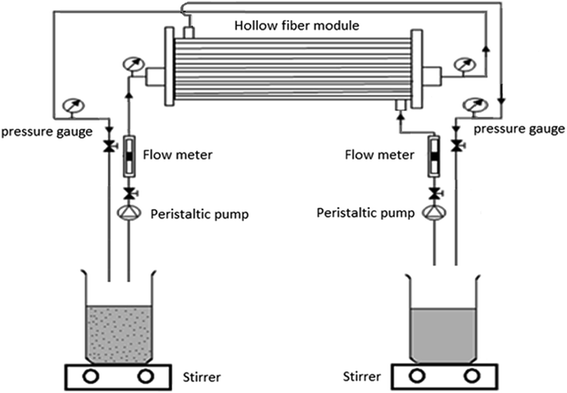
In addition, a schema of HFRLM system in the recycling and counter current mode is represented in Fig. 2.
Thorium concentration in the aqueous phase is measured by inductively coupled plasma optical emission spectrometry (ICP-OES: model Liberty 220 Varian) analyzer.
Impregnating the pores of fibers with the liquid membrane (TBP diluted in kerosene) is carried out by passing the LM phase through the fibers in the flow rate of 2.3 mL min−1 for 30 min. After that, the stirred mixture of LM and the aqueous donor phase at the volume ratio of the aqueous to organic phase (A/O) of 20![[thin space (1/6-em)]](https://www.rsc.org/images/entities/char_2009.gif) :
:![[thin space (1/6-em)]](https://www.rsc.org/images/entities/char_2009.gif) 1 is pumped through the lumen side of the module while the aqueous acceptor phase (stripping solution) flows through the shell side in counter current mode. The outlet streams of both sides of the module are recycled back to the respective reservoir tanks with volumes of 250 mL. The flow rates of lumen and shell sides are carefully controlled in the range of 2.3–10.6 and 5.6–10.6 mL min−1, respectively. In order to avoid mixing of the phases in the module, it is necessary to perform a positive pressure on the shell side. The pressure difference between the shell and lumen side is maintained at 0.3 bar. Samples of approximately 1 mL are taken from of the feed and strip reservoir tanks at regular time intervals and Th(IV) concentration in the aqueous phases is measured by using ICP-OES.
1 is pumped through the lumen side of the module while the aqueous acceptor phase (stripping solution) flows through the shell side in counter current mode. The outlet streams of both sides of the module are recycled back to the respective reservoir tanks with volumes of 250 mL. The flow rates of lumen and shell sides are carefully controlled in the range of 2.3–10.6 and 5.6–10.6 mL min−1, respectively. In order to avoid mixing of the phases in the module, it is necessary to perform a positive pressure on the shell side. The pressure difference between the shell and lumen side is maintained at 0.3 bar. Samples of approximately 1 mL are taken from of the feed and strip reservoir tanks at regular time intervals and Th(IV) concentration in the aqueous phases is measured by using ICP-OES.
3 Results and discussion
3.1 SEM analysis of fibers
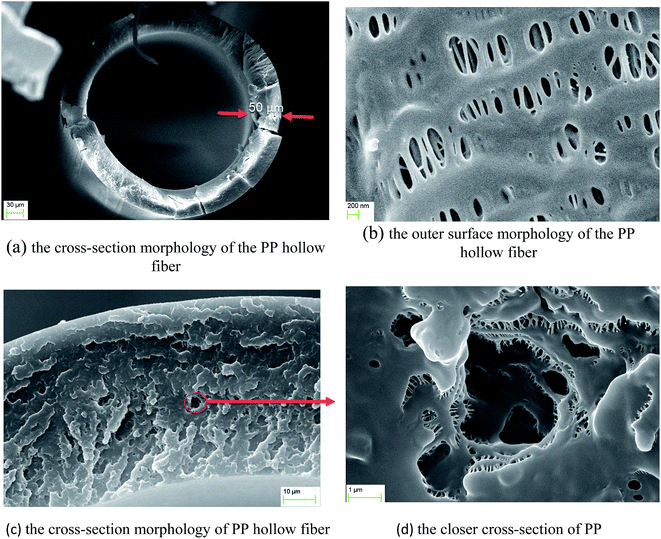
Scanning electron micrographs of hollow fiber are shown in Fig. 3(a)–(d). From the micrograph of Fig. 3(a), the outer and inner diameter of the fibers are measured about 375 and 275 μm, respectively which is properly in agreement with the data of manufacture fibers (Table 1). From the micrograph of Fig. 3(b), the dimension of the pores is measured less than 200 nm. Fig. 3(c) and (d) illustrate a closer view of cross section of fibers which indicate the porosity of the utilized hollow fiber.3.2 Concentration distribution of thorium in the hollow fiber module
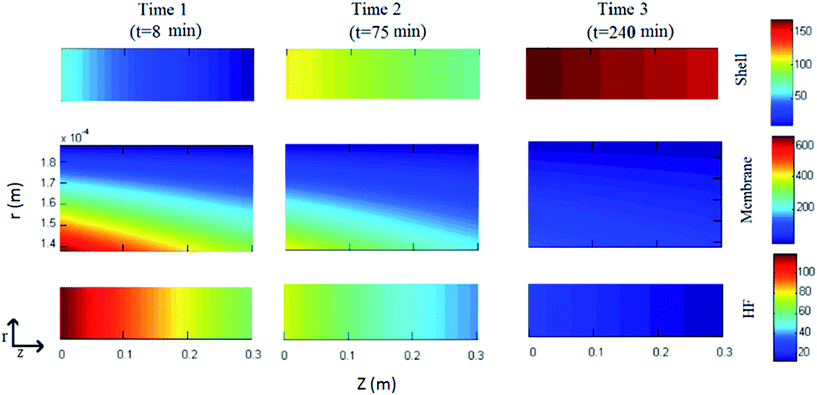
For a typical experiment run, the concentration distribution of thorium in the lumen, the liquid membrane and the shell sides of the module at different time intervals is illustrated in Fig. 4. The stirred mixture of the donor and the LM phase enters from one side of the module (z = 0), whereas the strip solution enters from the opposite side (z = 1). As the feed passes through the fibers, due to the transport of Th(IV) into the liquid membrane, the Th(IV) concentration is reduced along the fibers. At the shell side of the module, the back extraction of thorium occurs and consequently the thorium concentration at the outlet stream is higher than inlet stream. As shown in Fig. 4, by the time, the axial and radial Th(IV) concentration gradients in various parts of module (shell, HF, LM) are reduced.Mass transfer rate of Th(IV) from the tube side to the shell side is shown in the Fig. 5 at various times. The results indicate that the rates are equal to each other during considered time interval. Thus, over each time interval, the steady state condition in the liquid membrane is obtained. This finding is due to the low mass transfer resistance of LM in comparison with ones in feed and shell sides. Therefore, for reduction of the computational complexity and time, a pseudo steady state model for HFRLM process can be used.
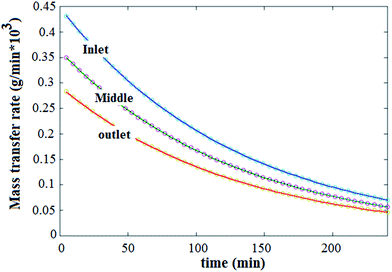 | ||
| Fig. 5 Mass transfer rate of Th(IV) at various time, from feed side (solid lines) into the shell side (circles). | ||
3.3 Effect of carrier concentration on the mass transfer performance of HFRLM
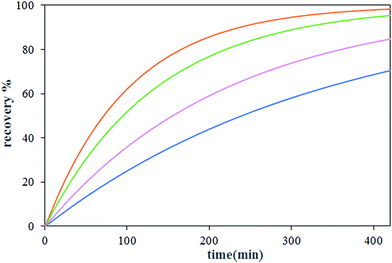
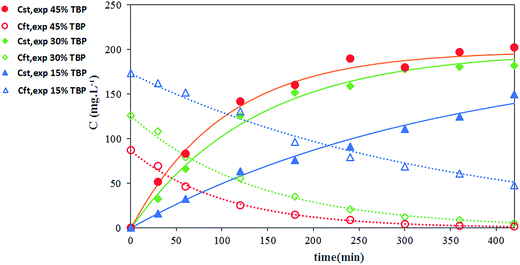
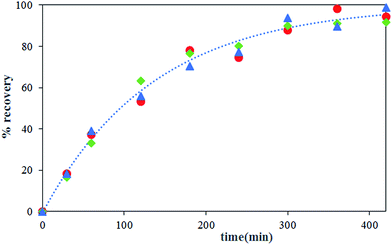
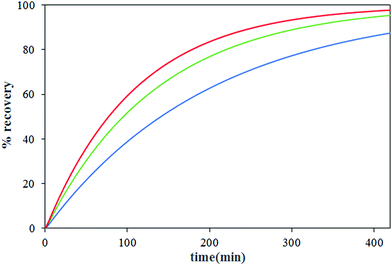
The effect of carrier concentration on Th(IV) transport rate through HFRLM is shown in Fig. 6 and 7. Fig. 6 indicates that after 420 min an increase in the carrier concentration from 15 to 45% leads to the increase of recovery efficiency by 40% at the same feed and strip flow rates of 5.6 mL min−1. This is related to the improvement of the uptake capacity of the liquid membrane on its interface to the feed side, while, the increase of the carrier concentration higher than 30% (v/v) TBP is less effective on the transport of Th(IV). As can be seen in this Fig. 7, the simulation results are in good agreement with the experimental data. According to eqn (16), the increase of the carrier concentration leads to an increase in the distribution coefficient of the Th(IV) extraction. Thus, by assuming instantaneously formation of solute-carrier complexes at the aqueous–organic interface, an increase in the concentration of Th(IV)–TBP complex at the renewal layer and in the renewal layer–LM interface leads to enhancement of driving force of Th(IV) transport through the HFRLM and consequently the mass transfer rate as well. Since the distribution coefficient of the back-extraction of Th(IV) is much less than that of the extraction one, an increase in the carrier concentration leads to the facilitation of Th(IV) transport through the HFRLM.The variation of Th(IV) concentration at the reservoir tanks is also shown in Fig. 7. According to this figure, an increase in the concentration of TBP in kerosene from 15 to 30% (v/v) leads to an increase in the Th(IV) transfer rate so that recovery of 50% is achieved after 244 and 92 min, respectively. Moreover, simulation results illustrate that at the carrier concentration of 45%, the recovery of 50% is obtained at 72 min which indicates that the increase of carrier concentration over than 30% has no significant effect on mass transfer rate. Furthermore, increasing the carrier concentration from 15 to 45% volume percent causes an increase in the distribution coefficient of the extraction process as well, which leads to a decrease in the initial solute concentrations of the donor phase, which is in equilibrium with liquid membrane droplets.
3.4 The influence of concentration of nitrate ion in feed
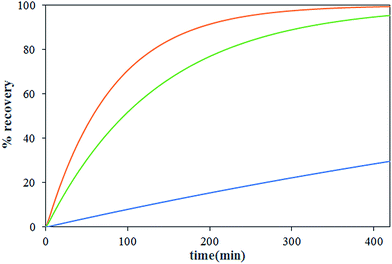
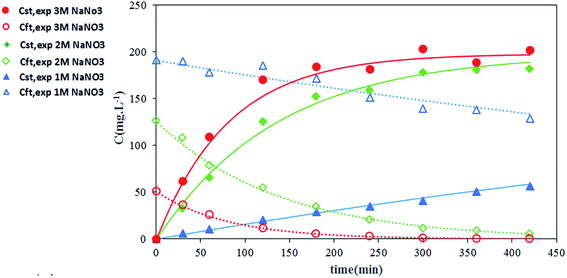
The effect of nitrate ion concentration in the feed phase is illustrated in Fig. 8 and 9 at various sodium nitrate concentrations of 1 M, 2 M and 3 M. According to eqn (16), an increase in the nitrate concentration of the feed phase causes the enhancement of the extraction distribution coefficient of Th(IV), which in turn enhances the extraction of metal ion from feed side and the transport of solute through the HFRLM as well. Furthermore Fig. 8 indicates that the increasing of the nitrate ion concentration of the feed phase from 1 M to 2 M causes a 3 times enhancement in thorium recovery, whereas a higher concentration has no significant effect on the recovery of Th(IV). As shown in Fig. 9, by increasing the nitrate ion concentration, the uphill effect takes place at a shorter time, which indicates the enhancement of the mass transfer rate. In addition, this figure shows that there is a good agreement between the calculated and experimental data.3.5 Effect of initial concentration of Th(IV) in the feed phase
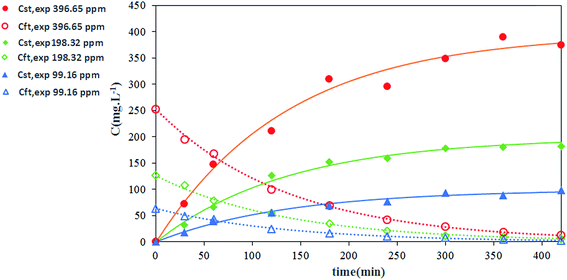
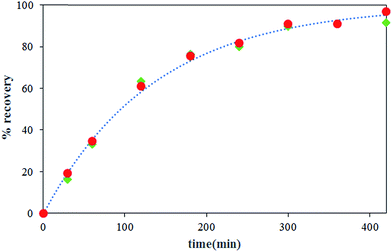
The transportation of Th(IV) via the HFRLM system at different initial concentration of Th(IV) in the feed (99.16, 198.32, 396.65 mg L−1) has been carefully studied. The variation of the recovery efficiency and Th(IV) concentration at the reservoir tanks are shown in Fig. 10 and 11, respectively. The presented results in Fig. 10 indicate that the recovery profile is almost the same at all investigated experimental conditions. The maximum recovery obtained at TBP concentration of 30% (v/v), nitrate ion concentration of 2 M and 0.1 M in the feed and strip phases respectively, is 95.3% after 420 min. Since the free concentration of TBP is much higher than Th(IV)–TBP complex, the distribution coefficients of the extraction and back extraction at all investigated conditions are similar according to eqn (16), so the recovery efficiency of experiments is the same as well. In addition, at the diluted conditions, same as the condition of this study, the transport properties might be assumed constant. Thus, the uphill effect takes place at the same time. Moreover, increasing of Th(IV) concentration of the feed could shift the equilibrium equation towards the formation of a more Th(IV)–TBP complex at the feed–membrane interface. Thus, this causes the enhancement of the mass transfer driving force and more solute transports through the hollow fiber renewal system as shown in Fig. 11. Furthermore, the experimental data can prove this claim. This observation has been made by Vernekar et al., who modeled Cobalt(II) transport through a HFSLM in the recycling mode.273.6 Effect of flow rate
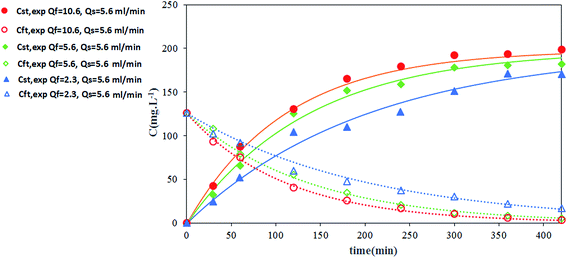
The effects of flow rate of the strip and feed phases on thorium recovery are shown in Fig. 12 and 13, respectively. As shown in these figures, although the recovery of thorium has been increased by increasing the tube side flow rate, the increasing of strip phase flow rate has no significant effect on the recovery of thorium. This indicates that the mass transfer resistance in the tube side is higher than the shell side, which is in agreement with our previous study.25 Enhancement of the tube side velocity causes a decrease in the renewal layer thickness and an increase in the renewal rate of organic layer at the inner surface of hollow fiber, which leads to an increase in the local mass transport coefficient. Furthermore, Fig. 14 shows the variation of Th(IV) concentration with time at the reservoir tanks. This figure shows that the calculated results are in good agreement with experimental data.3.7 Accuracy of the mathematical model
Accuracy of developed model has been measured as the average relative error. The calculated error using by using eqn (19) is less than 10% and this shows the validity of the developed model.28,294 Conclusions
In this paper, a rigorous mathematical model has been presented to simulate thorium recovery from an acidic medium through the HFRLM in the recycle mode. The model's predictions have been validated by the experimental data. The important findings of this study are given as following:(1) The mass transfer rate of Th(IV) from the feed to the LM phase is equal to that of the LM to the stripping phase during each time interval. Thus, considering the steady state condition in the liquid membrane might be a correct assumption, due to the low mass transfer resistance of the LM in comparison with the ones in the feed and shell sides. Therefore, for reduction of the computational complexity and time, a pseudo steady state model for recycling mode of the HFRLM process can be used.
(2) Experimental results show that increasing the carrier concentration, the tube side flow rate as well as nitrate ion concentration of the feed phase, could increase the recovery of solute. While, enhancement of the shell side flow rate and initial thorium concentration have no significant effect on recovery efficiency of thorium.
(3) Finally, the calculated date are found to be in good agreement with the experimental results, which indicates that the developed model might be a useful tool for the design and scale-up of the HFRLM process for recovery of thorium from acidic waste solution.
Nomenclature
Abbreviations
| HFRLM | Hollow fiber renewal liquid membrane |
| HFSLM | Hollow fiber supported liquid membrane |
| LM | Liquid membrane |
| TBP | Tri-butyl phosphate |
Symbols
| Aeff | Effective mass transfer area, m2 |
| A | Cross sectional area of passing fluid, m2 |
| C | Concentration, mol m−3 |
| D | Diameter, m |
| Deff | Effective diffusivity, m2 s−1 |
| Din | Inner diameter of fiber, m |
| Dout | Outer diameter of fiber, m |
| D0 | Diffusivity of solute in liquid membrane phase, m2 s−1 |
| K | Local mass transfer coefficient, m s−1 |
| keq | Equilibrium constant, kmol m−3 |
| l | Effective length of hollow fiber, m |
| m | Distribution coefficient of extraction process |
| M | Molecular mass of diluent, kg mol−1 |
| NA | Mass transfer flux of solute, mol m2 s−1 |
| n | Number of hollow fibers in module |
| O | Organic phase volume, m3 |
| P | Wetted perimeter, m |
| Qs | Volumetric flow rate of the strip phase, m3 s−1 |
| Qf | Volumetric flow rate of the feed phase, m3 s−1 |
| Ri | Internal radius of the shell side of the module, m |
| R% | Recovery efficiency, % |
| rin, rout | Internal and external radii of hollow fiber, m |
| r | Radial direction, m |
| t | Time, s |
| T | Absolute temperature, K |
| Vt | Volume of the reservoir tank, m3 |
| VM | Molar volume of extractant, m3 mol−1 |
| x | Association parameter of diluent |
| z | Longitude direction, m |
Greek letters
| ε | Porosity of hollow fiber membrane support |
| τ | Tortuosity of hollow fiber membrane support |
| μ | Viscosity of solvent (extractant + diluent), Pa s |
| ρK | Density of kerosene (Kg m−3) |
Superscripts
| Cal | Calculated |
| exp | Experimental |
| ext | External |
| int | Internal |
Subscripts
| A | Acceptor phase |
| aq. | Aqueous phase |
| f | Feed phase |
| fin | Inlet feed phase to the reservoir tank |
| ft | Feed phase in the reservoir tank |
| ft0 | Initial feed phase in the reservoir tank |
| init | Initial |
| m | Membrane phase |
| mi | Interfacial surface at the inner liquid membrane phase |
| org | Organic phase |
| R | Renewal layer |
| Ri | Interfacial surface at the inner renewal layer |
| s | Strip phase |
| si | Interfacial surface of the liquid membrane and strip phases |
| sin | Inlet strip phase to the reservoir tank |
| st | Strip phase in the reservoir tank |
| t | Reservoir tank |
References
- M. Metaxas, V. Kasselouri-Rigopoulou, P. Galiatsatou, C. Konstantopoulou and D. Oikonomou, J. Hazard. Mater., 2003, 97, 71 CrossRef CAS PubMed.
- V. Dekoussar, G. R. Dyck, A. Galperin, C. Ganguly, M. Todosow and M. Yamawaki, Thorium fuel cycles: potential benefits and challenges, in, International atomic energy agency (IAEA), Vienna, 2005 Search PubMed.
- K. Gupta, V. Manchanda, M. Subramanian and R. Singh, Solvent Extr. Ion Exch., 2000, 18, 273 CrossRef CAS.
- E. B. M. F. San Román, R. Ibanez and I. Ortiz, J. Chem. Technol. Biotechnol., 2010, 85, 2 CrossRef.
- A. Kiani, R. Bhave and K. Sirkar, J. Membr. Sci., 1984, 20, 125 CrossRef CAS.
- Q. Yang and N. M. Kocherginsky, J. Membr. Sci., 2006, 286, 301 CrossRef CAS.
- F. J. Alguacil, M. Alonso, F. Lopez, A. López-Delgado, I. Padilla and H. Tayibi, Chem. Eng. J., 2010, 157, 366 CrossRef CAS.
- K. Wieszczycka, M. Regel-Rosocka, K. Staszak, A. Wojciechowska, M. T. A. Reis, M. R. C. Ismael, M. L. F. Gameiro and J. M. Carvalho, Sep. Purif. Technol., 2015, 154, 204 CrossRef CAS.
- X. P. Dai, Z. F. Yang, R. G. Luo and K. K. Sirkar, J. Membr. Sci., 2000, 171, 183 CrossRef CAS.
- Z. Ren, W. Zhang, H. Meng, J. Liu and S. Wang, J. Membr. Sci., 2010, 365, 260 CrossRef CAS.
- Z. Ren, W. Zhang, Y. Liu, Y. Dai and C. Cui, Chem. Eng. Sci., 2007, 62, 6090 CrossRef CAS.
- Z. Ren, W. Zhang, H. Li and W. Lin, Chem. Eng. J., 2009, 146, 220 CrossRef CAS.
- Z. Ren, X. Zhu, W. Liu, W. Sun, W. Zhang and J. Liu, Chin. J. Chem. Eng., 2014, 22, 1187 CrossRef CAS.
- Z. Ren, W. Zhang, Y. Lv and J. Li, Biotechnol. Prog., 2009, 25, 468 CrossRef CAS PubMed.
- J. S. Carletto, R. M. Luciano, G. C. Bedendo and E. Carasek, Anal. Chim. Acta, 2009, 638, 45 CrossRef CAS PubMed.
- Z. Dingjie, J. Yue and L. Xiaolong, Ind. Water Treat., 2009, 11, 019 Search PubMed.
- W. Zhang, C. Cui, Z. Ren, Y. Dai and H. Meng, Chem. Eng. J., 2010, 157, 230 CrossRef CAS.
- A. Fortuny, M. T. Coll and A. M. Sastre, Desalination, 2014, 343, 54 CrossRef CAS.
- C. Yun, R. Prasad and K. Sirkar, Ind. Eng. Chem. Res., 1993, 32, 1186 CrossRef CAS.
- M. F. San Román, E. Bringas, R. Ibanez and I. Ortiz, J. Chem. Technol. Biotechnol., 2010, 85, 2 CrossRef.
- Z. Ren, W. Zhang, Y. Dai, Y. Yang and Z. Hao, Ind. Eng. Chem. Res., 2008, 47, 4256 CrossRef CAS.
- Z. Ren, Y. Yang, W. Zhang, J. Liu and H. Wang, J. Membr. Sci., 2013, 439, 28 CrossRef CAS.
- S. Michaud, M. Miguirditchian, G. Deblonde, B. Dinh, X. Hérès and G. Andreoletti, Procedia Chem., 2012, 7, 251 CrossRef CAS.
- M. Benedict, T. H. Pigford and H. W. Levi, Nuclear Chemical Engineering, McGraw Hill Book Company, 1981 Search PubMed.
- S. A. Allahyari, A. Minuchehr, S. J. Ahmadi and A. Charkhi, J. Membr. Sci., 2016, 520, 374 CrossRef.
- C. R. Wilke and P. Chang, AIChE J., 1955, 264 CrossRef CAS.
- P. V. Vernekar, Y. D. Jagdale, A. W. Patwardhan, A. V. Patwardhan, S. A. Ansari, P. K. Mohapatra and V. K. Manchanda, Chem. Eng. Res. Des., 2013, 91, 141 CrossRef CAS.
- P. Kandwal, S. Dixit, S. Mukhopadhyay and P. K. Mohapatra, Chem. Eng. J., 2011, 174(1), 110 CrossRef CAS.
- P. J. Harrington and G. W. Stevens, J. Membr. Sci., 2001, 192(1), 83 CrossRef CAS.
| This journal is © The Royal Society of Chemistry 2017 |

