DOI:
10.1039/C6RA24801B
(Paper)
RSC Adv., 2017,
7, 1852-1862
Thin skinned asymmetric polybenzimidazole membranes with readily tunable morphologies for high-performance vanadium flow batteries
Received
6th October 2016
, Accepted 28th November 2016
First published on 12th January 2017
Abstract
A series of thin skinned asymmetric polybenzimidazole (PBI) membranes with readily tunable morphologies are fabricated by leaching out the porogen dibutyl phthalate (DBP), for vanadium flow batteries (VFBs). The ultrathin defect-free skin layer fully guarantees high ion selectivity of the membrane. Meanwhile, the area resistance (AR) of the asymmetric PBI membrane is dramatically reduced compared to that of the dense one because of interconnected macro-pores in the sublayer. The membrane morphologies and properties are readily adjusted by varying the porogen content (0–300 wt%), thus managing well the trade-off between AR and ion selectivity. The membrane prepared by adding 200 wt% porogen has a high porosity of 74.9 vol% and an appropriately dense skin thickness of 4.9 μm, and yields the best balance between AR and ion selectivity, assembled with which the flow battery achieves excellent cell performances (coulombic efficiency, CE: 99.0%; energy efficiency, EE: 82.3%) as well as a moderate capacity decay rate (CDR, 0.4% per cycle) at 80 mA cm−2 over cycling. The thin skinned asymmetric PBI membranes prepared here surpass the commercial Nafion 211 membrane (CE: 84.6%; EE: 68.1%; CDR: 1.3% per cycle) in terms of cell performances and cost, becoming a promising candidate for VFBs.
1. Introduction
For the imperative needs in electric network management (peak load shifting) of renewable energy sources, scalable energy storage is necessary to smooth electricity generated by renewable electricity sources such as solar and wind energy.1–4 Redox flow batteries (RFBs) store electricity energy in the form of chemical energy in electrolyte solutions. Their power and energy are independent of each other, so it is easily scaled up. Along with the advantages of high safety, high efficiency and long cycle life, RFBs show great promise for large-scale energy storage.5–9 Among them, the vanadium flow battery (VFB), originally proposed by Skyllas-Kazacos et al.,10,11 is the most extensively developed system because of its easily-handled cross contamination and good electrochemical reversibility.12–15
Membrane or separator is one of the most important components in VFB. It prevents the passage of active species to reduce self-discharge and transfers inactive ions to complete the circuit.16,17 Thus, an ideal membrane should have high ion selectivity and excellent ionic conductivity. Moreover, it should possess high chemical stability to endure the highly oxide and acidic environment in VFB.7,18 The membranes traditionally used in VFB are perfluorosulfonic acid polymers such as Dupont's Nafion, which have satisfactory proton conductivity and excellent chemical stability.1,19 However, their severe vanadium cross contamination and high price have jeopardized the market penetration of VFB.7,18,20 Great efforts have been made to seek an alternative to perfluorosulfonic acid membranes. Up to now, aromatic polymers attached by ion-conductive groups (cation or/and anion) have been extensively exploited in VFB applications. These membranes are low-cost and show high vanadium prevention attributed to the rigid main chain which leads to a poor microphase separation and narrow and tortuous ionic channels.7,21–25 Nevertheless, the application of these membranes in VFB is hampered by their poor chemical stability, which is considered to be induced by the introduction of ion exchange groups.26–30 In order to address this issue, Zhang et al. started to focus on porous membranes for VFBs,31 which separates large vanadium ions from small protons by screening mechanism.31–37 Therefore, nonionic materials could be used, overcoming the traditional shortcomings brought by ion exchange groups. An ideal nonionic porous membrane in VFBs is expected to satisfy the following criteria: pore size should be proper to separate vanadium ions from protons to guarantee high ion selectivity; pores should be interconnected and porosity should be high enough to promote proton transport.35 However, the sizes of the ions are so tiny (diameters of hydrated vanadium ions and protons are around 0.6 nm and 0.3 nm, respectively)38–40 that it is difficult to precisely control the pore size and the membrane morphology (e.g., porosity and pore connectivity) to meet the requirements.31,33,34,36,41,42
Recently, polybenzimidazoles (PBI) as membrane materials have attracted much attention in VFB applications.43–48 A pristine PBI membrane is an ionic non-conductor. When doped with strong acid solutions, it could transfer protons owing to the existence of –N![[double bond, length as m-dash]](https://www.rsc.org/images/entities/char_e001.gif) groups in the imidazole rings of PBI.43,46,49,50 Considering the highly acidic environment of VFB, PBI seems to suit the system well and could be free from the issue of acid loss. Zhao et al. first reported the use of PBI membrane in VFB,43 demonstrating that the membrane has extremely low vanadium cross-contamination and the PBI-based VFB shows a substantially high coulombic efficiency (CE, 99%) and a low capacity decay rate (0.3% per cycle). Li et al.46 and Wessling et al.44 reported porous PBI membranes prepared by a water vapor induced phase inversion method for VFB, successively. These membranes possessed a highly symmetrical cross-sectional morphology, consisting of uniformly distributed and disconnected pores. The acid doped in the PBI pores enhanced the ionic conductivity of the membrane while the abundant ultra-thin pore-walls ensured the high selectivity of the membranes. These membranes are proved to have high ion selectivity and chemical stability for VFBs. Moon et al.47 reported PBI membrane with nanoporous structures for VFB and first exploited the amphoteric properties of nanoporous PBI membranes in VFB. In order to reduce the area resistance (AR) of dense PBI membranes for VFB, our previous work45 proposed a concentrated acid preswelling strategy to improve the acid-doping level (ADL) of dense PBI membranes and demonstrated the importance of ADL in the performance of acid-doped PBI systems. Very recently, Hong et al.48 developed dense PBI membranes containing benzimidazole side groups for VFB. The introduction of additional benzimidazole side groups changed the PBI membrane from a semi-crystalline structure to a completely amorphous structure, improving its acid absorption capability and proton conductivity. The investigations above demonstrated that PBI membrane is a promising candidate for VFB applications and the key is how to decrease the AR of the membrane and maintain its high ion selectivity at the same time.
groups in the imidazole rings of PBI.43,46,49,50 Considering the highly acidic environment of VFB, PBI seems to suit the system well and could be free from the issue of acid loss. Zhao et al. first reported the use of PBI membrane in VFB,43 demonstrating that the membrane has extremely low vanadium cross-contamination and the PBI-based VFB shows a substantially high coulombic efficiency (CE, 99%) and a low capacity decay rate (0.3% per cycle). Li et al.46 and Wessling et al.44 reported porous PBI membranes prepared by a water vapor induced phase inversion method for VFB, successively. These membranes possessed a highly symmetrical cross-sectional morphology, consisting of uniformly distributed and disconnected pores. The acid doped in the PBI pores enhanced the ionic conductivity of the membrane while the abundant ultra-thin pore-walls ensured the high selectivity of the membranes. These membranes are proved to have high ion selectivity and chemical stability for VFBs. Moon et al.47 reported PBI membrane with nanoporous structures for VFB and first exploited the amphoteric properties of nanoporous PBI membranes in VFB. In order to reduce the area resistance (AR) of dense PBI membranes for VFB, our previous work45 proposed a concentrated acid preswelling strategy to improve the acid-doping level (ADL) of dense PBI membranes and demonstrated the importance of ADL in the performance of acid-doped PBI systems. Very recently, Hong et al.48 developed dense PBI membranes containing benzimidazole side groups for VFB. The introduction of additional benzimidazole side groups changed the PBI membrane from a semi-crystalline structure to a completely amorphous structure, improving its acid absorption capability and proton conductivity. The investigations above demonstrated that PBI membrane is a promising candidate for VFB applications and the key is how to decrease the AR of the membrane and maintain its high ion selectivity at the same time.
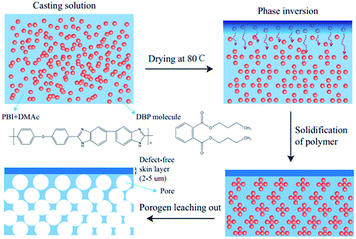
In this paper, we endeavor to develop a porous membrane that satisfies the criteria of an ideal porous membrane mentioned previously for VFB, that is, possessing high ion selectivity, interconnected pores as well as high porosity. Taking advantage of high vanadium ion prevention and proton transport ability of PBI materials, we propose and fabricate a series of porous PBI membranes with ultrathin defect-free skin layers by leaching out the porogen dibutyl phthalate (DBP) for VFB applications. Although this is a common method to introduce pores to PBI membranes, related literatures mostly focused on the improvement of ADL and proton conductivity, and rarely gave the ion selectivity or described the same membrane morphology as the one exhibited here.51–55 In this work, we will demonstrate that an integrally thin skinned asymmetric PBI membrane with a defect-free skin layer can be fabricated by this common method and possible membrane formation mechanism is also proposed. The presence of the defect-free skin layer fully guarantees high ion selectivity of the membrane, circumventing the difficult control of pore sizes. Meanwhile, the membrane morphology could be readily adjusted by varying the porogen content, including skin thickness, pore connectivity and porosity, which provides a facile method to facilitate proton transport. As a result, the conductivity–selectivity dilemma in porous membranes is disentangled. The effects of porogen content on membrane morphology, cell performance, capacity retention ability during cycling test, etc. are carefully studied and the membrane with an optimal porogen content is also obtained, assembled with which VFB demonstrates excellent overall electrochemical performances.
2. Experimental
2.1 Materials
Poly(4,4′-diphenylether-5,5′-bibenzimidazole) (indicated as PBI) was provided by Shanghai Shengjun Plastics Technology Co., Ltd. Its density is 1.25 g cm−3, which was determined from Archimedes' principle56 using a density measurement kit (Mettler-Toledo GmbH, P706039, Switzerland) and a Mettler-Toledo Balance (XS204, Mettler-Toledo, Switzerland). The buoyant liquid used for the measurement was cyclohexanone. DBP and N,N-dimethylacetamide (DMAc) were used as porogen and solvent, and purchased from Tianjin Bodi Chemical Co., Ltd. and Tianjin Fuyu Fine Chemical Co., Ltd., respectively. The benchmark Nafion membrane was purchased from DuPont Company (USA).
2.2 Membrane preparation
The thin skinned asymmetric PBI membranes were fabricated by casting the mixture of PBI and DBP. Firstly, dried PBI polymer was dissolved in DMAc under mechanical stirring at 50 °C overnight to form 2 wt% solutions, and then DBP was added. The weight ratios of DBP to PBI were designed to be 0 wt%, 100 wt%, 200 wt%, 250 wt% and 300 wt%. The solutions were stirred for further hours to form homogeneous solutions, degassed by vacuum and poured onto clean glass plates in sequence. After drying at 80 °C for 12 h, the membranes were formed, detached from the glass and immersed in methanol at room temperature overnight to leach DBP out as well as to remove the residual solvent. After drying, asymmetric PBI membranes consisting of ultrathin defect-free skin layers and macro-porous sublayers were obtained. The membrane mass per unit area was kept the same for all the membranes with different porogen contents. All of the prepared membranes were doped with H2SO4 by dipping them in 3.0 M H2SO4 solutions at 30 °C for 24 h before use.
2.3 Membrane characterization
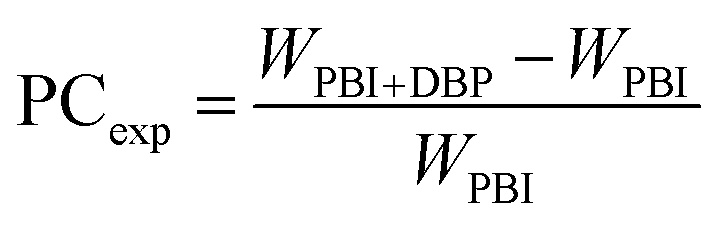
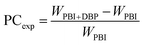
Experimental value of porogen content and porosity. The experimental values of porogen contents (denoted as PCexp) were obtained by the weight method. They were calculated by the following equation:| |
 | (1) |
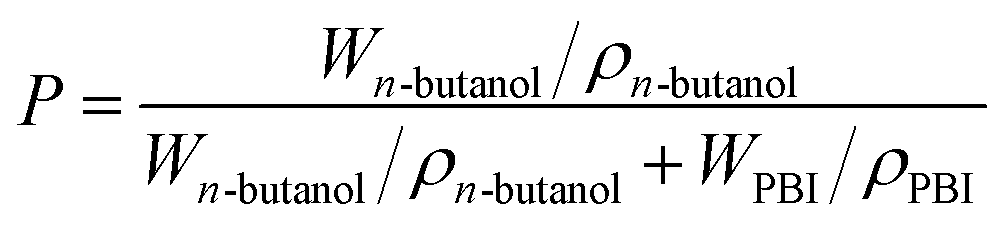
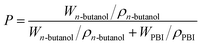
where WPBI+DBP and WPBI are the weights of dried membranes before and after leaching out the porogen, respectively.The porosity (denoted as P) of the asymmetric PBI membrane was measured by immersing the membrane in n-butanol for 24 h.57 Then the membrane was wiped with a tissue to get rid of the extra n-butanol on the membrane surface. The porosity was calculated by the following equation:
| |
 | (2) |
where
Wn-butanol is the weight difference of the membrane before and after immersion,
i.e., the mass of
n-butanol filling in the membrane,
WPBI is the mass of the dried membrane,
ρn-butanol is the density of
n-butanol (
ρn-butanol = 0.81 g cm
−3), and
ρPBI is the density of the polymer studied in this work (
ρPBI = 1.25 g cm
−3).
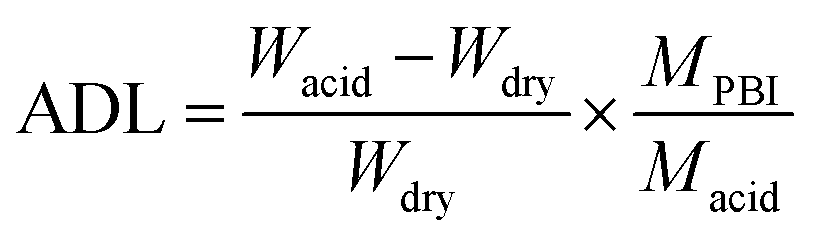
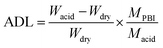
Acid doping level (ADL). ADL is defined as the molar ratio of acid molecules to PBI repeat unit in hybrid membranes. To determine it, membrane samples were immersed in 3.0 M H2SO4 at 30 °C for 24 h. Then the excess acid on the membrane surface was wiped off with a tissue. Afterwards, the membranes were dried at 80 °C in vacuum and weighed for several times until the value become unchanged. Water evaporated during the drying process and the ADL was calculated by the following equation:| |
 | (3) |
where Wdry and Wacid are the mass of the dried PBI membranes before and after doping with acid, respectively. Macid and MPBI are the molecular weights of sulfuric acid (98 g mol−1) and repeat unit of PBI (400 g mol−1), respectively.
Field emission scanning electronic microscopy (FE-SEM). The micromorphology of surface and cross-section of the prepared PBI membranes were investigated in detail with the help of FE-SEM (Nova NanoSEM 450). Cross-sections were exposed by breaking sample membranes in liquid nitrogen and all the samples were sprayed with gold before measurement.
CO2/N2 separation factor. To further confirm whether the skin layer is defect-free or not, CO2/N2 separation factor (α(CO2/N2)) of the asymmetric PBI membrane was measured using the time-lag method58 at room temperature. We shall consider permeance Ji of CO2 and N2 and their ideal separation factor which is defined as J(CO2)/J(N2). Ji = Qi/AΔP, where Qi is the gas flux, A is the membrane area and ΔP is the pressure differential.
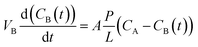
Vanadium permeability. The vanadium permeability of the prepared PBI membrane and Nafion 211 was measured using a membrane separated diffusion cell similar to the one reported in literature.59,60 An aqueous solution of 1.5 M VOSO4 in 3.0 M H2SO4 was separated by the membrane from an aqueous solution of 1.5 M MgSO4 in 3.0 M H2SO4 with the same volume. Both solutions were vigorously stirred to mitigate concentration polarization. 2 mL of the sample was taken out from the MgSO4 side at time intervals of 12 h and the absorbance of the sample at the wavelength of 762 nm was measured by UV-vis spectrometer (PERSEE, China). After the test, the samples were poured back to the diffusion cell. The corresponding vanadium concentrations were obtained according to the standard absorbance/concentration line measured in advance. The vanadium permeability calculated based on the Fick's diffusion law is shown as eqn (4):| |
 | (4) |
where VB is the volume of MgSO4 solution which is 60 mL in this work, t is time, CB(t) is the permeated VO2+ concentration in the MgSO4 reservoir over time, A is the effective area of the tested membranes, L denotes the membrane thickness, P is the permeability of VO2+, and CA is the VO2+ concentration in the VOSO4 compartment.
Area resistance (AR). The ARs of the prepared PBI membranes and Nafion 211 were measured in a conductive cell at room temperature by electrochemical impedance spectroscopy (Ivium Technologies, the Netherlands). The cell was separated by the tested membrane into two compartments which are filled with aqueous solutions of 3.0 M H2SO4. The AR is calculated according to the following equation:where S is the effective membrane area, r1 is the electric resistance of the cell assembled with a sample membrane, and r2 is the value without membranes.
Mechanical properties. The mechanical properties of the developed PBI membranes and Nafion 211 were measured using a tensile machine (CMT8502, Shenzhen SANS Testing Machine Co. Ltd, China) at room temperature. The tensile speed applied is 10 mm min−1. All the samples were immersed in solutions of 3.0 M H2SO4 for 24 h before the test.
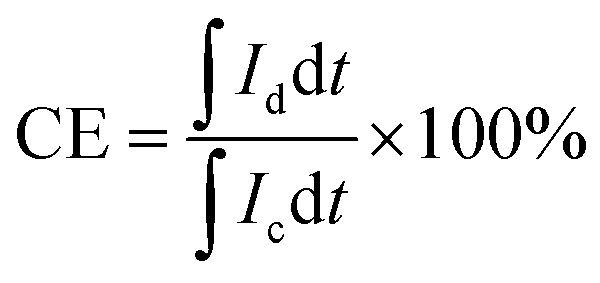
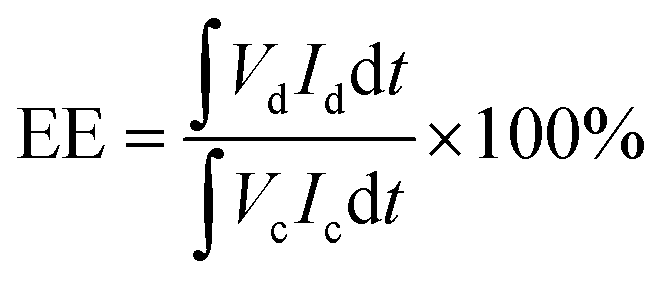
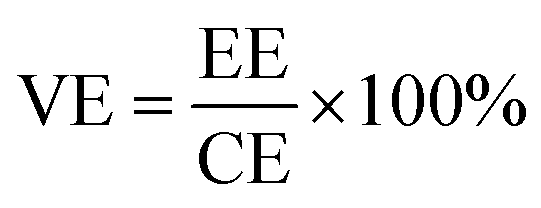
VFB single cell performance. The flow cell performance of all the membranes were evaluated using a home-made vanadium flow battery system, which consists of a single cell, two magnetic pumps, two glass-made reservoirs and a number of PTFE tubes. The single cell includes a membrane or a separator, two pieces of carbon felt used as electrodes, two graphite polar plates and two epoxy fiber glass end plates. The carbon felt were thermally treated in air at 400 °C for 6 h before use to improve their electrochemical activity and hydrophilicity, and a compression rate of about 20% was expected when the carbon felt electrodes were assembled in the cell. The effective area of the membrane was 9 cm2. Solutions of 1.5 M V2+/V3+ in 3.0 M H2SO4 and 1.5 M VO2+/VO2+ in 3.0 M H2SO4 were used as the negative and positive electrolytes, respectively, and reserved in two reservoirs. The electrolyte in each side was 40 mL in volume and cycled through the corresponding electrodes in pipe lines by pump. The single cell tests were carried out by a LANHE battery tester (CT2001A, 5V/1A) and were operated under the current range of 20–100 mA cm−2 to investigate the effect of different current densities on the cell performance. The batteries were charged to 1.65 V and then discharged to 0.8 V in one cycle, to avoid the corrosion of carbon felts and graphite polar plates. The electrolyte reservoirs were blanketed with N2 and sealed by valves before test to avoid the oxidization of V2+ by the oxygen in air. Cycling test was carried out at 80 mA cm−2 to study the capacity decay and the tolerance of the membranes. The temperature was controlled at around 25 °C during the process. The total concentration of vanadium ions was measured by inductively coupled plasma (ICP, Optima2000DV, Perkinelmer) before and after the cycling test.Coulombic efficiency (CE), energy efficiency (EE) and voltage efficiency (VE) are three important indexes to evaluate cell performance. They are calculated according to eqn (6), (7) and (8), respectively.
| |
 | (6) |
| |
 | (7) |
| |
 | (8) |
where
Id is the discharging current,
Ic is the charging current,
Vd is the discharging voltage and
Vc is the charging voltage.
Chemical stability test. The chemical stability of the developed PBI membrane was studied by immersing sample membranes in VO2+ solutions,30 which contains 1.5 M VO2+ in 3 M H2SO4, at room temperature for 40 days. After the test, the samples were rinsed in deionized water for two days and dried at 80 °C in vacuum until the weight become unchanged. The weights of the samples were recorded before (w0) and after (w) the test, so were the optical photographs. The weight variations of the samples were calculated according to the following equation:| |
 | (9) |
Nafion 211 membrane was treated likewise for comparison.
3. Results and discussion
3.1 Morphologies of thin skinned asymmetric PBI membranes
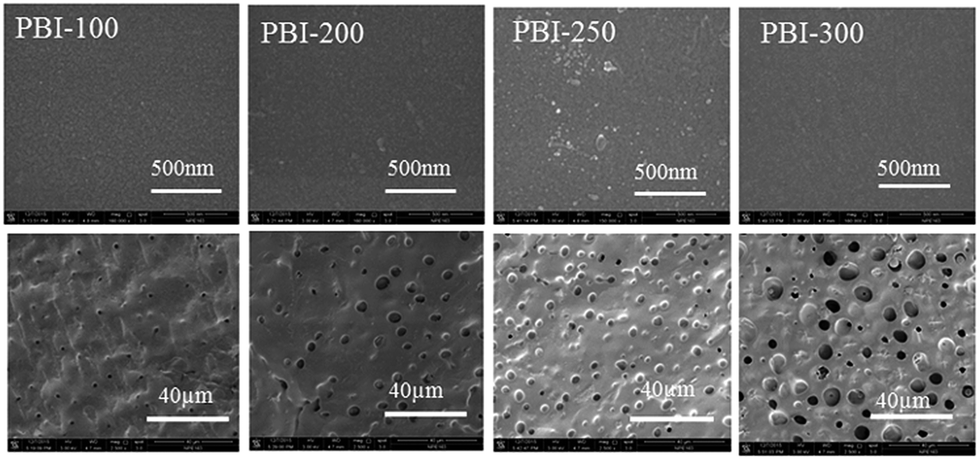
In this work, the morphology of the thin skinned asymmetric PBI membrane is adjusted by varying the porogen content. The compositions of the casting solutions and the properties of the resulting membranes are listed in Table 1. The experimental value of porogen content (PCexp) reflects the amount of porogen leaching out during the methanol extraction. As presented in Table 1, PCexp is close to the initial porogen content for PBI-100 and PBI-200, indicating the highly efficient extraction of DBP with methanol. However, the difference of these two values becomes more obvious for PBI-250 and PBI-300. That's because when the porogen content was as high as 250 wt%, part of porogen leaked out from the bottom of the membranes during the drying process. The porosity of the membranes depends on the porogen content and increases from 42.1 vol% for PBI-100 to 77.6 vol% for PBI-300. It can be noticed that there are significant porosity and thickness changes from PBI-100 to PBI-200 while both thickness and porosity change little from PBI-200 to PBI-300. That is also due to the porogen leakage in PBI-250 and PBI-300 during the formation of the membranes. In addition, some defects form on the skin layer when the porogen content is up to 300 wt% (not shown here). This would also make the test value of porosity of PBI-300 smaller than the actual value, because the defect pores are too large to trap n-butanol in the membrane during the experiment.
Table 1 Compositions of casting solutions and properties of resulting membranes
| Mark |
Porogen content (wt%) |
PCexp (wt%) |
Porosity (vol%) |
Overall thickness (μm) |
Skin thickness (μm) |
Appearance |
| PBI-0 |
0 |
— |
— |
26 ± 1 |
— |
Transparent |
| PBI-100 |
100 |
96.4 ± 0.9 |
42.1 ± 0.6 |
44 ± 1 |
4.2 ± 0.6 (top); 1.9 ± 0.4 (bottom) |
Opaque |
| PBI-200 |
200 |
185.1 ± 2.0 |
74.9 ± 0.4 |
100 ± 2 |
4.9 ± 0.9 (top) |
Opaque |
| PBI-250 |
250 |
216.9 ± 1.4 |
76.1 ± 3.4 |
103 ± 3 |
3.2 ± 0.5 (top) |
Opaque |
| PBI-300 |
300 |
277.8 ± 3.4 |
77.6 ± 1.6 |
111 ± 6 |
2.3 ± 0.2 (top) |
Opaque with defects |
Fig. 1 shows the SEM images of the membrane cross-sections. At the same PBI concentration, the membrane morphology varies obviously with the porogen content: the membranes changing from dense to integrally skinned asymmetric morphologies are obtained. The asymmetric PBI membranes typically have a uniform sponge-like pore sublayer, where the pore size is enlarged by the porogen content and the pores changed from a relatively closed structure to an interconnected one with the porogen content. Simultaneously, the membranes vary from a sandwiched double-skinned morphology for PBI-100 to a single-skinned asymmetric structure for PBI-200, PBI-250 and PBI-300. It is clearly observed that the skin thicknesses decrease as the porogen contents increase from 200 to 300 wt% (Table 1). Furthermore, the overall thickness as well as porosity (Table 1) of the membrane increase evidently with the increase in porogen content.
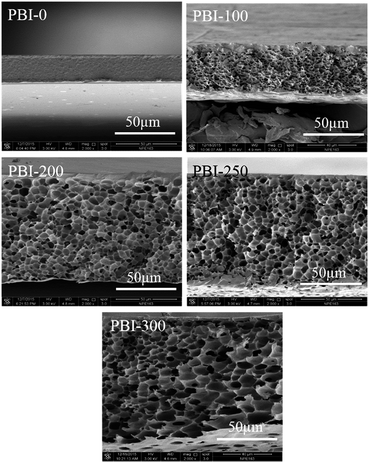 |
| | Fig. 1 SEM images of the cross-sections of the dense and the asymmetric PBI membranes. | |
SEM images of the top and the bottom surfaces of the asymmetric PBI membranes are displayed in Fig. 2. From the SEM images, apparently, the bottom surfaces have numerous pores for all the membrane samples. In addition, the pores are enlarged and intensified by the porogen content. Even some interconnections between the pores on the bottom surface and the inner pores can be identified for PBI-250 and PBI-300 (Fig. 1). In contrast, dense morphology is observed on the top surface for all the asymmetric PBI membranes. A defect-free skin layer is formed on the top of the porous sublayer for PBI-100, PBI-200 and PBI-250, which is further verified by low permeance of N2 (0.0038 GPU, 1 GPU = 10−6 cm3 (STP) cm−2 s−1 cmHg−1) and high CO2/N2 separation factor of 31.8 for PBI-250. The defect-free skin layer plays an important role in ion selectivity in VFB applications.
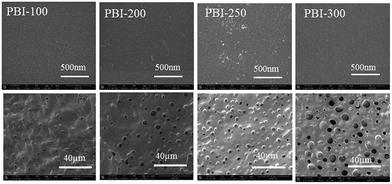 |
| | Fig. 2 SEM images of the top and the bottom surfaces of the asymmetric PBI membranes (top row: the top surfaces; bottom row: the bottom surfaces). | |
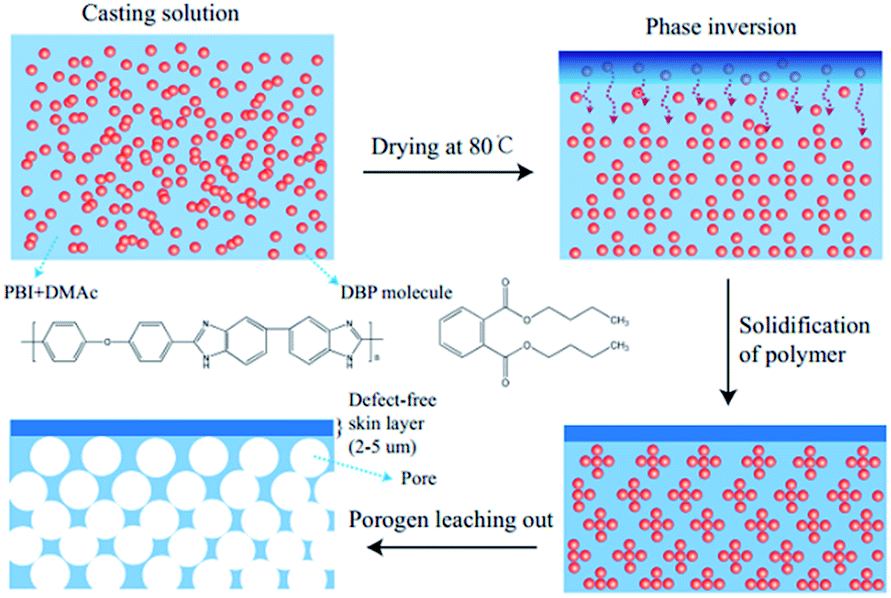
The formation of the asymmetric architecture by this porogen-leaching-out method is reasonable and understandable. The boiling point of the DBP (340 °C) is far higher than that of DMAc (166 °C). As a result, when the solvent evaporates from the casting solution at 80 °C, the porogen remains in the solution and its concentration increases, thus inducing phase inversion of the polymer solution into a polymer-rich (porogen-poor) and a porogen-rich (polymer-poor) phase. Further evaporation of the solvent will lead to solidification of the polymer membranes.61 After extracting DBP with methanol, pores are left in the membrane matrix. When the weight ratio of DBP to PBI increases, the pores formed can be more and larger, thus increasing the porosity of the resulting membranes. What's more, the density of DBP (1.05 g cm−3) is similar to that of the PBI (1.25 g cm−3) studied in this work. That could be the reason why the distribution of the pores is relatively uniform throughout the membrane thickness. The different structures between the top and the bottom surfaces might be explained by the changes in polymer concentration during the membrane formation (Scheme 1). The concentration of PBI at the top surface increases quickly upon drying, meanwhile DBP in the casting solution tends to diffuse downward because of its high affinity with DMAc, thus when the solvent on the top side evaporates completely, dense surface comes into being. However, the polymer concentration of the bottom surface increases tardily, which contributes to the phase separation and the formation of pores. The membrane formation mechanism and the membrane structure in this work are distinctly different from the work by Jheng et al.,57 where the density of the ion liquid porogen is much higher than that of the polymer, so the pores formed toward the bottom side of the membrane due to gravity, leading to a double-layer membrane structure comprising a thick dense layer and a porous layer. The observations in this work also demonstrate that it is possible to form an asymmetric PBI membrane with a dense skin layer even though the density of porogen is lower than that of the polymer.
 |
| | Scheme 1 Proposed membrane formation mechanism. | |
3.2 Sulfuric acid doping level and mechanical properties
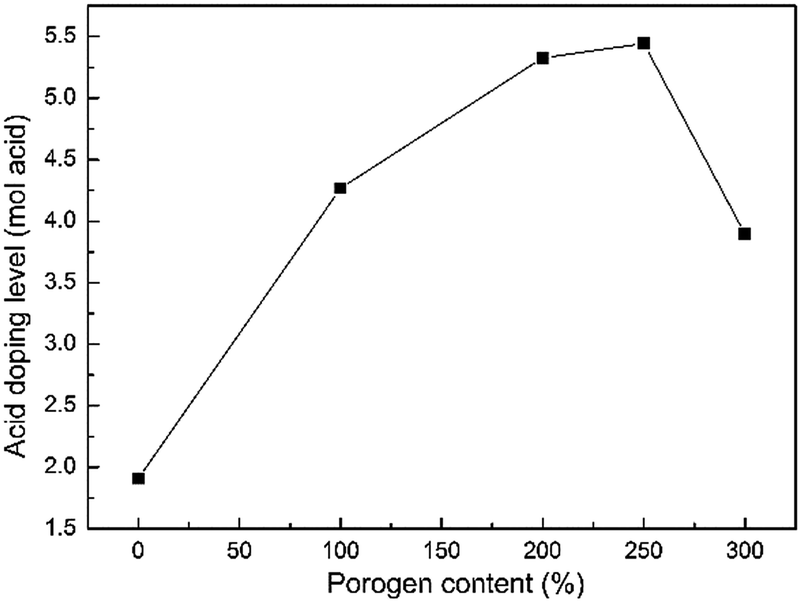
A pristine PBI membrane is an ionic non-conductor. However, it has the ability of doping acids due to strong protonation of nitrogen in the PBI ring, therefore it could be used as a proton-conducting membrane. In the present work, the prepared PBI membranes were doped with sulfuric acid by immersion in 3.0 M H2SO4 solution at 30 °C for 24 h. Fig. 3 presents the acid doping levels of PBI membranes fabricated from casting solutions with various porogen contents. It is obvious that the doping level increases dramatically with porogen content due to the increase in porosity. The highest doping level is 5.4 mol of H2SO4 per PBI repeat unit (i.e., ADL = 5.4 mol per PRU) achieved by PBI-250, which is much higher than that of the dense PBI membrane (around 1.9 mol per PRU). That's because the porous structure provides additional space to absorb more acid, which is of great significance for reducing AR of PBI membrane. However, the doping level drops to 3.9 mol per PRU when the porogen content is up to 300 wt%. It could be ascribed to the defects on the surface of PBI-300, where the pores are too large to trap the acid in the membrane.
 |
| | Fig. 3 Acid doping level of the prepared PBI membranes with porogen content. | |
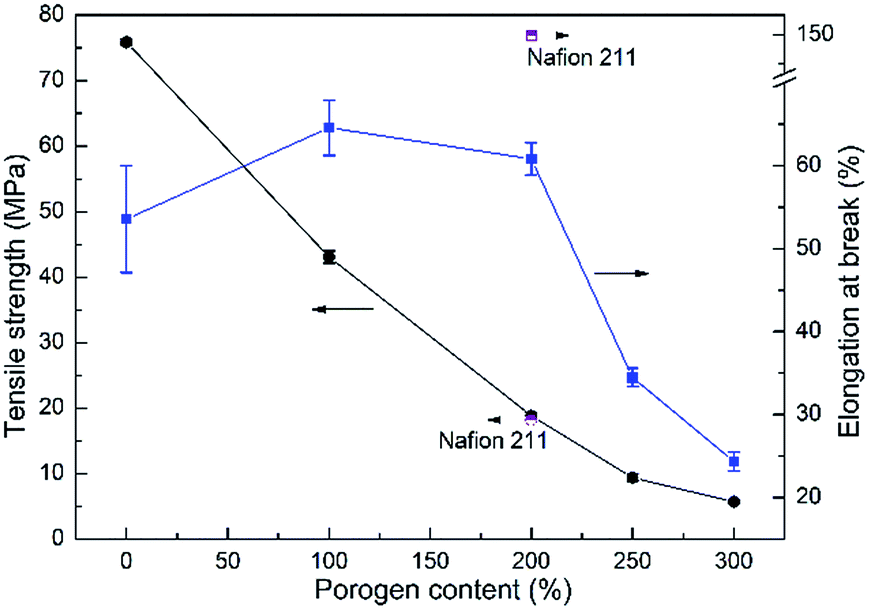
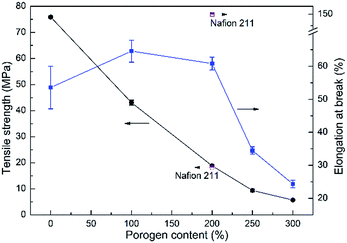
The mechanical properties of the fully hydrated acid-doped PBI membranes were evaluated by tensile testing and the results are displayed in Fig. 4. For the asymmetric PBI membranes, the tensile stress decreases with porogen content attributed to the increasing porosity of the membranes. Elongation at break follows an ascending trend initially, because of the plasticizing effect of doped acid and water, and a descending trend afterwards with the porosity. It implies that the introduction of porous structure into PBI membranes would deteriorate not only the tensile strength but also the elongation ratio when the level of porosity is too high. Nevertheless, the developed PBI membranes generally possess suitable tensile strength, which are close to the value of Nafion 211, for VFB applications, with the exception of PBI-300 which is excluded in the following study.
 |
| | Fig. 4 Mechanical properties of the prepared PBI membranes with porogen content. | |
3.3 Area resistance and vanadium permeability
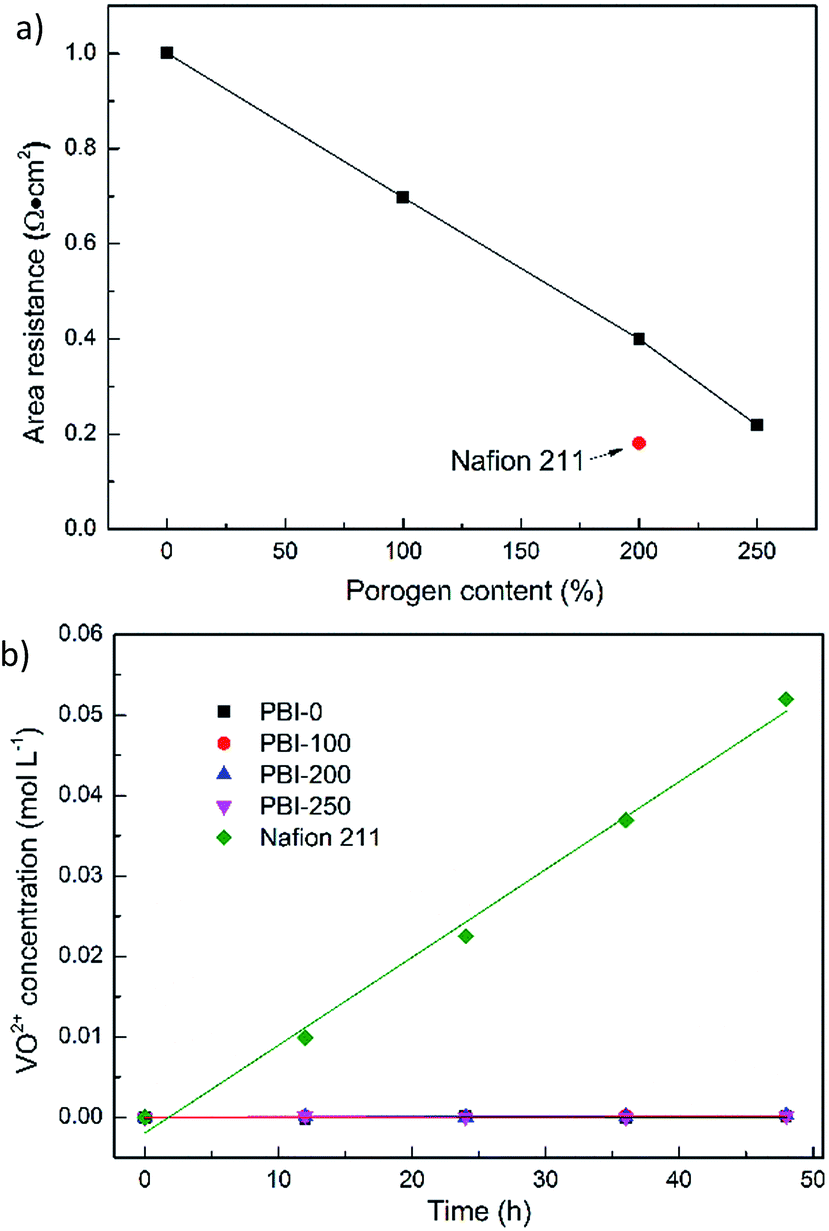
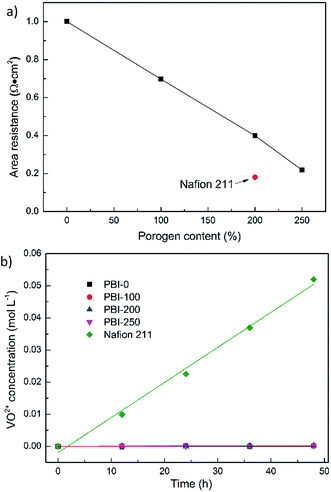
Fig. 5a illustrates the AR of various membranes in 3.0 M H2SO4 solutions at room temperature. As expected, the introduction of porous structure into PBI membranes dramatically reduces the AR. For example, the AR of the dense PBI membrane is 1.00 Ω cm2 while that of PBI-250 decreases to 0.22 Ω cm2. To elucidate the observations, three main factors would be considered. The first is the enhanced absorption of sulfuric acid with the porosity, which is crucial to improving proton conductivity of acid-doped PBI membranes. The second is the decreased skin thickness of the PBI membranes with the porogen content. The last is the more interconnected pore structure with the increase in porosity.
 |
| | Fig. 5 (a) AR and (b) vanadium diffusion of the prepared PBI membranes and Nafion 211. | |
The vanadium permeability was also measured for the developed PBI membranes and Nafion 211. The VO2+ concentration varying with time is given in Fig. 5b. Apparently, Nafion 211 suffers the most serious VO2+ diffusion originating from large and interconnected ionic channels (diameters of around 4–5 nm) forming in the membrane.62,63 Its permeability, as calculated by eqn (4), is 2.58 × 10⁻⁷ cm2 min−1. The vanadium permeability of PBI-0 is 8.12 × 10⁻¹⁰ cm2 min−1 and those of the asymmetric PBI membranes are over the range of 1.61–3.58 × 10⁻⁹ cm2 min−1. Although the VO2+ diffusion rates of the asymmetric PBI membranes are slightly higher than that of PBI-0, the impact is limited and the corresponding permeabilities are still two orders of magnitude lower than that of Nafion 211. This could be ascribed to the fairly dense microstructure of PBI skin layer stemming from the structural rigidity of PBI molecular and strong hydrogen bond among PBI molecules,64,65 which lead to narrow and tortuous ion transport channels in 3.0 M H2SO4 thus suppressing the pass of vanadium ions. The observations above further validate the formation of the defect-free skin layer, which is responsible for preventing vanadium cross contamination. It is similar to a dense skin layer of a composite membrane for VFB, which was first described by M. Skyllas-Kazacos et al.66–69
3.4 Single cell performance
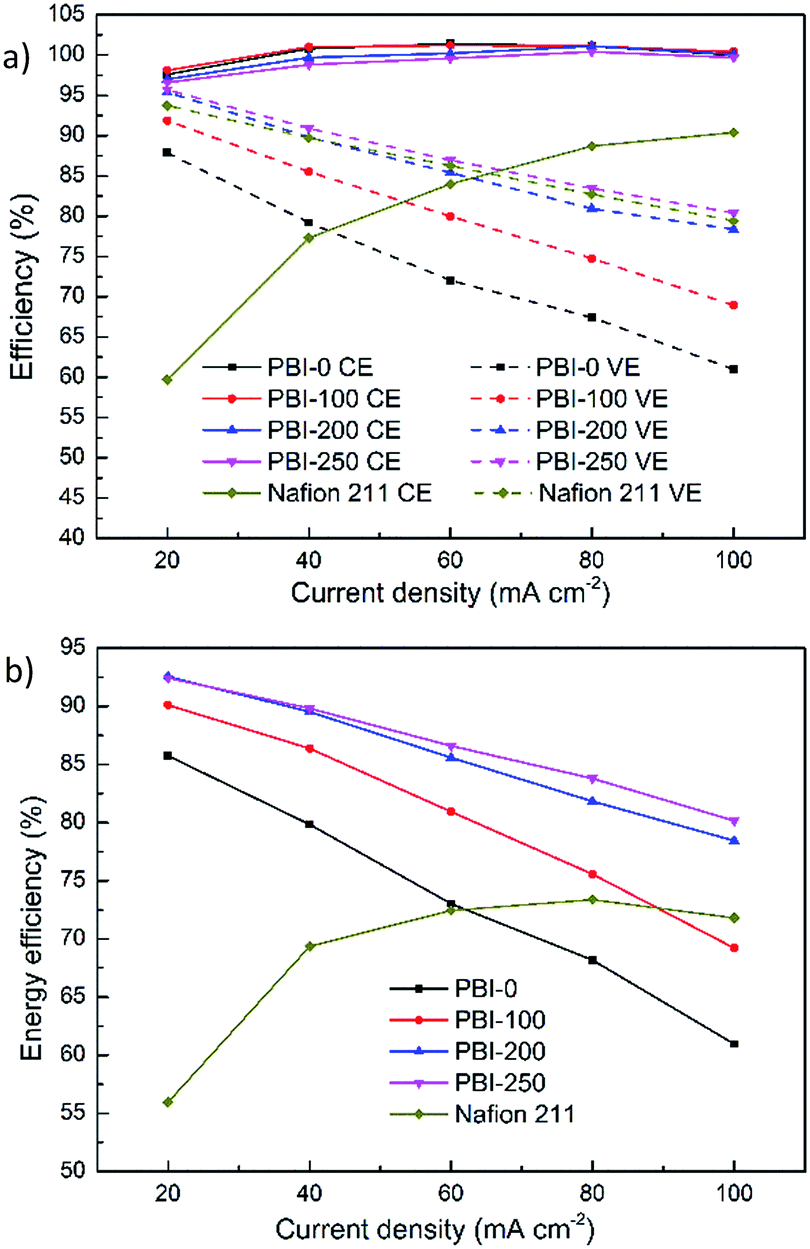
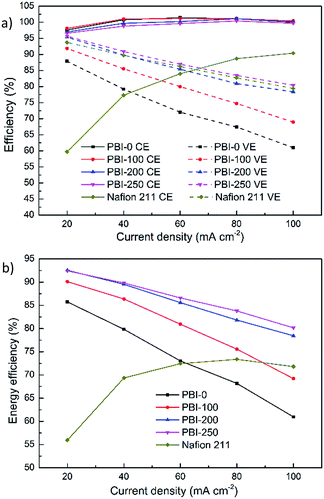
Single cell tests were conducted to explore performances of flow cells assembled with the thin skinned asymmetric PBI membranes. For all the tests, the defect-free skin layer of the asymmetric PBI membrane faced positive compartment to reduce the exposure of the membrane to oxidative VO2+ electrolyte solution. Fig. 6 exhibits efficiencies of VFBs assembled with the dense and the asymmetric PBI membranes under different current densities. Nafion 211 membrane having similar thickness with PBI-0 is chosen as the benchmark. As shown in Fig. 6a, the flow cell with Nafion 211 possesses the lowest CE under the entire tested current densities due to its poor ion selectivity. The CEs of flow cells with PBI membranes have no obvious change with increasing porosity due to their extremely low vanadium permeabilities thanks to the presence of the defect-free skin layer. The CEs obtained for all the PBI-based VFBs are higher than 96% under the entire tested current densities, and even close to 100% at high current densities, much higher than those of Nafion 211 membrane.
 |
| | Fig. 6 Efficiencies of the VFBs assembled with the prepared PBI membranes and Nafion 211 under different current densities. | |
A significant improvement in VE is observed for the asymmetric PBI membranes compared to the dense one. For example, the VE of the cell with PBI-0 is merely 61.4% at 100 mA cm−2 while that of PBI-250 reaches 80.2% at the same operating condition, because the porous structure has contributed to higher ionic conductivity through the membrane, leading to the reduction of overpotential compared to the dense PBI membrane. Furthermore, the VEs of the VFBs based on the asymmetric PBI membranes increase with the porosity at every current density, well consistent with the trend in AR (Fig. 5a). It is worth noting that although the AR of Nafion 211 is the lowest among the tested membranes (Fig. 5a), the corresponding VE is somewhat lower than that of PBI-250. That's because the VE loss is related to not only the overpotential but also the electrolyte crossover, which counteracts the positive effect of low resistance of Nafion 211.
EE is regarded as the most important factor since it indicates the energy utilization ratio during the charge–discharge process. In parallel to the increase in VE, EEs of the flow battery assembled with the PBI membrane increase monotonously with the membrane porosity. Since CEs of the PBI-based flow cells are extremely high and close to 100%, VEs become decisive for EEs. When the porogen content is up to 200 wt% and 250 wt%, the EEs reach 78.4–92.6% and 80.2–92.4%, respectively, over a current density range of 20–100 mA cm−2. The results are much superior to that of PBI-0 (EE: 61.0–85.7%) and Nafion 211 (EE: 56.0–73.4%), attributed to the controllable and beneficial membrane structure.
3.5 Charge/discharge cycling test
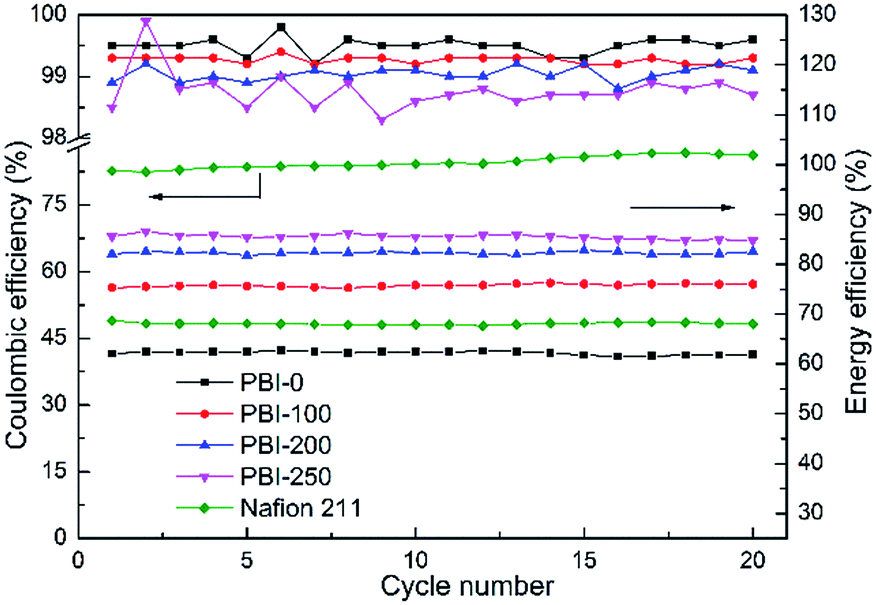
The charging/discharging cycling test was operated at a constant current density of 80 mA cm−2. The temperature was controlled at around 25 °C and the voltage cutoff window was set from 0.8 to 1.65 V. From the cycling data in Fig. 7, it can be seen that the VFBs assembled with various membranes show stable performances during the test. The CEs of the PBI membranes remain above 98%, demonstrating a super ion selectivity of the membranes. Moreover, the reduction of the AR promotes a significant enhancement in VE. Therefore the EEs of the VFBs with PBI-200 and PBI-250 keep at around 82.3% and 85.5%, respectively, which are much higher than those of PBI-0, PBI-100 and Nafion 211.
 |
| | Fig. 7 Efficiencies of VFBs with the prepared PBI membranes and Nafion 211 at constant current density of 80 mA cm−2. | |
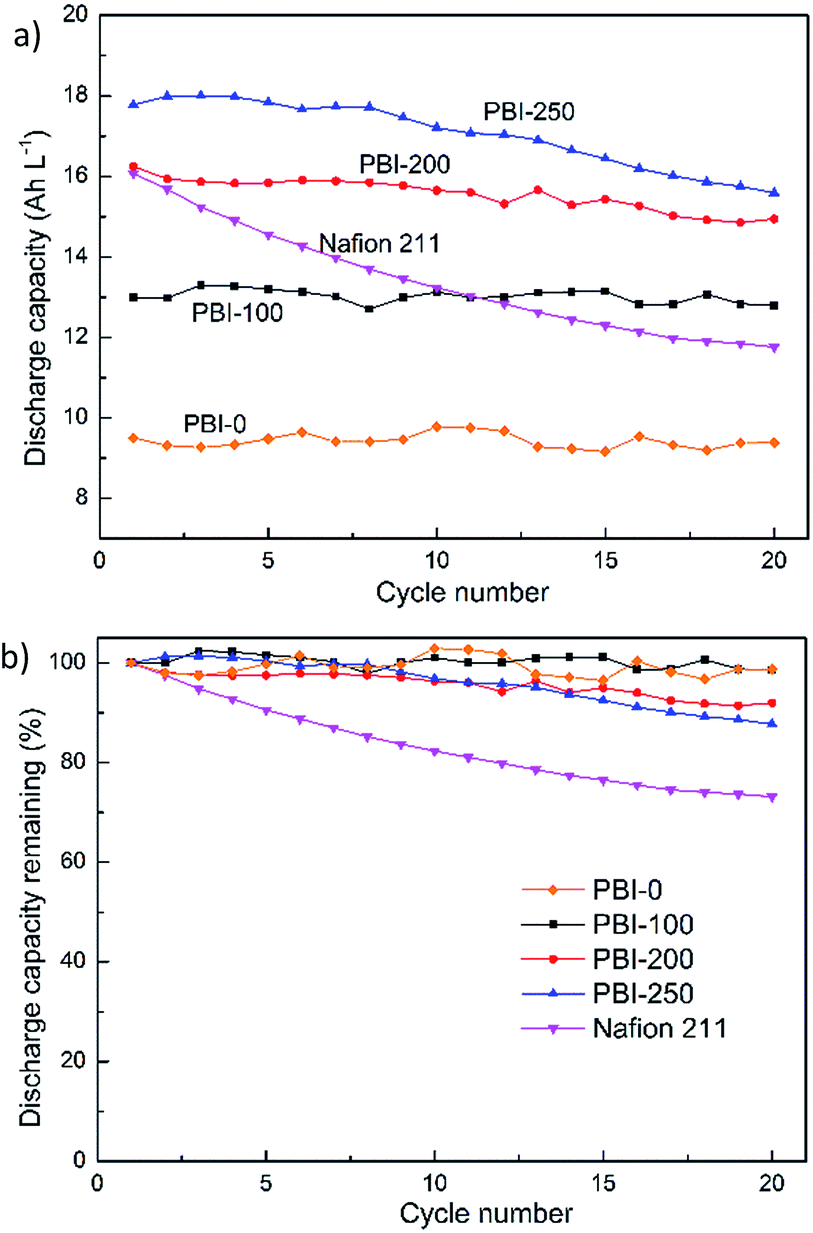
The discharge capacity decay of various membranes over cycles is shown in Fig. 8a. The initial discharge capacities of the PBI-based VFBs vary due to the different ARs, which induce different ohmic polarization at the same current density. It also reflects different utilizations of the active species. In parallel to the increase in AR, the initial discharge capacities decrease in the order of PBI-250 > PBI-200 > PBI-100 > PBI-0. The value of Nafion 211 does not follow the rule and turns out to be lower than that of PBI-250, which is ascribed to the severe vanadium crossover of Nafion 211. The normalized discharge capacity retention versus cycle number is displayed in Fig. 8b. After 20 cycles, the discharge capacity retentions of the VFBs with PBI-0, PBI-100, PBI-200 and PBI-250 are 98.7%, 98.5%, 92.0% and 87.7%, respectively. All the values are much higher than that of the Nafion-based VFB (73.2%). The total vanadium ion concentrations of original electrolytes and the electrolytes after 20 cycles of Nafion-based cell and PBI-250-based cell are listed in Table 2. It is clear that the total vanadium ion concentrations of the positive and negative compartments vary significantly for VFB assembled with Nafion 211 while those for VFB with PBI-250 vary slightly. Combining the observation that water transfer from negative to positive is severe for Nafion 211 whereas that for PBI-250 is slight, it can be inferred that the lower capacity decay rate of the asymmetric PBI membranes is owing to the lower vanadium ion cross contamination because of the presence of the defect-free skin layer.
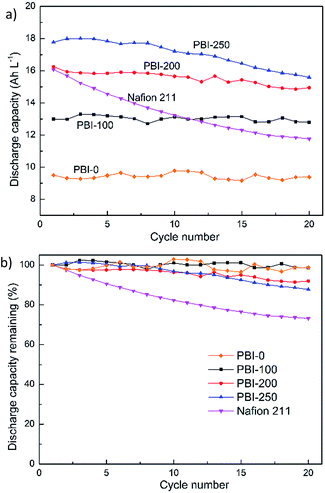 |
| | Fig. 8 (a) Discharge capacity and (b) discharge capacity retention of VFBs with the prepared PBI membranes and Nafion 211 at constant current density of 80 mA cm−2. | |
Table 2 Total vanadium ion concentrations of original electrolytes and the electrolytes after 20 cycles
| Sample |
Original |
PBI-250 |
Nafion 211 |
| Positive/mol L−1 |
1.57 |
1.56 |
1.64 |
| Negative/mol L−1 |
1.56 |
1.52 |
1.36 |
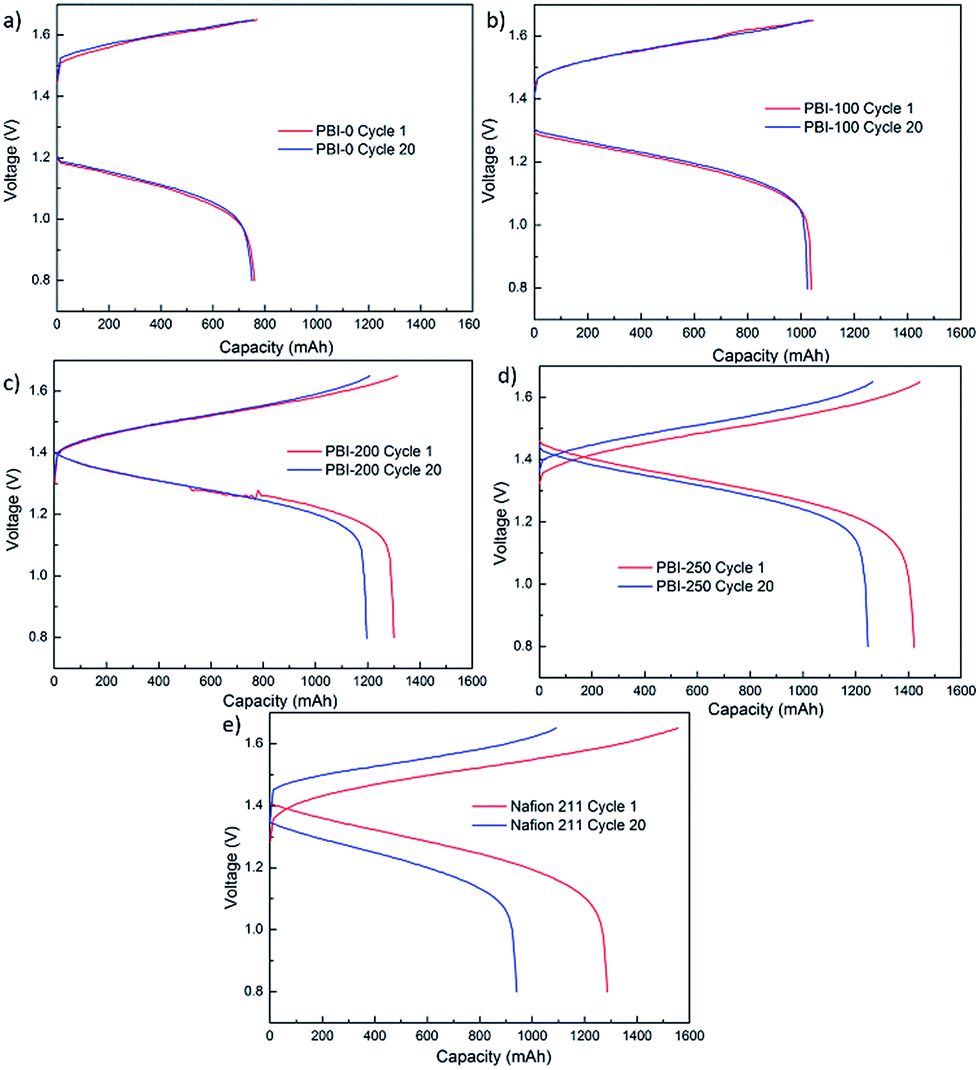
Among the PBI-based VFBs, although the flow cell assembled with PBI-250 possesses the highest discharge initial capacity, the capacity decay rate is the fastest which could be owing to the highest porosity and the thinnest skin layer weakening its capability of preventing vanadium crossover. The VFB assembled with PBI-0 exhibits the slowest decay rate in discharge capacity. However, the capacity it delivers is the lowest, which is around 9.4 A h L−1 with a theoretical capacity of 20 A h L−1. A significant improvement in discharge capacity is observed for PBI-100, but the efficiencies of the corresponding flow cell are unsatisfactory. Taking into consideration both efficiency and capacity retention, PBI-200 turns out to be optimal, which combines a high battery performance (CE: 99.0%, EE: 82.3%) with a moderate capacity decay rate (0.4% per cycle) during cycling test. The stable cycling performance of the PBI-200-based VFB over 50 cycles is provided in Fig. 9 further demonstrating the stability of PBI-200 in the operating VFB. The charge–discharge curves of different membranes at the 1st and the 20th cycles in the cycling test are illustrated in Fig. 10 to give further information to understand the cell performance.
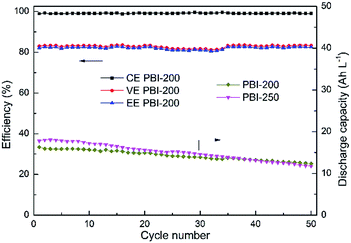 |
| | Fig. 9 Cycling performance over 50 cycles of VFBs with the prepared PBI membranes at constant current density of 80 mA cm−2. | |
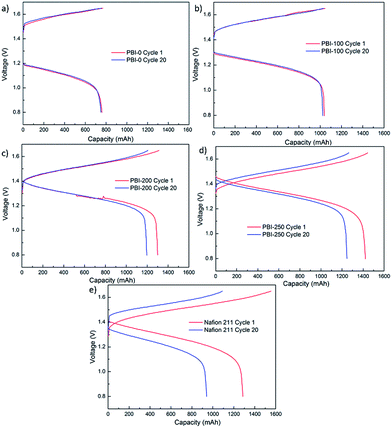 |
| | Fig. 10 Charge–discharge curves of Nafion 211 and PBI membranes at 1st and 20th cycles in the cycling test. | |
3.6 Chemical stability test
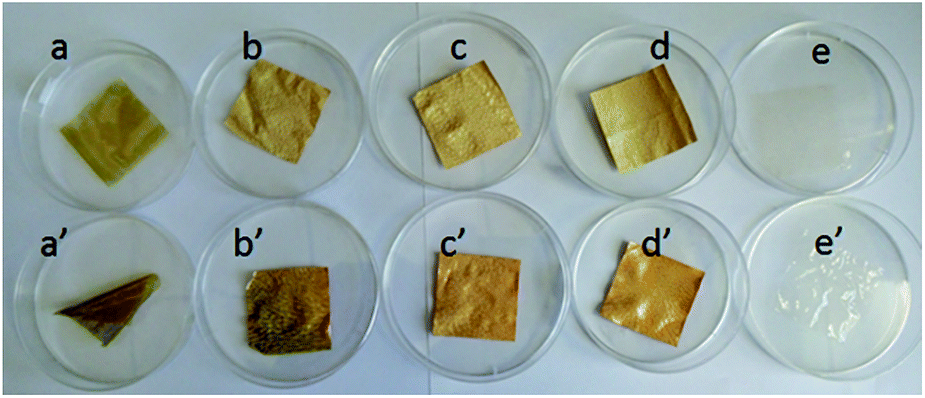
Membrane stability is another vital concern for VFBs. Different membranes were immersed in 1.5 M VO2+ + 3.0 M H2SO4 electrolyte solutions at ambient temperature for 40 days in the chemical stability test. All the membranes remain flexible and intact after the long-term test. The color of PBI-200, PBI-250 and Nafion 211 remain unchanged as shown in Fig. 11. Nonetheless, the color of PBI-0 and PBI-100 becomes slightly deepened, which could be ascribed to the absorption of VO2+ ions by the membranes. The structure of PBI-0 is dense and that of PBI-100 is relatively closed, therefore VO2+ ions would be easier to be trapped in these membranes. The similar conclusion could be drawn from the membrane weight variations (Table 3) after the test. The weights of PBI-0 and PBI-100 somewhat increase due to the VO2+ ions absorption while those of PBI-200, PBI-250 and Nafion 211 decrease slightly. The weight variations of PBI-200 and PBI-250 are similar to that of Nafion 211, demonstrating their decent chemical stability in VFB applications, which could derive from the intrinsically excellent chemical stability of PBI materials.
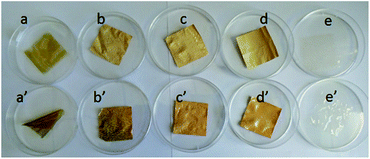 |
| | Fig. 11 Accelerated chemical stability tests: (a) (a′) PBI-0; (b) (b′) PBI-100; (c) (c′) PBI-200; (d) (d′) PBI-250; (e) (e′) Nafion 211 (top row: before test; bottom row: after test). | |
Table 3 Weight variations after chemical stability test
| Membrane |
PBI-0 |
PBI-100 |
PBI-200 |
PBI-250 |
Nafion 211 |
| Weight variation/% |
+10.6 |
+9.4 |
−2.9 |
−3.7 |
−3.2 |
4. Conclusions
In conclusion, a series of thin skinned asymmetric PBI membranes with tunable morphologies are fabricated and applied in VFB applications. The membranes are successfully fabricated by leaching out the porogen DBP, after solution-casting the mixture of PBI and DBP, and the possible membrane formation mechanism is also proposed. In this beneficial membrane structure, high ion selectively is fully guaranteed by the defect-free property of the skin layer. The permeabilities of the asymmetric PBI membranes are over the range of 1.61–3.58 × 10⁻⁹ cm2 min−1, two orders of magnitude lower than that of the Nafion membrane. Meanwhile, the AR of the asymmetric PBI membrane is dramatically reduced compared to that of the dense one because of ultrathin skin layer and interconnected macro-pores in the sublayer. The membrane morphologies and properties are readily adjusted by varying the porogen content (0–300 wt%). Increased porogen content reduces the skin thickness and improves the porosity as well as the connectivity among pores, thus reducing the AR from 1.00 Ω cm2 for the dense PBI membrane to 0.22 Ω cm2 for PBI-250. Therefore, the trade-off between ionic conductivity and selectivity is well managed, leading to excellent cell performances. In the cases of PBI-200 and PBI-250, EEs of 78.4–92.6% and 80.2–92.4% are achieved, respectively, under the current density of 20–100 mA cm−2, which are much superior to those of PBI-0 (61.0–85.7%), PBI-100 (69.2–90.1%) and Nafion 211 (56.0–73.4%) at the same operating conditions. PBI-200 achieves the best balance between AR and ion selectivity, assembled with which the flow battery yields excellent cell performances (CE: 99.0%; EE: 82.3%) and demonstrates a moderate capacity decay rate (0.4% per cycle) at 80 mA cm−2 during cycling. The developed PBI membranes exhibit decent stability in the chemical stability test, which could stem from the intrinsically excellent chemical stability of the PBI materials. This work demonstrates an effective way to fabricate high-performance asymmetric PBI membranes with readily tunable morphologies and properties for VFB applications.
Acknowledgements
The authors thank the support of Major National Scientific Instrument Development Project (Grant no. 21527812), National Natural Science Foundation of China (Grant no. 21406031 and 21476044), the Program for Liaoning Excellent Talents in University (LR2014003), the State Key Laboratory of Fine Chemicals (KF1507), and State Key Laboratory of fine chemicals (Panjin) project (Grant No. JH2014009). We grateful thank the financial support from Program for Changjiang Scholars.
References
- T. Janoschka, N. Martin, U. Martin, C. Friebe, S. Morgenstern, H. Hiller, M. D. Hager and U. S. Schubert, Nature, 2015, 527, 78–81 CrossRef CAS PubMed.
- H. Chen, T. N. Cong, W. Yang, C. Tan, Y. Li and Y. Ding, Prog. Nat. Sci., 2009, 19, 291–312 CrossRef CAS.
- S. Chu and A. Majumdar, Nature, 2012, 488, 294–303 CrossRef CAS PubMed.
- K. Gong, Q. R. Fang, S. Gu, S. F. Y. Li and Y. S. Yan, Energy Environ. Sci., 2015, 8, 3515–3530 Search PubMed.
- M. Skyllas-Kazacos, M. H. Chakrabarti, S. A. Hajimolana, F. S. Mjalli and M. Saleem, J. Electrochem. Soc., 2011, 158, R55 CrossRef CAS.
- W. Wang, Q. Luo, B. Li, X. Wei, L. Li and Z. Yang, Adv. Funct. Mater., 2013, 23, 970–986 CrossRef CAS.
- X. Li, H. Zhang, Z. Mai, H. Zhang and I. Vankelecom, Energy Environ. Sci., 2011, 4, 1147 CAS.
- L. Joerissen, J. Garche, C. Fabjan and G. Tomazic, J. Power Sources, 2004, 127, 98–104 CrossRef CAS.
- C. Ponce de León, A. Frías-Ferrer, J. González-García, D. A. Szánto and F. C. Walsh, J. Power Sources, 2006, 160, 716–732 CrossRef.
- M. Skyllas-Kazacos and F. Grossmith, J. Electrochem. Soc., 1987, 134, 2950 CrossRef CAS.
- M. Skyllas-Kazacos, M. Rychcik, R. G. Robins and A. F. Fane, J. Electrochem. Soc., 1986, 133, 1057 CrossRef CAS.
- Á. Cunha, J. Martins, N. Rodrigues and F. P. Brito, Int. J. Energy Res., 2015, 39, 889–918 CrossRef.
- T. N. L. Doan, T. K. A. Hoang and P. Chen, RSC Adv., 2015, 5, 72805–72815 RSC.
- A. Parasuraman, T. M. Lim, C. Menictas and M. Skyllas-Kazacos, Electrochim. Acta, 2013, 101, 27–40 CrossRef CAS.
- M. Ulaganathan, V. Aravindan, Q. Yan, S. Madhavi, M. Skyllas-Kazacos and T. M. Lim, Adv. Mater. Interfaces, 2016, 3, 1500309 CrossRef.
- Q. Zheng, X. Li, Y. Cheng, G. Ning, F. Xing and H. Zhang, Appl. Energy, 2014, 132, 254–266 CrossRef CAS.
- S. Gu, B. Xu and Y. Yan, Annu. Rev. Chem. Biomol. Eng., 2014, 5, 429–454 CrossRef CAS PubMed.
- B. Schwenzer, J. Zhang, S. Kim, L. Li, J. Liu and Z. Yang, ChemSusChem, 2011, 4, 1388–1406 CrossRef CAS PubMed.
- K. A. Mauritz and R. B. Moore, Chem. Rev., 2004, 104, 4535–4585 CrossRef CAS PubMed.
- L. Yu, F. Lin, L. Xu and J. Xi, RSC Adv., 2016, 6, 3756–3763 RSC.
- D. Chen, M. A. Hickner, E. Agar and E. C. Kumbur, ACS Appl. Mater. Interfaces, 2013, 5, 7559–7566 CAS.
- Z. Li, W. Dai, L. Yu, L. Liu, J. Xi, X. Qiu and L. Chen, ACS Appl.
Mater. Interfaces, 2014, 6, 18885–18893 CAS.
- M.-S. J. Jung, J. Parrondo, C. G. Arges and V. Ramani, J. Mater. Chem. A, 2013, 1, 10458 CAS.
- S. Yun, J. Parrondo and V. Ramani, J. Mater. Chem. A, 2014, 2, 6605 CAS.
- J. Xi, W. Dai and L. Yu, RSC Adv., 2015, 5, 33400–33406 RSC.
- C. Fujimoto, S. Kim, R. Stains, X. Wei, L. Li and Z. G. Yang, Electrochem. Commun., 2012, 20, 48–51 CrossRef CAS.
- S. Kim, T. B. Tighe, B. Schwenzer, J. Yan, J. Zhang, J. Liu, Z. Yang and M. A. Hickner, J. Appl. Electrochem., 2011, 41, 1201–1213 CrossRef CAS.
- D. Chen and M. A. Hickner, Phys. Chem. Chem. Phys., 2013, 15, 11299–11305 RSC.
- Z. Yuan, X. Li, J. Hu, W. Xu, J. Cao and H. Zhang, Phys. Chem. Chem. Phys., 2014, 16, 19841–19847 RSC.
- D. S. Zhang, X. M. Yan, G. H. He, L. Zhang, X. H. Liu, F. X. Zhang, M. M. Hu, Y. Dai and S. S. Peng, J. Mater. Chem. A, 2015, 3, 16948–16952 CAS.
- H. Zhang, H. Zhang, X. Li, Z. Mai and J. Zhang, Energy Environ. Sci., 2011, 4, 1676 CAS.
- X. Xi, C. Ding, H. Zhang, X. Li, Y. Cheng and H. Zhang, J. Power Sources, 2015, 274, 1126–1134 CrossRef CAS.
- X. Wei, Z. Nie, Q. Luo, B. Li, V. Sprenkle and W. Wang, J. Electrochem. Soc., 2013, 160, A1215–A1218 CrossRef CAS.
- H. Zhang, H. Zhang, X. Li, Z. Mai and W. Wei, Energy Environ. Sci., 2012, 5, 6299–6303 CAS.
- H. Zhang, C. Ding, J. Cao, W. Xu, X. Li and H. Zhang, J. Mater. Chem. A, 2014, 2, 9524 CAS.
- Y. Li, H. Zhang, X. Li, H. Zhang and W. Wei, J. Power Sources, 2013, 233, 202–208 CrossRef CAS.
- D. Chen, D. Li and X. Li, RSC Adv., 2016, 6, 87104–87109 RSC.
- G. Oriji, Y. Katayama and T. Miura, J. Power Sources, 2005, 139, 321–324 CrossRef CAS.
- R. Yang, Z. Cao, S. Yang, I. Michos, Z. Xu and J. Dong, J. Membr. Sci., 2015, 484, 1–9 CrossRef CAS.
- Z. Yuan, X. Zhu, M. Li, W. Lu, X. Li and H. Zhang, Angew. Chem., Int. Ed., 2016, 55, 3058–3062 CrossRef CAS PubMed.
- X. Wei, Z. Nie, Q. Luo, B. Li, B. Chen, K. Simmons, V. Sprenkle and W. Wang, Adv. Energy Mater., 2013, 3, 1215–1220 CrossRef CAS.
- J. Cao, H. Zhang, W. Xu and X. Li, J. Power Sources, 2014, 249, 84–91 CrossRef CAS.
- X. L. Zhou, T. S. Zhao, L. An, L. Wei and C. Zhang, Electrochim. Acta, 2015, 153, 492–498 CrossRef CAS.
- T. Luo, O. David, Y. Gendel and M. Wessling, J. Power Sources, 2016, 312, 45–54 CrossRef CAS.
- S. Peng, X. Yan, D. Zhang, X. Wu, Y. Luo and G. He, RSC Adv., 2016, 6, 23479–23488 RSC.
- Z. Yuan, Y. Duan, H. Zhang, X. Li, H. Zhang and I. Vankelecom, Energy Environ. Sci., 2016, 9, 441–447 CAS.
- S. Maurya, S.-H. Shin, J.-Y. Lee, Y. Kim and S.-H. Moon, RSC Adv., 2016, 6, 5198–5204 RSC.
- J.-K. Jang, T.-H. Kim, S. J. Yoon, J. Y. Lee, J.-C. Lee and Y. T. Hong, J. Mater. Chem. A, 2016, 4, 14342–14355 CAS.
- Q. Li, J. O. Jensen, R. F. Savinell and N. J. Bjerrum, Prog. Polym. Sci., 2009, 34, 449–477 CrossRef CAS.
- B. C. Steele and A. Heinzel, Nature, 2001, 414, 345–352 CrossRef CAS PubMed.
- D. Mecerreyes, H. Grande, O. Miguel, E. Ochoteco, R. Marcilla and I. Cantero, Chem. Mater., 2004, 16, 604–607 CrossRef CAS.
- A. Eguizábal, J. Lemus, M. Urbiztondo, O. Garrido, J. Soler, J. A. Blazquez and M. P. Pina, J. Power Sources, 2011, 196, 8994–9007 CrossRef.
- C.-H. Shen, L.-C. Jheng, S. L.-C. Hsu and J. Tse-Wei Wang, J. Mater. Chem., 2011, 21, 15660 RSC.
- S. Wang, C. Zhao, W. Ma, G. Zhang, Z. Liu, J. Ni, M. Li, N. Zhang and H. Na, J. Membr. Sci., 2012, 411–412, 54–63 CrossRef CAS.
- H. Zarrin, G. Jiang, G. Y. Y. Lam, M. Fowler and Z. Chen, Int. J. Hydrogen Energy, 2014, 39, 18405–18415 CrossRef CAS.
- R. Verdejo, C. Saiz-Arroyo, J. Carretero-Gonzalez, F. Barroso-Bujans, M. A. Rodriguez-Perez and M. A. Lopez-Manchado, Eur. Polym. J., 2008, 44, 2790–2797 CrossRef CAS.
- L.-C. Jheng, S. L.-C. Hsu, T.-Y. Tsai and W. J.-Y. Chang, J. Mater. Chem. A, 2014, 2, 4225 CAS.
- J. C. Jansen, K. Friess and E. Drioli, J. Membr. Sci., 2011, 367, 141–151 CrossRef CAS.
- P. Llewellyn, F. Grossmith, A. Fane and M. Skyllas-Kazacos, J. Electrochem. Soc., 1987, 134, C458 CrossRef.
- S. Kim, J. Yan, B. Schwenzer, J. Zhang, L. Li, J. Liu, Z. Yang and M. A. Hickner, Electrochem. Commun., 2010, 12, 1650–1653 CrossRef CAS.
- J. Jansen, M. Macchione and E. Drioli, J. Membr. Sci., 2005, 255, 167–180 CrossRef CAS.
- W. Y. Hsu and T. D. Gierke, J. Membr. Sci., 1983, 13, 307–326 CrossRef CAS.
- Z. Mai, H. Zhang, X. Li, C. Bi and H. Dai, J. Power Sources, 2011, 196, 482–487 CrossRef CAS.
- M. Sadeghi, M. A. Semsarzadeh and H. Moadel, J. Membr. Sci., 2009, 331, 21–30 CrossRef CAS.
- S. C. Kumbharkar and K. Li, J. Membr. Sci., 2012, 415–416, 793–800 CrossRef CAS.
- S. C. Chieng, M. Kazacos and M. Skyllas-Kazacos, J. Power Sources, 1992, 39, 11–19 CrossRef CAS.
- S. C. Chieng, M. Kazacos and M. Skyllas-Kazacos, J. Membr. Sci., 1992, 75, 81–91 CrossRef CAS.
- T. Mohammadi and M. Skyllas-Kazacos, J. Membr. Sci., 1995, 98, 77–87 CrossRef CAS.
- T. Mohammadi and M. Skyllas-Kazacos, J. Membr. Sci., 1995, 107, 35–45 CrossRef CAS.
|
| This journal is © The Royal Society of Chemistry 2017 |
Click here to see how this site uses Cookies. View our privacy policy here. 
 Open Access Article
 This Open Access Article is licensed under a