DOI:
10.1039/C6RA25639B
(Paper)
RSC Adv., 2017,
7, 1847-1851
Electrochemical detection of serotonin based on a poly(bromocresol green) film and Fe3O4 nanoparticles in a chitosan matrix†
Received
21st October 2016
, Accepted 29th November 2016
First published on 12th January 2017
Abstract
A composite film containing poly(bromocresol green), magnetic nanoparticles and multiwalled carbon nanotubes was fabricated for the sensitive determination of serotonin. The poly(bromocresol green) was prepared by electropolymerization on a glassy carbon electrode surface, then the multiwalled carbon nanotubes and magnetic nanoparticles in a chitosan matrix were dropped onto the surface of the poly(bromocresol green) film. The modified electrode displayed an enhanced differential pulse voltammetric response to serotonin in the presence of dopamine. Its peak current (at an oxidation voltage of 0.36 V vs. Ag/AgCl) increased linearly in the serotonin concentration range 0.5–100 μM with a detection limit of 80 nM (at an S/N of 3). The sensor was highly sensitive and stable. It was applied to the direct determination of serotonin spiked into human serum samples. These results show that the nanocomposite films are good modifying materials for use in the fabrication of electrochemical sensors.
1. Introduction
Thin films of conducting polymers have attracted much attention as electrode materials. Conjugated polymers can be used in thin film transistors and biosensors1–3 as a result of their electronic and electrochemical properties. Conducting polymers can enhance the electrochemical signals produced by the redox reactions of target compounds. Bromocresol green (BCG) has been used as an electrode material in electrochemical sensors;4,5 its high-electron-density hydroxyl groups and good conductivity give poly(BCG) films a negative charge and they exhibit electrocatalytic activity towards many substances. Iron oxide (Fe3O4) forms magnetic nanoparticles (NPs), which have excellent chemical stability, good biocompatibility and a high electron efficiency6 and have therefore been widely applied in electrochemistry.7–10 Multiwalled carbon nanotubes (MWCNTs) have a porous nanostructure and have a high electrical conductivity, large surface area and good chemical stability.11,12 When used as modifying materials in electrochemical devices, they can promote electron transfer reactions.13,14 Chitosan (CS) has a good permeability, good adhesion and excellent film-forming abilities. These make CS a good matrix for immobilizing molecules.15–18
Serotonin (5-hydroxytryptamine; 5-HT) is an important neurotransmitter and plays a variety of parts in many basic biological processes, including sensory perception and behavior.19,20 This has encouraged researchers to look for faster and more sensitive methods to determine 5-HT, including detection using various modified electrodes.21–27 Sensitivity is a key factor in the detection of serotonin. We describe here nanocomposites films based on magnetic Fe3O4 NPs, MWCNTs and poly(BCG), which have been used to study the electrochemical behaviour of 5-HT. Fe3O4 and MWCNTs are ideal modifying materials due to their high conductivity and good absorbability. The poly(BCG) film modified electrode had a large surface area and good conductivity, which led to conjugation between the target analytes and the electrode interface. We describe the preparation and application of the serotonin sensor. The Fe3O4–MWCNT–poly(BCG) composite films exhibited strong electrocatalytic ability and enhanced the sensitivity towards 5-HT. Compared with a bare glassy carbon electrode (GCE), the peak currents of 5-HT increased significantly at the electrode coated with a Fe3O4–MWCNT–poly(BCG) film. The oxidation peak of 5-HT was not affected by high concentrations of dopamine. 5-HT was detected by the poly(BCG) and nanoparticle films using an electrochemical method. The modified electrode had obvious advantages, such as a wide linear concentration range, low detection limit, good selectivity and reproducibility. The nanocomposite films are thus good materials for the fabrication of electrochemical sensors.
2. Experimental
2.1. Reagents and apparatus
CS, BCG and 5-HT were obtained from Sigma. Dopamine (DA), ascorbic acid (AA), uric acid (UA), adrenaline (AD), tryptophan (Trp), L-cysteine (L-Cys) and glucose (GLU) were obtained from Alfa Aesar. The MWCNTs were obtained from Nanjing XFNANO Materials Tech. Sulfuric acid, nitric acid, acetic acid, sodium phosphate dibasic and sodium phosphate monobasic were obtained from Sichuan Xilong Chemical. All reagents were of analytical-reagent grade. All solutions used were made with ultrapure water. Phosphate buffers with different pH values were prepared using 0.1 M NaH2PO4 and 0.1 M Na2HPO4. The serum samples were obtained from the hospital of Chongqing Three Gorges University.
A CHI 660D electrochemical workstation (Shanghai CHI Instruments) was used to collect the electrochemical data. The three-electrode system consisted of a modified working electrode, a platinum electrode as the counter electrode and an Ag/AgCl reference electrode. UV absorption spectra were measured on a Cary-300 spectrophotometer (Varian). An EL20K pH meter (Mettler) was used to measure the pH. The morphologies and microstructures of the samples were characterized by an S-4800 scanning electron microscope and H-7500 transmission electron microscope (Hitachi).
2.2. Preparation of poly(BCG)/GCE
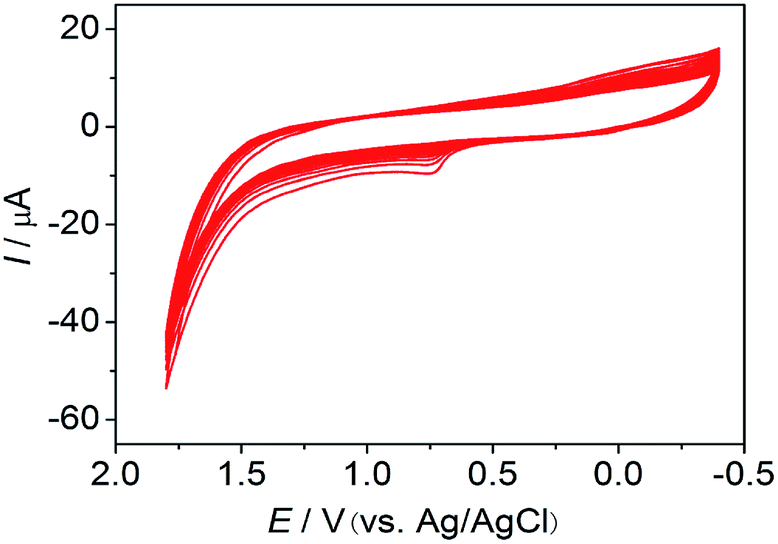
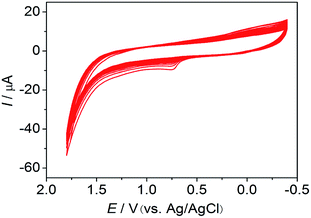
The GCE was polished successively with 0.3 and 0.05 μm alumina powders, rinsing thoroughly with ultrapure water between each polishing step. The electrode was washed in 1![[thin space (1/6-em)]](https://www.rsc.org/images/entities/char_2009.gif) :1 nitric acid, then ultrasonicated in ultrapure water before drying in high-purity nitrogen. The GCE was placed in a beaker containing pH 7.4 phosphate buffer and 0.5 mM BCG solution and was cyclically swept for 25 cycles between −0.4 and 1.8 V vs. Ag/AgCl at 100 mV s−1 to form the poly(BCG)/GCE (Fig. S1 and S2, ESI†). The anodic peak currents increased with the number of scan cycles, indicating the deposition of BCG on the surface of the GCE by electropolymerization (Fig. 1). The impurities on the electrode surface were removed by ultrapure water. The poly(BCG)/GCE was then stored at room temperature.
:1 nitric acid, then ultrasonicated in ultrapure water before drying in high-purity nitrogen. The GCE was placed in a beaker containing pH 7.4 phosphate buffer and 0.5 mM BCG solution and was cyclically swept for 25 cycles between −0.4 and 1.8 V vs. Ag/AgCl at 100 mV s−1 to form the poly(BCG)/GCE (Fig. S1 and S2, ESI†). The anodic peak currents increased with the number of scan cycles, indicating the deposition of BCG on the surface of the GCE by electropolymerization (Fig. 1). The impurities on the electrode surface were removed by ultrapure water. The poly(BCG)/GCE was then stored at room temperature.
 |
| | Fig. 1 Repeated cyclic voltammograms in phosphate buffer (pH 7.4) and 5 × 10⁻⁴ M BCG. Scan rate: 100 mV s−1; no. of sweep circles, 25. | |
2.3. Preparation of GCE with composite Fe3O4–MWCNTs–poly(BCG)
The MWCNTs were sonicated with a strong oxidizing agent consisting of a mixture of concentrated sulfuric and nitric acids (3:1 v/v) for 10 h and then washed with ultrapure water, filtered and centrifuged. A 1.0 mg mass of MWCNTs and 1.0 mL of 0.5 wt% CS were ultrasonicated to obtain a suspension. Magnetic Fe3O4 NPs were prepared by Batalha's method.28 Fe3O4 (1.0 mg) was dispersed in the suspension to obtain an Fe3O4–MWCNT solution. The modified electrode was prepared by dropping 5.0 μL of the modified solution onto the surface of the poly(BCG)/GCE. The modified solution was then dried at room temperature.
3. Results and discussion
3.1. Characterization of Fe3O4–MWCNT composite films
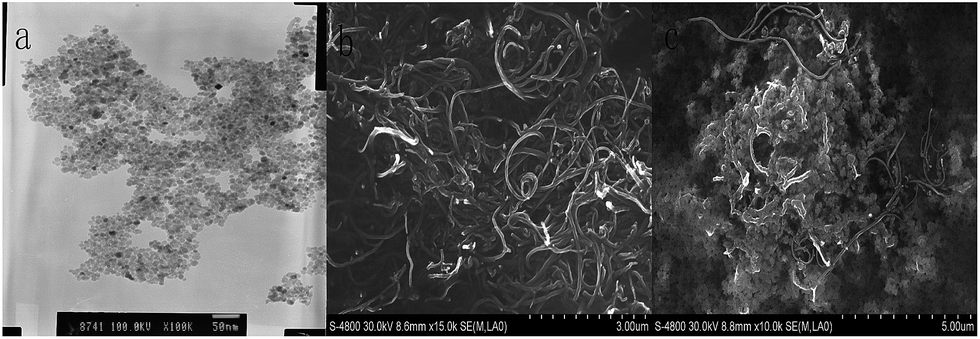
The TEM image of the Fe3O4 NPs in Fig. 2a shows that the Fe3O4 NPs were rounded NPs with a uniform distribution. The SEM images of the MWCNTs and the Fe3O4–MWCNT nanocomposite film are shown in Fig. 2b and c. It can be clearly seen that the Fe3O4 NPs were attached to the MWCNTs. These spherical particles were confirmed to be agglomerations of Fe3O4 NPs.
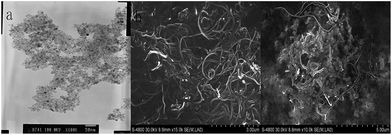 |
| | Fig. 2 (a) TEM image of Fe3O4 NPs and SEM images of (b) MWCNTs and (c) Fe3O4–MWCNTs. | |
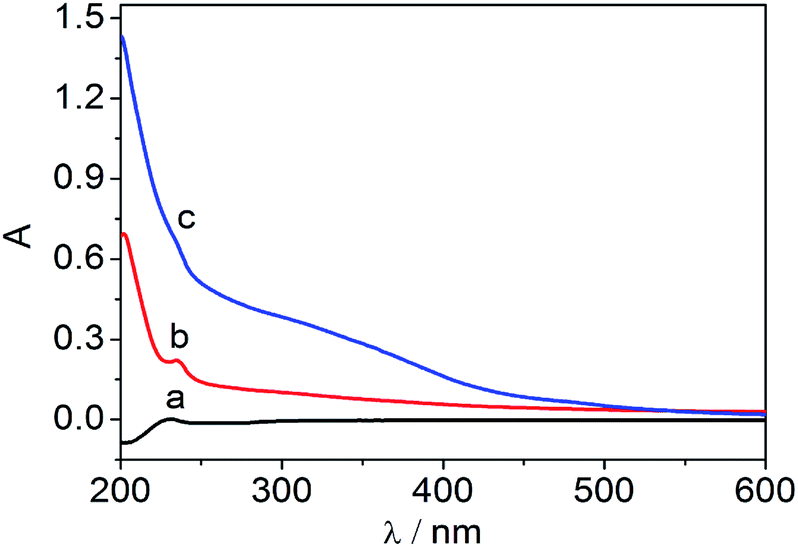
To further investigate the Fe3O4–MWCNT solution, the modified solution was characterized by its UV absorption spectrum. The UV absorption spectra of different samples in phosphate buffer are shown in Fig. 3. An obvious absorption peak appeared at about 220 nm, originating from the structure of the MWCNTs.29 The absorption peak of the Fe3O4–MWCNTs was influenced by the absorption of the Fe3O4 NPs, which showed a red shift relative to the pristine MWCNTs. Therefore the Fe3O4 NPs were attached to the MWCNTs.
 |
| | Fig. 3 UV-vis absorption spectra of (a) MWCNTs, (b) Fe3O4–MWCNTs and (c) Fe3O4 in 0.1 M phosphate buffer (pH 7.0). | |
3.2. Electrochemical behaviour of 5-HT at the Fe3O4–MWCNT–poly(BCG) films
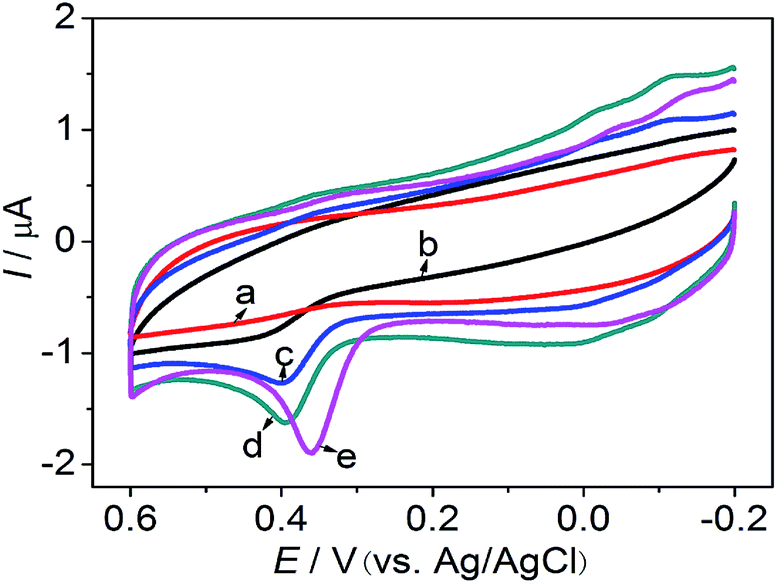
Fig. 4 shows the cyclic voltammograms of different modified electrodes in pH 7.0 phosphate buffer and 2.0 × 10⁻⁵ M 5-HT solution. No peak was observed at the bare GCE, (curve a), but an oxidation peak was observed for the poly(BCG)/GCE (curve b). The oxidation peak potentials occurred at 0.400 V vs. Ag/AgCl. An oxidation peak was also observed for the MWCNT–poly(BCG)/GCE (curve c) and Fe3O4–MWCNT/GCE (curve d). Under identical conditions, when the bare GCE was modified with the Fe3O4–MWCNT–poly(BCG) film, the oxidation peak observed at the Fe3O4–MWCNT–poly(BCG)/GCE (curve e) was much larger than for the other modified electrodes and the oxidation peak potential shifted to 0.360 V vs. Ag/AgCl. It was therefore concluded that the Fe3O4–MWCNT–poly(BCG) composite enhanced the electron transfer and peak currents of 5-HT. The sensitivity of 5-HT was improved by this electrocatalytic behaviour.
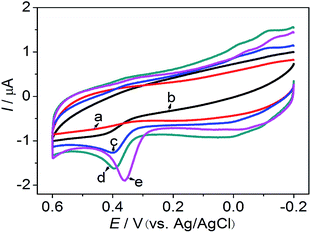 |
| | Fig. 4 Cyclic voltammograms obtained with (a) a bare GCE, (b) the poly(BCG)/GCE, (c) the MWCNT/GCE, (d) the Fe3O4–MWCNT/GCE and (e) the Fe3O4–MWCNT–poly(BCG)/GCE in 0.1 M phosphate buffer (pH 7.0) and 2.0 × 10⁻⁵ M 5-HT. | |
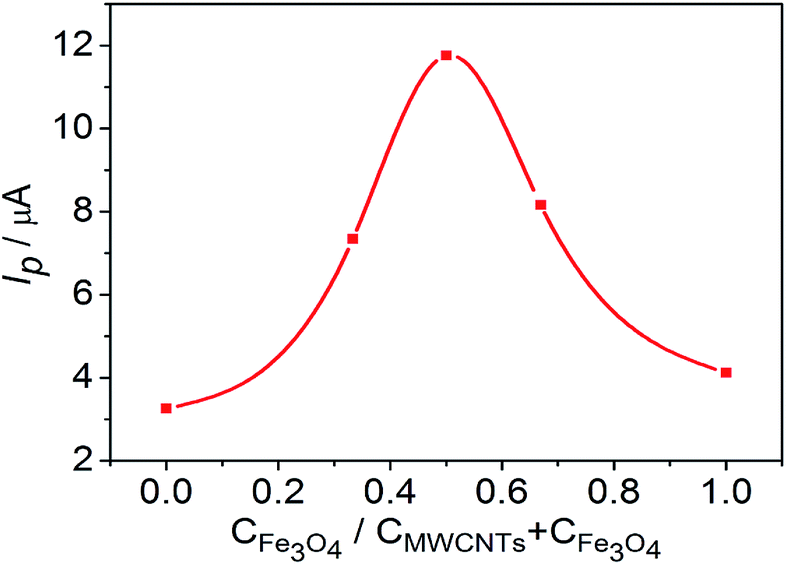
3.2.1. Optimum amounts of Fe3O4 and MWCNTs. The optimum amounts of Fe3O4 and MWCNTs were investigated. The total concentration of Fe3O4 and MWCNTs was fixed at 6.0 mg mL−1, but we changed the concentration of Fe3O4 from 0 to 6.0 mg mL−1.30 Fig. 5 shows that the peak currents gradually increased with an increase in the concentration of Fe3O4 from 0 to 3.0 mg mL−1. When the concentration of Fe3O4 reached 3.0 mg mL−1, the peak currents reached the highest value. However, the peak currents gradually decreased with an increase in the concentration of Fe3O4 from 3.0 to 6.0 mg mL−1. Therefore the optimum proportion of Fe3O4 to MWCNTs was 1:1.
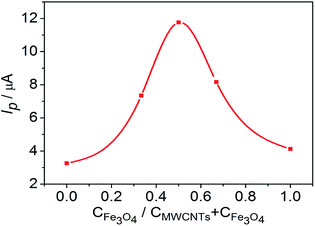 |
| | Fig. 5 Peak currents of different proportions of Fe3O4 and MWCNTs in 0.1 M phosphate buffer (pH 7.0) and 1.0 × 10⁻⁴ M 5-HT. | |
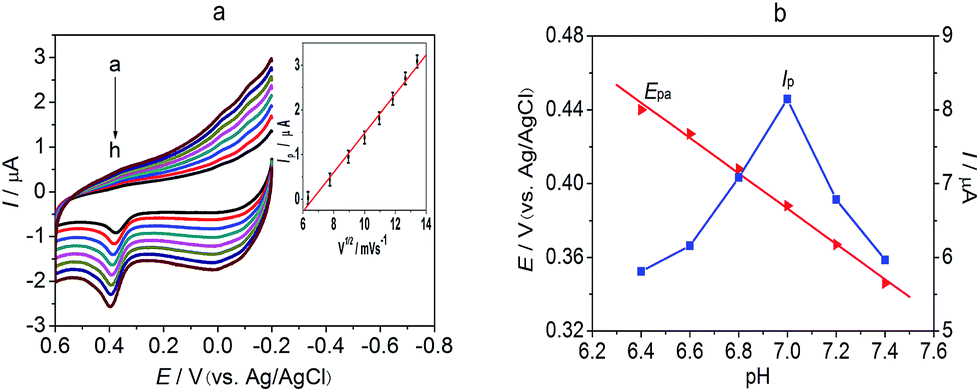
3.2.2. Effects of scan rate and solution pH. The scan rate influenced the electrode reaction of the peak potential (Epa) and the peak current (Ip) (Fig. 6a). In the range 40–180 mV s−1, Ip was linearly related to the square root of the scan rate. The linear regression equation was Ip (μA) = 0.081 + 0.699 V mV−1 s−1 (R2 = 0.997), meaning that the oxidation process was diffusion controlled. As the scan rate increased, Epa shifted to a more positive potential, indicating that the electron transfer process was quasi-reversible.31 When the pH of the phosphate buffer changed, the oxidation Epa and the Ip of 5-HT also changed. When the pH of the phosphate buffer was 7.0, the peak current of 5-HT reached a maximum value at the Fe3O4–MWCNT–poly(BCG)/GCE (Fig. 6b) and therefore pH 7.0 was selected as the optimum pH for the determination of 5-HT. By contrast, when the pH increased, the peak potential of 5-HT shifted to a negative potential and Epa was linear with pH. The linear regression equation was Epa (mV) = 654.4 − 38.3 pH (R2 = 0.990). The slope of −38.3 mV pH−1 indicates that only one proton was involved in the two-electron oxidation process.32
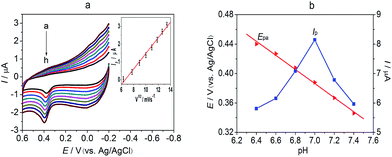 |
| | Fig. 6 (a) Cyclic voltammograms of the Fe3O4–MWCNT–poly(BCG)/GCE at different scan rates from 40 to 180 mV s−1. The inset shows the relationship between Ip and the square root of the scan rate. (b) Effect of pH on the peak current (Ip) and peak potential (Epa) at the Fe3O4–MWCNTs–poly(BCG)/GCE in phosphate buffer (pH 7.0) and 1.0 × 10⁻⁴ M 5-HT. | |
3.3. Electrochemical response of 5-HT in the presence of DA at the modified electrode
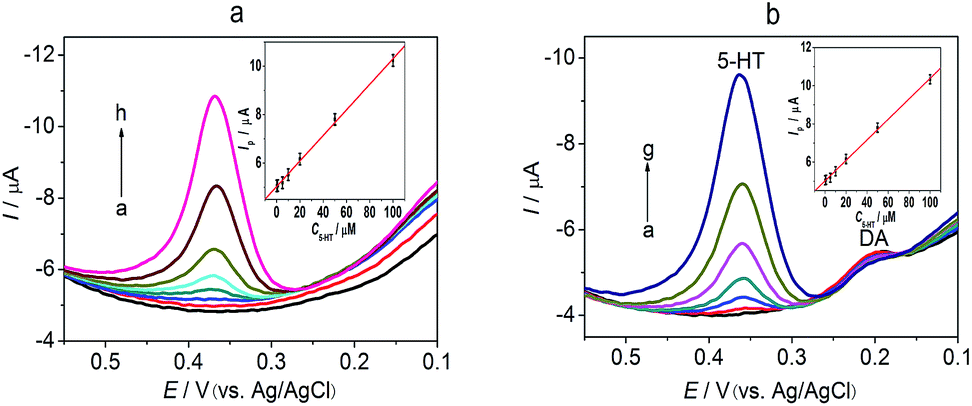
Differential pulse voltammetry (DPV) has a much better current sensitivity than cyclic voltammetry, so it was used to determine the concentration of 5-HT in the presence of DA at the Fe3O4–MWCNT–poly(BCG)/GCE and to estimate the limit of detection. The anodic peak currents were linearly related to the 5-HT concentration in the range 0.2–100 μM (Fig. 7a). The linear regression equation was: Ip (μA) = 0.3088 + 0.5279C (M) (R2 = 0.998) and the detection limit was 60 nM (S/N = 3). The oxidation peak current was linearly related to the concentration of 5-HT in the range 0.5–100 μM in the presence of 10 μM DA (Fig. 7b). The regression equation was Ip (μA) = 0.3183 + 0.5309C (μM) (R2 = 0.996) and the detection limit was 80 nM (S/N = 3). The measured parameters of this electrode are compared with other previously reported modified electrodes in Table 1. Compared with these other modified electrodes, the Fe3O4–MWCNT–poly(BCG)/GCE had a low detection limit.
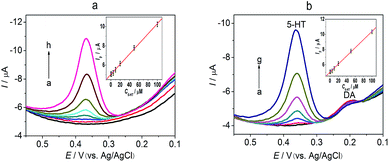 |
| | Fig. 7 (a) DPV for 5-HT at the Fe3O4–MWCNT–poly(BCG)/GCE in phosphate buffer (pH 7.0). 5-HT concentrations (from a to h): 0, 0.2, 0.5, 1, 5, 10, 50 and 100 μM. (b) DPV of 5-HT at the Fe3O4–MWCNTs–poly(BCG)/GCE in phosphate buffer (pH 7.0) and 1.0 × 10⁻⁵ M DA. 5-HT concentration (from a to g): 0, 0.5, 1, 5, 10, 50 and 100 μM. The inset shows the relationship between Ip and different concentrations of 5-HT. | |
Table 1 Performance of previously reported modified electrodes in the detection of 5-HTa
| Modified electrode |
Linear region (μM) |
Detection limit (μM) |
Ref. |
| Ru: rutin; WGE: paraffin-impregnated graphite electrode; 5-HTP: 5-hydroxytryptophan; GCE: glassy carbon electrode; ACh: acetylcholine; CNT: carbon nanotube; IL: ionic liquids; PM: polymelamine; PG: pyrolytic graphite. |
| Ru/WGE |
0.3–9.0 |
0.1 |
23 |
| 5-HTP/GCE |
5.0–35.0 |
1.7 |
25 |
| ACh/GCE |
1.0–30.0 |
0.5 |
33 |
| Carbon fibre electrode |
2.5–10.0 |
1.0 |
34 |
| CNT-IL/GCE |
5.0–900.0 |
2.0 |
35 |
| PM-PG/GCE |
1.0–100.0 |
0.49 |
36 |
| Fe3O4–MWCNT–poly(BCG)/GCE |
0.5–100.0 |
0.08 |
This work |
3.4. Interference studies
To explore the selectivity of the Fe3O4–MWCNT–poly(BCG)/GCE, four small biological molecules (AA, UA, DA and 5-HT) were detected simultaneously. Four oxidation peaks were separated. Interference from AA coexisting in 5-HT at the Fe3O4–MWCNT–poly(BCG)/GCE was analysed by DPV with the concentration of AA increasing from 0 to 4.0 × 10⁻³ M in solution. The results showed that a 400-fold excess AA did not obviously influence the detection of 5-HT (Fig. S3, ESI†). The same experiments were carried out in the presence of DA, UA, AD, Trp, L-Cys and GLU. We found that 20-fold DA, 10-fold UA, 15-fold AD, 200-fold Trp, 150-fold L-Cys and 150-fold GLU did not obviously interfere in the detection of 5-HT. To test the repeatability of the Fe3O4–MWCNT–poly(BCG)/GCE, the electrode was stored in a refrigerator at 4 °C after the first measurement. Compared with the initial response, the current response was reduced by about 3.7% 3 days later, by 7.5% 7 days later and by 16.4% after 15 days. Therefore this sensor displays high selectivity and good stability in the detection of 5-HT.
3.5. Determination of 5-HT in human blood serum
The Fe3O4–MWCNT–poly(BCG)/GCE was applied to the detection of 5-HT in human blood samples. Serum samples was analysed under the optimum conditions, but 5-HT was not detected. Therefore different concentrations of 5-HT standards were added to the sample matrix to carry out the recovery test. The experimental results are shown in Table 2. The results show that the Fe3O4–MWCNT–poly(BCG)/GCE could detect 5-HT in serum samples.
Table 2 Recovery for the determination of 5-HT in serum samples
| Sample |
Original (μM) |
Added (μM) |
Founda (μM) |
Recovery (%) |
| Mean of three determinations. Not detected. |
| 1 |
NDb |
2.00 |
1.89 |
94.50 |
| 2 |
NDb |
3.00 |
2.79 |
93.00 |
| 3 |
NDb |
4.00 |
3.75 |
93.75 |
4. Conclusions
A serotonin sensor was fabricated using a Fe3O4–MWCNT–poly(BCG) nanocomposite film. It was shown that the Fe3O4–MWCNT–poly(BCG) nanocomposite film had a strong electrocatalytic effect in the oxidation of 5-HT and enhanced electron transfer between the target analytes and the electrode interface. The MWCNTs provided many active sites and enhanced the sensitivity of the sensor. Compared with previously reported methods, the serotonin sensor exhibited high sensitivity, good selectivity and a low detection limit. The sensor was successfully applied to the determination of 5-HT in blood serum samples.
Acknowledgements
The authors give heartfelt gratitude for the financial support of this study by the Scientific and Technological Research Program of Chongqing Municipal Education Commission (No. KJ1501026), the research program of Wanzhou District Science Commission (No. 201503051) and the Key Laboratory of Water Environment Evolution and Pollution Control in the Three Gorges Reservoir fund project (No. WEPKL2016LL-01; WEPKL2016LL-06).
References
- S. Gunes, H. Neugebauer and N. S. Sariciftci, Chem. Rev., 2007, 107, 1324 CrossRef PubMed.
- D. T. McQuade, A. E. Pullen and T. M. Swager, Chem. Rev., 2000, 100, 2537 CrossRef CAS PubMed.
- G. Inzelt, M. Pineri, J. W. Schultze and M. A. Vorotyntsev, Electrochim. Acta, 2000, 45, 2403 CrossRef CAS.
- X. Q. Ouyang, L. Q. Luo, Y. P. Ding, B. D. Liu, D. Xu and A. Q. Huang, J. Electroanal. Chem., 2015, 748, 1 CrossRef CAS.
- J. Y. Hou and S. Y. Ai, Chem. Res. Chin. Univ., 2011, 27, 934 CAS.
- E. Katz and I. Willner, Angew. Chem., Int. Ed., 2005, 44, 4791 CrossRef CAS PubMed.
- S. Yu and G. M. Chow, J. Mater. Chem., 2004, 14, 2781 RSC.
- E. Katz and I. Willner, Chem. Commun., 2005, 4089 RSC.
- D. J. Kim, Y. K. Lyu, H. N. Choi, I. H. Min and W. Y. Lee, Chem. Commun., 2005, 2966 RSC.
- J. Q. Wan, W. Cai and J. T. Feng, J. Mater. Chem., 2007, 17, 1188 RSC.
- R. H. Baughman, A. A. Zakhidov and W. A. de Heer, Science, 2002, 297, 787 CrossRef CAS PubMed.
- Y. P. Sun, K. F. Fu, Y. Lin and W. J. Huang, Acc. Chem. Res., 2002, 35, 1096 CrossRef CAS PubMed.
- H. Boo, R. A. Jeong, S. Park and K. S. Kim, Anal. Chem., 2005, 78, 617 CrossRef PubMed.
- Y. J. Yin, Y. F. Lu, P. Wu and C. X. Cai, Sensors, 2005, 5, 220 CrossRef CAS.
- J. Cruz, M. Kawasaki and W. Gorski, Anal. Chem., 2000, 72, 680 CrossRef CAS PubMed.
- M. G. Zhang, A. Smith and W. Gorski, Anal. Chem., 2004, 76, 5045 CrossRef CAS PubMed.
- H. Zhang, M. Oh, C. Allen and E. Kumacheva, Biomacromolecules, 2004, 5, 2461 CrossRef CAS PubMed.
- C. Lau and M. J. Cooney, Langmuir, 2008, 24, 7004 CrossRef CAS PubMed.
- R. A. Glennon, J. Med. Chem., 2003, 46, 2795 CrossRef CAS PubMed.
- D. E. Nichols and C. D. Nichols, Chem. Rev., 2008, 108, 1614 CrossRef CAS PubMed.
- R. N. Goyal, M. Oyamab, V. K. Guptaa and S. P. Singha, Sens. Actuators, B, 2008, 134, 816 CrossRef CAS.
- K. B. Wu, J. J. Fei and S. H. Hu, Anal. Biochem., 2003, 318, 100 CrossRef CAS PubMed.
- G. P. Jin, Q. Z. Chen, Y. F. Ding and J. B. He, Electrochim. Acta, 2007, 52, 2535 CrossRef CAS.
- N. Yusoff, A. Pandikumar, R. Ramaraj, L. H. Ngee and N. M. Huang, Microchim. Acta, 2015, 182, 2091 CrossRef CAS.
- Y. X. Li, X. Huang, Y. Chen, L. Wang and X. Lin, Microchim. Acta, 2009, 164, 107 CrossRef CAS.
- A. Babaei and M. Babazadeh, Electroanalysis, 2011, 23, 1726 CrossRef CAS.
- A. Abbaspour and A. Noori, Biosens. Bioelectron., 2011, 26, 4674 CrossRef CAS PubMed.
- I. L. Batalhaa, A. Hussainaand and A. C. A. Roquea, J. Mol. Recognit., 2010, 23, 462 CrossRef PubMed.
- C. S. Chen, X. H. Chen, B. Yi and T. G. Liu, Acta Mater., 2006, 54, 5401 CrossRef CAS.
- J. Y. Qu, Y. Dong, Y. Wang and H. H. Xing, Sens. Biosensing Res., 2015, 3, 74 CrossRef.
- S. Ogawa, E. A. Decker and D. J. McClements, J. Agric. Food Chem., 2004, 11, 3595 CrossRef PubMed.
- X. H. Jiang and X. Q. Lin, Anal. Chim. Acta, 2005, 537, 145 CrossRef CAS.
- G. P. Jin, X. Q. Lin and J. M. Gong, J. Electroanal. Chem., 2004, 569, 135 CrossRef CAS.
- K. H. Parker and D. O'Hare, Anal. Chem., 2006, 78, 6990 CrossRef PubMed.
- M. M. Ardakani and A. Khoshroo, J. Electroanal. Chem., 2014, 717, 17 CrossRef.
- P. Gupta and R. N. Goyal, Talanta, 2014, 120, 17 CrossRef CAS PubMed.
Footnote |
| † Electronic supplementary information (ESI) available. See DOI: 10.1039/c6ra25639b |
|
| This journal is © The Royal Society of Chemistry 2017 |
Click here to see how this site uses Cookies. View our privacy policy here. 
 Open Access Article
 This Open Access Article is licensed under a