
The Castanea sativa bur as a new potential ingredient for nutraceutical and cosmetic outcomes: preliminary studies
Diana
Pinto
a,
Francisca
Rodrigues
 *a,
Nair
Braga
a,
Joana
Santos
a,
Filipa B.
Pimentel
a,
Ana
Palmeira-de-Oliveira
bc and
M. Beatriz P. P.
Oliveira
a
*a,
Nair
Braga
a,
Joana
Santos
a,
Filipa B.
Pimentel
a,
Ana
Palmeira-de-Oliveira
bc and
M. Beatriz P. P.
Oliveira
a
aLAQV/REQUIMTE, Department of Chemical Sciences, Faculty of Pharmacy, University of Porto, Rua de Jorge Viterbo Ferreira, 228, 4050-313 Porto, Portugal. E-mail: franciscapintolisboa@gmail.com; fsarmento@ff.up.pt; Fax: +351 226093390; Tel: +351 220428500
bCICS-UBI – Health Sciences Research Centre, University of Beira Interior, 6200-506 Covilhã, Portugal
cLabfit-HPRD: Health Products Research and Development Lda, 6200-506 Covilhã, Portugal
First published on 19th December 2016
Abstract
Chestnuts are a common food product in Mediterranean countries, being recognized also for their beneficial effects on human health. Nevertheless, during processing, these fruits generate a large amount of food by-products, such as shells and burs. In the present work, the macronutrient composition, vitamin E profile and amino acid content of the burs were determined in samples from three different Portuguese regions (Minho, Trás-os-Montes and Beira-Alta). The nutritional composition was similar for all samples, being characterised by a high moisture content and low fat amounts. All essential amino acids were present in considerable amounts. Concerning vitamin E, the predominant vitamer was α-tocopherol for the Minho and Beira-Alta samples. The total phenolic compounds were quantified, and the antioxidant activity evaluated in different extracts using two biochemical assays (DPPH˙ and FRAP). All bur extracts showed a high total phenolic content, the highest obtained being that for the Beira-Alta samples. The chestnut bur from Minho showed the highest antioxidant activity in both assays. This study aims to demonstrate the potential of the Castanea sativa bur as a cosmetic and nutraceutical ingredient.
1. Introduction
Sustainability is an important concept for the environmental and economic sectors that leads to an increasing search for the improvement of natural resource management. Sustainable production and consumption should comprise waste reduction (using renewable products) and energetic efficiency (taking into account effective costs for industries).1 The use of agro-industrial by-products embraces these two conditions and is considered a viable source of new natural products, reducing environmental costs and increasing company profits.2 Different agro-industrial wastes were studied as promising sources of new ingredients, with great potential for topical formulations, such as olive oil by-products, chestnut skin or even coffee silverskin.2–4Castanea sativa Mill. is a species of the Fagaceae family and its production is distributed over several Portuguese regions. According to the Food and Agriculture Organization (FAO), the world production of chestnuts is about 1.1 million tons.5 Europe accounts for 12% of the world production, with Italy and Portugal highlighted as representing of 4% and 3% of world production, respectively.5 The fruits (chestnut) are a highly appreciated seasonal nut (in autumn) in Mediterranean countries.6 During fruit processing a large amount of agro-industrial by-products are generated, such as shells or burs. The bur corresponds to about 20% of the total weight of the nut. According to Vázquez et al. this by-product usually remains in the woodland after the fruit harvesting and promotes the proliferation of certain insect larvae with the potential to damage crops.7 Indeed, valorization of these residues would improve the economic and environmental impact of the industrial process. Chestnut is being studied by different authors as an interesting ingredient for food supplements, cosmetics and pharmaceutical products.2,8,9 However, few studies report the particular composition of the bur. This by-product is presented as a source of fiber and polyphenols, with marked antioxidant properties, protecting against oxidative stress-mediated diseases such as cardiovascular and neurodegenerative diseases or photoaging.8,10 However, some research regarding bur composition is still lacking, concerning, for example, macronutrient composition, vitamin E and amino acid content, or even antimicrobial activity. The present study aims to gain more detailed knowledge about C. sativa bur composition from three different Portuguese regions, namely, Minho, Trás-os-Montes and Beira-Alta, in order to find ways to improve its economic value.
2. Materials and methods
2.1. Chemicals and reagents
For the macronutrient analysis all analytical grade reagents were purchased from Panreac (Barcelona, Spain) and Merck (Darmstadt, Germany). Tocopherols (α, β, γ and δ) and tocotrienols (α, β, γ and δ) were purchased from Calbiochem (La Jolla, California, USA) and tocol was obtained from Matreya Inc. (Pennsylvania, USA). Butylated hydroxytoluene (BHT) was from Sigma-Aldrich (Madrid, Spain). All isoflavones and amino acids, as well as the internal standard 2-methoxyflavone, were purchased from Sigma-Aldrich (St Louis, MO, USA).Ascorbic acid, 1,1-diphenyl-2-picrylhydrazyl (DPPH˙) free radical, catechin, Folin–Ciocalteu's reagent, gallic acid, iodine, 6-hydroxy-2,5,7,8-tetramethylchroman-2-carboxylic acid, glycerol, Trolox and butylated hydroxyanisole (BHA) were all purchased from Sigma-Aldrich (Steinheim, Germany). Ethanol reagent grade, sodium acetate, sodium carbonate decahydrate, sodium nitrite, aluminium chloride and sodium hydroxide were purchased from Merck (Darmstadt, Germany).
HPLC-grade acetonitrile and 1,4-dioxane were from Fluka (Madrid, Spain). HPLC grade n-hexane, methanol, and dimethyl sulfoxide (DMSO) were from Merck (Darmstad, Germany). Purified water was obtained from a Milli-Q water purification system (Millipore, Bedford, MA, USA).
Vitek-2 identification cards were from Biomerieux (Crappone, France). Brain heart infusion, nutrient agar, Sabouraud dextrose agar and Mueller Hinton broth were purchased from Difco Laboratories (USA). RPMI was from Biochrom (Berlin, Germany). The eluents were filtered through 0.45 μm filters (OlimPeak, Teknokroma, Barcelona, Spain) and degassed under reduced pressure.
Dulbecco's modified Eagle's medium (DMEM) with GlutaMAX™-I, fetal bovine serum (FBS), streptomycin, penicillin and amphotericin B were from Invitrogen (Carlsbad, CA, USA). (3-(4,5-Dimethylthiazol-2-yl)-2,5-diphenyltetrazolium bromide) (MTT) assay kit (CellTiter 96® Non-Radioactive Cell Proliferation Assay) was purchased from Promega (Madison, WI, USA).
2.2. Samples
C. sativa fruits were collected in September 2013 in three different regions of Portugal, namely, Minho, Trás-os-Montes and Beira-Alta. Five trees were selected in each orchard, and 50 fruits were collected manually from each tree, taking into account their state of ripeness. To confirm that fruits were ripe, homogenisation was carried out three days after harvest. The fruit was dried at room temperature for 4 weeks. The bur was then separated from the rest of the fruit and milled to a particle size of approximately 0.1 mm using an A11 basic analysis mill (IKA Wearke, Staufen, Germany) and stored in plastic tubes at 4 °C until the analysis.2.3. Macronutrient analysis
The moisture content was instrumentally determined using a moisture analyzer (SMO 01, Scaltec Instruments, Germany). The ash content was determined by incinerating the sample in a muffle furnace at 550 °C, according to the 923.03 method.11 The protein content (nitrogen conversion factor 6.25) was determined using the Kjeldahl procedure.12 Total fat was determined by Soxhlet extraction method,13 and the carbohydrate content by difference.14 All analyses were performed in triplicate and results are expressed as g per 100 g.2.4. Qualitative and quantitative vitamin E evaluation
The vitamin E profile was determined in the lipid fraction of the bur, obtained by Soxhlet extraction with petroleum ether (2.5 h). Briefly, 20 mg of bur oil were diluted in 1 mL of n-hexane with 20 μL of tocol (1 mg mL−1) (internal standard). The chromatographic analysis was carried out in an HPLC integrated system (Jasco, Tokyo, Japan) equipped with AS-2057 automated injector, a PU-2089 pump and a MD-2018 multi-wavelength diode array detector (DAD) coupled to a fluorescence detector FP-2020, programmed for excitation at 290 nm and emission at 330 nm. The chromatographic separation of the compounds was achieved on a normal phase Supelcosil™ LC-SI column (3 μm; 75 × 3.0 mm; Supelco, Bellefonte, PA, USA) according to Alves et al.15 The injection volume was 20 μL, eluted with 1.8% dioxane in n-hexane (v/v) at a flow rate of 0.8 mL min−1 at room temperature. Chromatographic data were analyzed using a JASCO-Chrom NAV Chromatography Software (Jasco, Tokyo Japan). Compounds were quantified based on the internal standard method, using the fluorescence signal response of each standard converted to concentration units through the calibration curves. These were obtained by preparing a standard stock solution containing individual compounds (α-, β-, γ- and δ-tocopherol and α-, β-, γ- and δ-tocotrienol) in n-hexane, subsequently diluted (25, 18.75, 12.5, 6.25, 2.5 and 1.25 μg mL−1) to obtain the calibration curves. Each solution contained 20 μL of tocol (internal standard, 1 mg mL−1). The compounds were identified based on their UV/VIS spectra and by the comparison of their retention time with those of the standards. Results were expressed as mg per 100 g of sample. Analyses were performed in triplicate.2.5. Amino acids quantification
The presence of the amino acids, arginine (Arg), serine (Ser), aspartic acid + glutamic acid (Asp + Glu), threonine (Thr), glycine (Gly), alanine (Ala), proline (Pro), valine + methionine (Val + Met), phenylalanine (Phe), isoleucine (Ile), leucine (Leu), ornithine (Orn), lysine (Lys) and tyrosine (Tyr) was analyzed by reversed-phase HPLC with fluorescence detection. Prior to the HPLC analysis the samples were subjected to acidic hydrolysis (HCl 6 mol L−1, 110 °C, 24 h)16,17 and derivatization with dansyl chloride.18,19The chromatographic analysis was carried out in an HPLC integrated system (Jasco, Tokyo Japan) equipped with an AS-950 automated injector, two PU-980 pumps, a CO-2060 Plus oven, and an FP-2020 fluorescence detector programmed for excitation at 335 nm and emission at 514 nm. The compound separation was achieved in a C18 RP Luna column (4.6 × 250 mm, 5 μm; Supelco Inc., Bellefonte, PA, USA) from Phenomenex (Torrance, CA, USA), according to Pimentel et al.19 The gradient eluent system consisted of: (A) K2HPO4 0.0185 mol L−1 with 4% DMF and 0.1% of triethylamine (final pH ≈ 2.5); (B) acetonitrile. The injection volume was 20 μL and the flow rate was 1.1 mL min−1, using the following gradient: 0′, 17% B; 26′, 50%; 28′, 50% B; 40′, 90% B. Chromatographic data were analyzed using JASCO-Chrom NAV Chromatography Software (Jasco, Japan). The amino acids were identified by comparison of retention time with authentic standards. Quantification was carried out on the basis of the internal standard method (norleucine, at a concentration of 0.39 mg mL−1). A standards stock solution of 500 μg mL−1 containing all the amino acids was prepared. Different dilutions were used for the calibration curves (1.0 μL mL−1–250 μg mL−1). Results are expressed in mg per 100 g of sample and the analyses were performed in triplicate.
2.6. Preparation of hydro-alcoholic extracts
Powdered samples (1 g) were subjected to solvent extraction by maceration with 20 mL of ethanol![[thin space (1/6-em)]](https://www.rsc.org/images/entities/char_2009.gif) :water (1:1) at 40 °C for 30 minutes (Mirac, Thermolyne, USA). Extracts were filtered through Whatman no. 1 filter paper, concentrated under vacuum at 37 °C until dry and kept under refrigeration (4 °C) prior to use. The extracts obtained were further characterized regarding their total phenolic content, flavonoid content, antioxidant capacity, isoflavone profile and antimicrobial properties.
:water (1:1) at 40 °C for 30 minutes (Mirac, Thermolyne, USA). Extracts were filtered through Whatman no. 1 filter paper, concentrated under vacuum at 37 °C until dry and kept under refrigeration (4 °C) prior to use. The extracts obtained were further characterized regarding their total phenolic content, flavonoid content, antioxidant capacity, isoflavone profile and antimicrobial properties.
2.7. Determination of total phenolic content
Total phenolic content (TPC) was determined spectrophotometrically according to the Folin–Ciocalteu procedure,20 with minor modifications.21 Briefly, 500 μL of extract was mixed with 2.5 mL of Folin–Ciocalteu reagent (10× dilution) and allowed to react for 5 min. Then 2.5 mL of Na2CO3 7.5% solution was added and allowed to stand for 15 min at 45 °C and 30 min at room temperature. The absorbance was determined at 765 nm using a Synergy HT Microplate Reader (BioTek Instruments, Inc., Winooski, VT, USA). A calibration curve was prepared with standard gallic acid to obtain a correlation between the sample absorbance and standard concentration (linearity range = 5–100 μg mL−1, R2 > 0.998). The total polyphenol content (TPC) of the extracts was expressed as mg of gallic acid equivalents (GAE) per gram of plant material on a dry weight basis (dw).2.8. Determination of total flavonoid content
Total flavonoid content (TFC) was determined by a colorimetric assay based on the formation of flavonoid-aluminum compounds according to Rodrigues et al.1 Briefly, 1 mL of a diluted extract was mixed with 4 mL of ultrapure water and 300 μL of 5% (w/v) NaNO2 solution. After 5 min, 300 μL of 10% (w/v) AlCl3 solution was added, and after 1 min, 2 mL of 1 mol L−1 NaOH and 2.4 mL of ultrapure water were also added. The absorbance was read at 510 nm using the Synergy HT Microplate Reader. Catechin was used as reference to plot the standard curve (linearity range = 0–400 μg mL−1, R2 > 0.999). Total flavonoid concentration (TFC) was expressed as milligrams of catechin equivalents (CAE) per gram of plant material on db.2.9. In vitro antioxidant activity
2.10. Isoflavone profile and content
Isoflavones were determined according to the method developed by Almeida et al.25 The bur hydro-alcoholic extracts were analysed in a reversed-phase HPLC unit (Jasco, Tokyo, Japan), consisting of a Jasco PU-2080 Plus HPLC pump, an AS-950 automated injector, and a MD-2015 Plus multiwavelength diode-array detector (DAD). The separation of the isoflavones was carried out on a reversed-phase Luna C18 column (4.60 mm × 150 mm, 5 μm particle size) from Teknokroma (Barcelona, Spain), maintained at 40 °C. The mobile phase consisted of 0.1% formic acid (A) and acetonitrile with 0.1% formic acid (B). A flow rate of 1 mL min−1 was used, together with an injection volume of 20 μL. The peak purity measurements of all compounds were based on a spectral comparison at three different peak heights through DAD information. The analytes were monitored at 254 nm and quantified on the basis of the internal standard method. The chromatographic data were processed on ChromNAV software (Jasco, Tokyo, Japan) for quantification purposes. Individual external calibration curves were constructed for each isoflavone standard.2.11. Antimicrobial assay
2.12. Cell viability assay
Based on the previous results, the most interesting extract was selected for a cell viability assay. The cell viability assay was performed in keratinocytes (HaCaT) monitoring the uptake and metabolism of the vital mitochondrial dye, 3-(4,5-dimethylthiazol-2-yl)-5-(3-carboxymethoxyphenyl)-2-(4-sulfophenyl)-2H-tetrazolium (MTS) by cell mitochondria. Triplicate wells were incubated with fresh medium in the absence or presence of extracts dissolved in cell culture medium containing 0.1, 1, 10, 100 and 1000 μg mL−1 of extracts. Extracts dissolved in culture medium were filtered on 0.45 μm Millex GV filters (Millipore, Nepean, ON, Canada) and exposed to keratinocytes cells for 24 h.2.13. Statistical analysis of data
Data were reported as mean ± standard deviation of at least triplicate experiments. Statistical analysis of the results was performed with SPSS 22.0 (SPSS Inc., Chicago, IL, USA). One-way ANOVA was used to investigate the differences between samples for all assays. Post hoc comparisons of the means were performed according to Tukey's HSD test. In all cases, p < 0.05 was accepted as denoting significance.3. Results and discussion
3.1. Castanea sativa bur
| Region | |||
|---|---|---|---|
| Minho | Trás-os-Montes | Beira-Alta | |
| Values are average of three individual samples (n = 3), expressed as mean ± standard deviation. | |||
| Moisture | 26.9 ± 0.67a | 25.6 ± 0.61a | 15.5 ± 0.36b |
| Ash | 5.61 ± 0.27a | 1.80 ± 0.06b | 1.37 ± 0.05b |
| Proteins | 3.16 ± 0.09a | 3.14 ± 0.15a | 2.22 ± 0.01b |
| Fat | 1.19 ± 0.01b | 1.59 ± 0.01a | 0.85 ± 0.00b |
| Carbohydrates | 63.14 ± 0.21a | 67.87 ± 0.17a | 80.06 ± 0.08b |
The chestnut bur showed a moisture content between 15.5 and 26.9%, with significant differences (p < 0.05) according to the region of origin. The ash content from the Minho bur samples was statistically different from those of the Trás-os-Montes and Beira-Alta samples, presenting the highest values. These values are at the same levels as those of other food by-products evaluated as new ingredients for different industries.28 As expected, the protein content was low, ranging from 2.22 to 3.16%, with the lowest value being that for the Beira-Alta samples. These values are lower than in other food by-products reported as potential ingredients for different fields, such as coffee silverskin.28 Regarding fat, the values obtained ranged between 0.85 and 1.59%. Indeed, carbohydrates represent the major group of compounds (60–80%) in this by-product. This macronutrient part includes the non-digestible components (such as lignins, pectins or resistant starch) and the other indigestible carbohydrates (also known as dietary fiber fraction). This could be one of the main compositional advantages of the valorization of the chestnut bur. Several technological attributes of the fiber fraction of agro-industrial by-products have been described as having water binding, gelling and structure building capacities. The possibility of their use as a fat replacer in food formulations has been considered.29
By comparing the macronutrient composition of the burs with other chestnut by-products it is possible to observe clear differences. The chestnut bur presents a higher moisture content than other food by-products, but a lower moisture content when compared to other chestnut by-products such as the shell.28,30–32 Regarding fat content, the shells presented lower values, with the carbohydrate content being relatively similar, ranging between 56.51–74.06 g per 100 g and 63.14–80.06 g per 100 g, respectively, for shells and burs.7,32,33
| Amino acids | Region | ||
|---|---|---|---|
| Minho | Trás-os-Montes | Beira-Alta | |
| Values are average of three individual samples (n = 3), expressed as mean ± standard deviation. nd – not detectable. | |||
| Essential amino acids (EAA) | |||
| Ile | 134 ± 4ac | 175 ± 2d | 122 ± 11a |
| Leu | 221 ± 4ac | 290 ± 16d | 205 ± 6a |
| Lys | 114 ± 3c | 166 ± 6b | 101 ± 4c |
| Phe | 90 ± 3bc | 111 ± 6c | 60 ± 2a |
| Tyr | 11 ± 0b | 35 ± 2c | 19 ± 5a |
| Thr | 136 ± 5bd | 145 ± 8d | 98 ± 9a |
| Arg | 428 ± 20b | 749 ± 35a | 333 ± 24b |
| Val + Met | 55 ± 1ac | 61 ± 2d | 41 ± 3b |
| Non-essential amino acids (NEAA) | |||
| Ala | 107 ± 9c | 76 ± 2de | 69 ± 5d |
| Ser | 130 ± 12a | 161 ± 7b | 118 ± 15a |
| Asp + Glu | 324 ± 22c | 461 ± 10b | 274 ± 23c |
| Gly | 87 ± 8c | 75 ± 2a | 60 ± 1b |
| Pro | 194 ± 5ab | 227 ± 8b | 190 ± 25abc |
| Orn | 2 ± 0c | 5 ± 0b | 2 ± 0c |
According to the results, the contents of the individual amino acids varied between samples, depending on the bur region. The chemical composition of the bur is influenced by numerous factors, such as growth conditions, the cultivar and even environmental conditions, justifying the significant differences (p < 0.05) detected between the amino acid content of burs grown in different production regions.34 However, in all bur samples, the predominant essential amino acids were arginine (Arg) and leucine (Leu). Essential amino acids are predominant in the protein fraction of the bur, constituting 58.49, 63.28 and 57.86% of total amino acids, respectively, for Minho, Trás-os-Montes and Beira-Alta samples. Regarding non-essential amino acids, glutamic and aspartic acid (Asp + Glu), followed by proline (Pro), were the most representative, with values ranging, respectively, between 274–461 and 190–227 mg per 100 g sample.
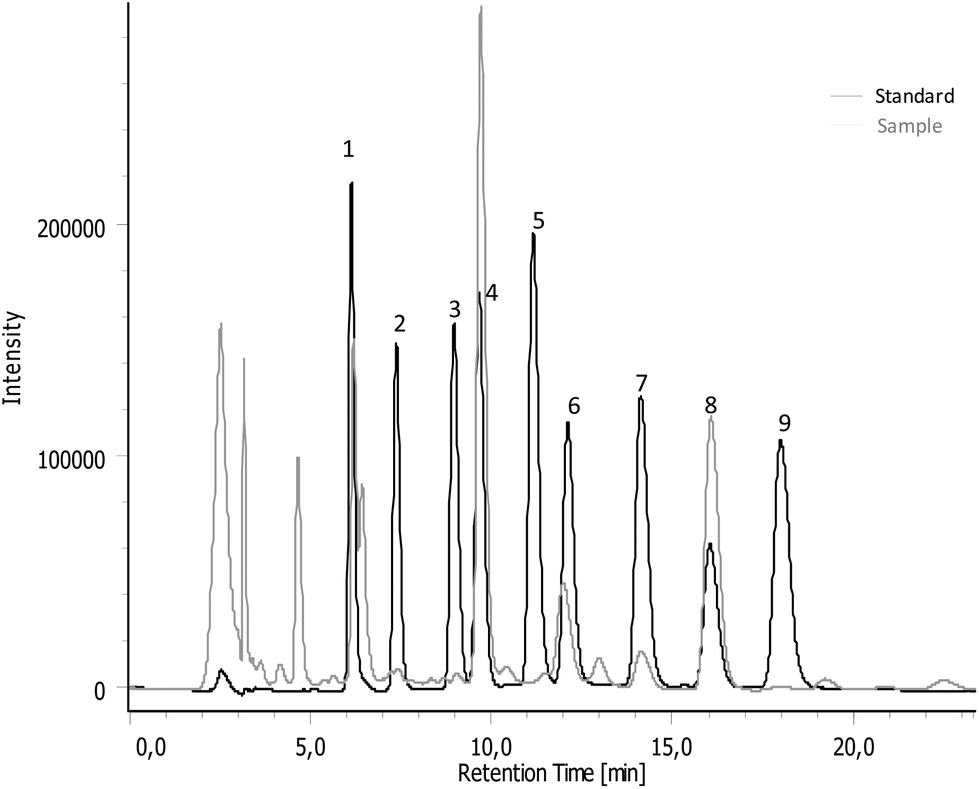 | ||
| Fig. 1 HPLC chromatograms of Trás-os-Montes sample and standard: (1) α-tocopherol; (2) α-tocotrienol; (3) β-tocopherol; (4) γ-tocopherol; (5) β-tocotrienol; (6) γ-tocotrienol; (7) δ-tocopherol; (8) IS, internal standard; (9) δ-tocotrienol. | ||
Table 3 summarizes the vitamin E profile and total content quantified in the C. sativa bur from different production regions.
| Compound analyzed | Region | ||
|---|---|---|---|
| Minho | Trás-os-Montes | Beira-Alta | |
| Values are average of three individual samples (n = 3), expressed as mean ± standard deviation. nd – not detectable. | |||
| α-Tocopherol | 137.00 ± 2.41c | 146.00 ± 3.81b | 196.00 ± 1.01a |
| β-Tocopherol | 3.36 ± 0.09b | 6.39 ± 0.06a | 6.17 ± 0.12a |
| δ-Tocopherol | 15.50 ± 0.12c | 318.00 ± 7.14a | 39.50 ± 1.09b |
| γ-Tocopherol | 50.40 ± 1.18a | 37.40 ± 1.18b | 37.30 ± 1.22b |
| α-Tocotrienol | 6.56 ± 0.12c | 8.12 ± 0.33b | 9.69 ± 0.35a |
| β-Tocotrienol | nd | 2.99 ± 0.52b | nd |
| γ-Tocotrienol | 41.90 ± 0.82b | 99.10 ± 0.04a | 41.60 ± 0.29b |
| δ-Tocotrienol | 3.77 ± 0.08b | 6.18 ± 0.53a | 3.04 ± 0.97b |
| Total | 258.49c | 624.08a | 333.30b |
According to Table 3, the burs from Trás-os-Montes presented the highest amount of vitamin E, followed by those from Beira-Alta and Minho. The difference between samples was highly substantial, with the burs from Trás-os-Montes having almost double the vitamin E content detected in the other two samples. These samples also showed different vitamin E profiles according to their origin. In the Trás-os-Montes samples, δ-tocopherol represented the most predominant vitamer, followed by α-tocopherol, whereas α-tocopherol was the predominant vitamer in the Minho and Beira-Alta samples.
From a qualitative point of view, the bur presented a vitamin E profile quite different from the chestnut and the shell.36,37 For both, γ-tocopherol was the prevailing vitamer detected, accounting for more than half of the total profile determined for all studied samples. Other food by-products, such as hazelnut skin, present γ-tocopherol as the prominent vitamer, followed by α, β and δ-tocopherols.30 Nevertheless, the content reported for hazelnut skin is considerably lower when compared with the chestnut bur.
3.2. Castanea sativa bur hydro-alcoholic extracts
The extraction yields (expressed as w/w percentages) for Minho, Trás-os-Montes and Beira-Alta samples were, respectively, 11.50 ± 0.20, 43.30 ± 0.15 and 4.70 ± 0.10. As can be observed, the extraction yield for Trás-os-Montes was statistically higher (p < 0.05) and different from the other samples. This is probably due to the environmental conditions, as this region is drier and colder than the others, particularly in 2013, according to governmental reports.38 In a previous study Rodrigues et al. reported yields in the same range for chestnut shells from Minho and Beira-Alta.39 The value reported by the group for Trás-os-Montes was lower (≈ 13%). Nevertheless, it should be highlighted that burs protect the shell from the environmental conditions and, as previously reported, in 2013 the atmosphere was drier, which could have affected the bur composition.| Region | |||
|---|---|---|---|
| Minho | Trás-os-Montes | Beira-Alta | |
| Values are average of three individual samples (n = 3), expressed as mean ± standard deviation. | |||
| TPC (mg GAE per g db) | 85.28 ± 0.702b | 56.20 ± 3.425c | 92.24 ± 1.194a |
| TFC (mg CAE per g db) | 33.67 ± 1.20a | 4.91 ± 0.80c | 26.24 ± 2.58b |
| EC50 (μg mL−1) | 38.67 ± 6.54c | 57.61 ± 9.29b | 76.86 ± 4.4a |
| FRAP (μmol of ferrous sulphate per g db) | 4510.4 ± 146.90a | 835.3 ± 55.02c | 3878.9 ± 75.89b |
The TPC and TFC of the hydro-alcoholic extracts of the chestnut burs varied significantly (p < 0.05) among the different regions. Although Trás-os-Montes hydroalcoholic extracts allowed a higher extraction yield, the TPC and TFC contents of the Beira-Alta and Minho samples were considerably higher. These marked differences obtained for Trás-os-Montes samples can be explained by the differences in environmental conditions and soil composition.38 Minho and Beira-Alta are rainfall regions, compared with Trás-os-Montes, which is normally drier.38 This leads to substantial differences in soil composition, as greater dryness has a direct effect on organic matter decline, due to a lower production of biomass and mineralization. The values reported in Table 4 are in accordance with the ones obtained by Vázquez et al.7
Regarding EC50, Minho presents the best results (38.67 ± 6.54). Overall, chestnut burs from Minho revealed better antioxidant properties (significantly lower EC50 values, p < 0.05; Table 4). The obtained results are generally in agreement with the TPC and TFC determined for each sample, as shown in Table 4. The values were slightly lower than those reported by Barreira et al. (2010), whose EC50 values for chestnut shell extracts ranged between 82.41 and 159.99 μg mL−1 for the same samples.40 However, the values reported are higher than for other food by-products such as coffee silverskin or Medicago sativa previously evaluated in our group.1,41 Regarding FRAP, the results are similar to DPPH, with the Minho samples showing the best antioxidant profile, followed by the Beira-Alta and Trás-os-Montes samples
Further studies are being performed in our laboratory in order to identify and quantify the phenolic compounds present in C. sativa bur extracts.
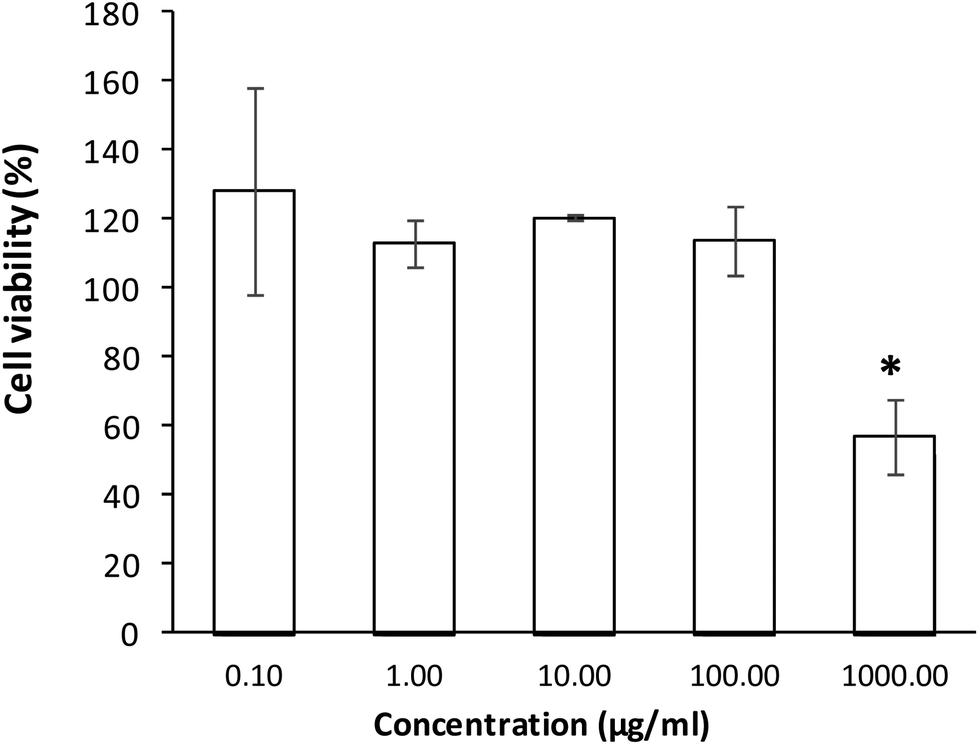 | ||
| Fig. 2 Effect on the metabolic activity of HaCaT cells after the exposure to bur extracts at different concentrations, measured by the MTT assay. Values are expressed as the mean ± SD (n = 6). * denote a significant difference between mean values. | ||
According to the obtained results for the MTT assay, the extract did not decrease the cell viability between 0.1 and 100 μg mL−1. However, in a concentration of 1000 μg mL−1, the cell viability decreases for 57.07%, more than a half of the cell viability observed for a concentration of 0.1 μg mL−1.
4. Future perspectives and conclusion
These results revealed the high potential of this chestnut by-product as a new source of bioactive compounds that might provide a novel strategy to stimulate the application of waste products as a new supplier of this type of compound. Burs are mainly composed of carbohydrates, having a low fat value also, which can support their use as a useful ingredient in a new food product formulation. Their amino acid content and vitamin E profile showed very interesting results, with prevailing essential amino acids and a high content of δ-tocopherol and α-tocopherol. All extract samples revealed good antioxidant properties, with low EC50 values, when compared with other food by-products. Also, until a concentration of 100 μg mL−1 no decrease on cell viability was observed, supporting their potential safety in keratinocytes. These results demonstrated that a food by-product could be reused by different industries, such as the food, cosmetic or even pharmaceutical industries, with high economic value, particularly in Mediterranean countries where high amounts of this waste are generated. Further research is now requested, such as cell viability studies in skin 3D models and different intestinal cell lines, in order to stimulate their re-use.Acknowledgements
F. Rodrigues and F. B. Pimentel are grateful to the Foundation for Science and Technology (FCT, Portugal) for their PhD grant (SFRH/BDE/51385/2011 and SFRH/BD/109042/2015, respectively) financed by POPH-QREN and subsidised by the European Science Foundation and Ministério da Ciência, Tecnologia e Ensino Superior. J. Santos thanks QREN for her PostDoc grant (NORTE-07-0124-FEDER-000069). This work has been supported by FCT through grant no. PEst-C/EQB/LA0006/2013 and NORTE-07-0124-FEDER-000069 – Food Science. This work received financial support from the European Union (FEDER funds through COMPETE), under the Partnership Agreement PT2020, and National Funds (FCT, Foundation for Science and Technology) through project LAQV/UID/QUI/50006/2013.References
- F. Rodrigues, A. Palmeira-de-Oliveira, J. das Neves, B. Sarmento, M. H. Amaral and M. B. Oliveira, Ind. Crops Prod., 2013, 49, 634–644 CrossRef CAS.
- N. Braga, F. Rodrigues and M. B. P. P. Oliveira, Nat. Prod. Res., 2014, 29, 1–18 CrossRef PubMed.
- F. Rodrigues, C. Pereira, F. B. Pimentel, R. C. Alves, M. Ferreira, B. Sarmento, M. H. Amaral and M. B. P. P. Oliveira, Ind. Crops Prod., 2015, 63, 167–174 CrossRef CAS.
- F. Rodrigues, F. B. Pimentel and M. B. Oliveira, Ind. Crops Prod., 2015, 70, 116–124 CrossRef CAS.
- FAO, 2012.
- B. R. Cruz, A. S. Abraão, A. M. Lemos and F. M. Nunes, Carbohydr. Polym., 2013, 94, 594–602 CrossRef CAS PubMed.
- G. Vázquez, A. Fernández-Agulló, C. Gómez-Castro, M. S. Freire, G. Antorrena and J. González-Álvarez, Ind. Crops Prod., 2012, 35, 126–134 CrossRef.
- E. M. Balboa, M. L. Soto, D. R. Nogueira, N. González-López, E. Conde, A. Moure, M. P. Vinardell, M. Mitjans and H. Domínguez, Ind. Crops Prod., 2014, 58, 104–110 CrossRef CAS.
- I. F. Almeida, J. Maleckova, R. Saffi, H. Monteiro, F. Goios, M. H. Amaral, P. C. Costa, J. Garrido, P. Silva, N. Pestana and M. F. Bahia, Drug Dev. Ind. Pharm., 2015, 41, 148–155 CrossRef CAS PubMed.
- G. Barrera, ISRN Oncol., 2012, 137289 Search PubMed.
- AOAC, in Official methods of analysis of AOAC International, ed. W. Horwitz, Gaithersburg, USA, 17th edn, 2012, ch. 32, p. 2 Search PubMed.
- AOAC, in Official methods of analysis of AOAC International, ed. W. Horwitz, Gaithersburg, USA, 17th edn, 2000 Search PubMed.
- AOAC, in Official methods of analysis of AOAC International, ed. W. Horwitz, Gaithersburg, USA, 2000, p. 33 Search PubMed.
- K. Tontisirin, W. C. MacLean and P. Warwick, Food energy: Methods of analysis and conversion factors: Report of a technical workshop, Food and Agriculture Organization of the United Nation, Rome, Italy, 2003, pp. 1–66 Search PubMed.
- R. C. Alves, S. Casal and M. B. P. P. Oliveira, Food Sci. Technol. Int., 2009, 15, 57–63 CrossRef CAS.
- M. Fountoulakis and H.-W. Lahm, J. Chromatogr., A, 1998, 826, 109–134 CrossRef CAS PubMed.
- A. M. G. Paramás, J. A. G. Bárez, C. C. Marcos, R. J. García-Villanova and J. S. Sánchez, Food Chem., 2006, 95, 148–156 CrossRef.
- J. L. Navarro, M. Aristoy and L. Izquierdo, Rev. Agroquim. Tecnol. Aliment., 1984, 24, 85–93 CAS.
- F. B. Pimentel, R. C. Alves, A. S. G. Costa, D. Torres, M. F. Almeida and M. B. Oliveira, Food Chem., 2014, 149, 144–150 CrossRef CAS PubMed.
- V. L. Singleton and J. A. J. Rossi, Am. J. Enol. Vitic., 1965, 16, 144–158 CAS.
- R. Alves, A. Costa, M. Jerez, S. Casal, J. Sineiro, M. Núñez and M. B. P. P. Oliveira, J. Agric. Food Chem., 2010, 58, 12221–12229 CrossRef CAS PubMed.
- R. Guimarães, L. Barros, J. C. M. Barreira, M. J. Sousa, A. M. Carvalho and I. C. F. R. Ferreira, Food Chem. Toxicol., 2010, 48, 99–106 CrossRef PubMed.
- L. Barros, P. Baptista and I. C. F. R. Ferreira, Food Chem. Toxicol., 2007, 45, 1731–1737 CrossRef CAS PubMed.
- I. F. F. Benzie and J. J. Strain, in Methods in Enzymology, ed. P. Lester, Academic Press, 1999, vol. 299, pp. 15–27 Search PubMed.
- I. M. C. Almeida, F. Rodrigues, B. Sarmento, R. C. Alves and M. B. P. P. Oliveira, Food Funct., 2015, 6, 938–946 CAS.
- C. L. S. I. Clinical Laboratory Standards Institute, NCCLS, Wayne, Pennsylvania, 2nd edn in M27-A3, 2008.
- M. Wikler, D. Low, F. Cockerill, D. Sheehan, W. Craig, F. Tenover, M. Dudley, J. Turnidge, G. Eliopoulos, M. Weinstein, D. Hecht, B. Zimmer, J. Hindler, M. Ferraro and J. Swenson, NCCLS, Wayne, Pennsylvania, 2003, vol. 26.
- Y. Narita and K. Inouye, Food Res. Int., 2014, 61, 16–22 CrossRef CAS.
- N. O'Shea, E. K. Arendt and E. Gallagher, Innovative Food Sci. Emerging Technol., 2012, 16, 1–10 CrossRef.
- K. S. Özdemir, C. Yılmaz, G. Durmaz and V. Gökmen, Food Res. Int., 2014, 65(Part B), 291–297 CrossRef.
- H. Ciemniewska-Żytkiewicz, V. Verardo, F. Pasini, J. Bryś, P. Koczoń and M. F. Caboni, Food Chem., 2015, 168, 615–622 CrossRef PubMed.
- G. Vázquez, J. González-Alvarez, J. Santos, M. S. Freire and G. Antorrena, Ind. Crops Prod., 2009, 29, 364–370 CrossRef.
- G. Vázquez, E. Fontenla, J. Santos, M. S. Freire, J. González-Álvarez and G. Antorrena, Ind. Crops Prod., 2008, 28, 279–285 CrossRef.
- L. Morrone, C. Dall'Asta, A. Silvanini, M. Cirlini, D. Beghè, A. Fabbri and T. Ganino, Sci. Hortic., 2015, 192, 132–140 CrossRef CAS.
- M. Hasanuzzaman, K. Nahar and M. Fujita, in Emerging Technologies and Management of Crop Stress Tolerance, ed. P. Ahmad and S. Rasool, Academic Press, San Diego, 2014, pp. 267–289 Search PubMed.
- M. D. Zlatanov, G. A. Antova, M. J. Angelova-Romova and O. T. Teneva, J. Sci. Food Agric., 2013, 93, 661–666 CrossRef CAS PubMed.
- J. C. M. Barreira, R. C. Alves, S. Casal, I. C. F. R. Ferreira, M. B. P. P. Oliveira and J. A. Pereira, J. Agric. Food Chem., 2009, 57, 5524–5528 CrossRef CAS PubMed.
- INE, ed. Instituto Nacional de Estatística I. P., ISBN 978-989-25-0198-7. Lisbon, 2013.
- F. Rodrigues, J. Santos, F. B. Pimentel, N. Braga, A. Palmeira-de-Oliveira and M. B. P. P. Oliveira, Food Funct., 2015, 6, 2854–2860 CAS.
- J. C. M. Barreira, I. C. F. R. Ferreira, M. B. P. P. Oliveira and J. A. Pereira, Food Sci. Technol. Int., 2010, 16, 209–216 CrossRef CAS PubMed.
- F. Rodrigues, A. Palmeira-de-Oliveira, J. Das Neves, B. Sarmento, M. H. Amaral and M. B. P. P. Oliveira, Pharm. Biol., 2014, 4, 1–9 Search PubMed.
- F. Rodrigues, I. Almeida, B. Sarmento, M. H. Amaral and M. B. P. P. Oliveira, Ind. Crops Prod., 2014, 57, 110–115 CrossRef CAS.
- S. Pillai, M. Cornell and C. Oresajo, in Cosmetic Dermatology - Products and Procedures, ed. Z. D. Draelos, Blackwell Publishing Ltd, West Sussex, 2010, pp. 3–12 Search PubMed.
| This journal is © The Royal Society of Chemistry 2017 |