The protective effects of Cichorium glandulosum seed and cynarin against cyclophosphamide and its metabolite acrolein-induced hepatotoxicity in vivo and in vitro
Jing
Tong
a,
Qi-Gui
Mo
a,
Bing-Xin
Ma
a,
Lan-Lan
Ge
a,
Gao
Zhou
a and
You-Wei
Wang
*ab
aInstitute of TCM and Natural Products, School of Pharmaceutical Sciences, Wuhan University, Wuhan 430071, P. R. China. E-mail: wyw@whu.edu.cn; Fax: +86 27 68759010; Tel: +86 27 68759323
bMOE Key Laboratory of Combinatorial Biosynthesis and Drug Discovery, Wuhan University, Wuhan 430072, P. R. China
First published on 25th November 2016
Abstract
Cyclophosphamide (CP) is a widely utilized chemotherapy drug. CP and its metabolite, acrolein, could induce hepatotoxicity. In this study, Cichorium glandulosum seed (CGS) effectively mitigated CP-induced hepatotoxicity in mice. Protection of cynarin, the major compound of CGS, against acrolein cytotoxicity in HepG2 cells was studied. Pretreatment with cynarin could improve cell survival against acrolein cytotoxicity. Cynarin restored the balance of glutathione (GSH) and reactive oxygen species (ROS), and inhibited mitochondrial depolarization. The kinetics of Nrf2 expression in cytosolic and nuclear fractions were observed after acrolein exposure. Intracellular Nrf2 expression was triggered within 6 h of exposure but did not translocate to the nucleus. Cynarin pretreatment ameliorated the expression and activity of GSH S-transferase and triggered Nrf2 nuclear translocation. In conclusion, treatment with CGS and cynarin protects liver injury against CP and acrolein hepatotoxicity via improvement of GSH activity and activation of the Nrf2 pathway.
Introduction
Cyclophosphamide (CP), which was initially synthesized in 1958, is listed on the WHO List of Essential Medicines.1 CP is a nitrogen mustard alkylating agent that is considered to be one of the most successful and widely utilized antineoplastic drugs against lymphomas, breast and ovarian cancers.2 Moreover, CP is also the most commonly used drug in blood and marrow transplantation (BMT).3 As an immunosuppressant, CP is also used against rheumatoid arthritis, systemic lupus erythematosus, multiple sclerosis, and pulmonary fibrosis in systemic sclerosis.4–7 CP is a pro-drug that requires metabolic activation, being oxidized to 4-hydroxycyclophosphamide and aldophosphamide in equilibrium by the hepatic oxidase system.8 These compounds are inert pro-drugs. Aldophosphamide is converted to acrolein and phosphoramide mustard. The latter product facilitates cell death through producing intrastrand and interstrand DNA crosslinks that are responsible for the cytotoxic effect of CP, whereas acrolein is the toxic metabolite associated with the toxic side effects of CP.9 CP-induced hepatotoxicity in therapeutic dosages may interfere with hepatic intracellular oxidant/antioxidant balance and lead to the accumulation of reactive oxygen species (ROS).10,11 Furthermore, certain studies showed that exposure to acrolein can lead to hepatotoxicity. The mechanisms of acrolein-induced hepatocellular toxicity are not completely understood. However, the study showed that acrolein could rapidly deplete intracellular glutathione (GHS), which preceded the loss of cell viability.12ROS are produced by various metabolic processes at low levels. Cells possess endogenous antioxidant defenses that are regulated at the transcriptional level by Nrf2/ARE to maintain redox balance.13 Nuclear factor-erythroid 2 p45 subunit-related factor 2 (Nrf2) is a transcription factor that regulates the basal and inducible expression of cytoprotective genes and hepatic detoxification enzymes.14 The low level of the Nrf2 protein is usually brought about by the binding of Nrf2 to Kelch-like ECH-associated protein-1 (Keap 1). The cytoplasmic protein Keap 1 acts as a negative regulator of Nrf2 and a sensor of xenobiotic and oxidative stresses. Once exposed to oxidative stress, Keap 1 is oxidized or covalently modified and dissociates Nrf2. The degraded Nrf2 translocates into the nucleus and heterodimerizes with antioxidant response elements (AREs) which provoke the transcription of phase II xenobiotic detoxification enzymes, phase III transporters, and antioxidant proteins.14,15 The Nrf2–Keap 1 system is now recognized as one of the major cellular defensive mechanisms against oxidative stress.16 It is necessary to explore an alternative safe and effective therapy against CP hepatotoxicity by regulating the antioxidant defense pathway. Earlier studies have suggested that the leading bioactive constituents from herbs showed against clinical drug-induced hepatotoxicity through Nrf2/ARE.17,18
Chicory, a perennial plant in the family of Asteraceae, is used both in food and traditional or modern medicine. Chicory is cultivated as a medicinal plant, coffee substitute, vegetable crop, and animal forage.19 Various product forms of chicory are consumed, including chicory coffee, chicory salad, chicory tea, and ingredients for chewing gum.20,21 Coffee beverages, tea, and other functional foods contain chicory or inulin. Chicory has been recognized as a medicinal and edible plant species by the Ministry of Health of PR China since 2002. The Food and Drug Administration (FDA) regarded that the extracts of chicory are safe for food and non-food utilization.22 The genus of Cichorium consists of 10 to 12 species in the world, but only two of them, Cichorium intybus L. and Cichorium glandulosum Boiss. and Huet, are used as medicine and edible food.21 These two species are the major and legal sources recorded in the Pharmacopoeia of the People's Republic of China.23 The two species share similar chemical composition, bioactivities, and traits, except for the stem with strigose hairs of C. glandulosum.21 The aerial parts and roots of C. glandulosum and C. intybus are named “Juju” or chicory in Chinese. As a traditional Uygur herb, chicory shows considerable value for its tonic effects on the liver.
C. glandulosum is widely distributed in Xinjiang Uyghur Autonomous Region. C. glandulosum seeds (CGSs) are commonly mixed with coffee seeds in the preparation of coffee powder, as this method is believed to counteract the stimulating effect of caffeine.24 CGSs are used as coffee substitutes, and contain chlorogenic acid and caffeoylquinic acid, like coffee.25 Cynarin, which is the main compound in CGS, is found in green coffee beans.26 Coffee consumption could induce cancer chemopreventive enzymes against acrolein hepatotoxicity.27 In our previous studies, CGS showed antioxidant activity28,29 and has been investigated for the hepatoprotective efficiency against carbon tetrachloride and acetaminophen-induced hepatotoxicity,19 but its hepatic protection against CP has not been reported until now. In this study, we have investigated the ameliorative potential of CGS against CP-induced liver toxicity in vivo. This research focused on the molecular targets of acrolein toxicities and the mechanisms of the cynarin-protective effect against acrolein hepatocellular toxicity in vitro.
Materials and methods
Reagents
High-performance liquid chromatography (HPLC)-grade solvents, 3-(4,5-dimethyl thiazol-2-yl)-5-diphenyl tetrazolium bromide (MTT), cynarin, and acrolein, were purchased from Sigma (St Louis, MO, USA). Cell culture solvents were purchased from Thermo Scientific (Waltham, MA, USA). Silymarin capsules were purchased from Madaus AG (Cologne, Germany). 2′,7′-Dichlorofluorescin diacetate (DCFH-DA) was purchased from the Beyotime Institute of Biotechnology (Nantong, China). CP injections were purchased from Jiangsu Hengrui Pharmaceutical Co. Ltd (Lianyungang, China).Plant material
CGSs were purchased from the experimental base of Xinjiang Uygur Medical College, Hetian (Xinjiang Uygur Autonomous Region, China). The seeds were identified by Prof. Youwei Wang of Wuhan University.Preparation of the plant extracts
The extracts were prepared as previously described.27 Dried seeds were crushed to a coarse powder, which were extracted with 70% ethanol (solvent/seed ratio of 10![[thin space (1/6-em)]](https://www.rsc.org/images/entities/char_2009.gif) :
:![[thin space (1/6-em)]](https://www.rsc.org/images/entities/char_2009.gif) 1, v/w). Crude extracts were concentrated to obtain a viscous mass. The yield was about 15%.
1, v/w). Crude extracts were concentrated to obtain a viscous mass. The yield was about 15%.
Experimental animals
Fifty male BALB/c mice (SPF, six weeks old) weighing about 20–22 g were purchased from the Laboratory Animal Center (LAC) of Wuhan University. The animals were housed in standard polypropylene cages (10 mice per cage) with a 12 h light/dark cycle. The mice had free access to purified water and a standard rodent diet ad libitum (purchased from the LAC). The study received clearance from the Institutional Animal Ethical Committee of the Committee for the Purpose of Control and Supervision of Experiments on Animals, Wuhan University, Wuhan, China (AUP2013124).Experimental design and animal treatment
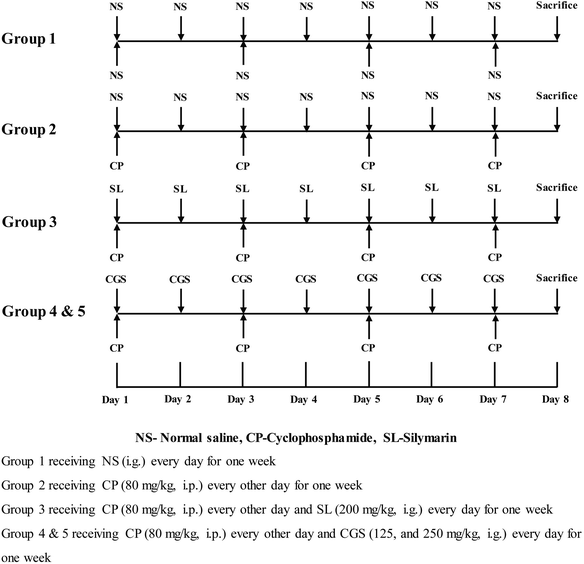
After one week of acclimatization, mice were included in the design to initiate the study, which lasted for eight days. As previously described,30 mice were divided randomly into five groups (Fig. 1), each consisting of 10 mice. Group 1: the control group was administered with saline. Group 2: the CP treated group was administered intraperitoneally with CP at a dose of 80 mg kg−1 dissolved in saline four times at 1, 3, 5, and 7 days. Group 3: the positive control group received CP at a dose of 80 mg kg−1 four times at 1, 3, 5, and 7 days after oral administration of silymarin at a dose of 200 mg kg−1 once daily. Group 4 & 5: CGS treatment groups received CP at a dose of 80 mg kg−1 four times at 1, 3, 5, and 7 days after oral administration of CGS at doses of 125 and 250 mg kg−1 once daily. The control group received the same volume of saline. The dose volume was 0.2 mL per 10 g body weight. Mice were weighed every day during the experiment and sacrificed at 24 h after the last dose of CP. Blood was collected, and serum was separated for biochemical assays. Animals were dissected, and livers were collected. A portion of the liver tissue was fixed with 10% formalin for histopathologic investigation. The remaining part was homogenized in chilled PBS, and homogenates were centrifuged at 1000g for 5 min at 4 °C. The supernatant was collected and stored at −80 °C for biochemical studies.Serum and liver homogenate biochemical analysis
Serum alanine aminotransaminase (ALT) and aspartate aminotransferase (AST), as well as liver homogenate GSH, total superoxide dismutase (T-SOD) and thiobarbituric acid reactive substances (TBARS) were determined using commercial assay kits (Nanjing Jiancheng Technology Co. Ltd, Nanjing, China).Analysis of CGS by liquid chromatography–tandem mass spectrometry
The extract used in HPLC analysis was passed through 0.45 μm filter before injection. A Shimadzu LC-20A was used to analyze the CGS extract. The analytical column was a 5 μm × 4.6 mm × 250 mm C18 column (Agilent, USA). The HPLC mobile phase was methanol (A) and water containing 0.2% formic acid (B). The method consisted of A from 0 to 30% for 10 min to 42% for 20 min and to 100% for 40 min with a flow rate of 1 mL min−1 and ultraviolet detection at 330 nm. Mass analyses were performed in positive ion mode at a desolvation temperature of 250 °C and source temperature of 120 °C, with a capillary voltage of 1.2 kV and cone voltage of 30 V. Compound identities in CGS were confirmed against standards by using both retention time and fragmentation pathways. The cynarin content of CGS was determined by HPLC.Standard solution and calibration curve
About 5 mg of a standard was dissolved in a 5 mL volumetric flask with methanol to obtain a standard stock solution. The working standard solutions were diluted to a series of concentrations with methanol. The peak areas were plotted against the concentrations to establish a calibration curve.Cell culture and treatments
HepG2 cells (China Center for Type Culture Collection, Beijing, China) were maintained in DMEM with 10% fetal bovine serum, 100 IU mL−1 penicillin, 0.1 μg mL−1 streptomycin under a humidified 5% CO2 atmosphere. Cell viability was determined by MTT assay.31 The cells were seeded into 96-well plates at 3 × 10⁴ cells per well in 100 μL and then incubated for 24 h. Test cells were treated with acrolein, CP, and cynarin at different concentrations. For the protective assay, the cells were pretreated with cynarin for 2 h and then exposed to added acrolein at selected time points. MTT assay was used to determine cell viability. The percentage of viability was calculated using the following formula: Cell viability (%) = (Abscontrol − Abssample) × 100/Abscontrol.Biochemical assay
Cell culture supernatant lactate dehydrogenase (LDH), glutathione S-transferase (GST), and GSH in hepatic lysates were measured using a Jiancheng (Nanjing) reagent kit.Detection of ROS generation in cells
After 24 h treatment, the cells were washed with cooled phosphate-buffered saline and stained with DCFH-DA for 20 min at 37 °C. The fluorescence of ROS was detected by using a fluorescence microscope.Assessment of mitochondrial membrane potential
During 24 h treatment, a mitochondrial membrane potential assay kit with JC-1 (the Beyotime Institute of Biotechnology, Nantong, China) was used. The fluorescent lipophilic probe JC-1 was loaded at 37 °C for 20 min and then washed. The fluorescence of JC-1 forms was detected by fluorescence microscopy.Western blotting
Proteins extracted from HepG2 cells were subjected to SDS-PAGE and immunoblotting analysis with indicated antibodies. HepG2 were harvested with acrolein and cynarin incubation at selected time and concentrations. The cells were rinsed with ice-cold PBS. The cells were collected by scraping for 1 min at 4 °C with lysis buffer (RIPA lysis buffer, Beyotime, China) with 1 mM PMSF, and nuclear proteins were extracted using a nuclear cytosol extraction kit (Applygen Technologies Inc., China). Total and nuclear proteins were quantified using a BCA kit (Beyotime, China). For western blot analysis, lysate aliquots containing 40 μg of proteins were separated by SDS-PAGE (10% polyacrylamide gel) and transferred onto a nitrocellulose membrane (Schleicher and Schuell Bioscience, Germany) using a Bio-Rad Transblot (200 mA, 2.5 h). Membranes were blocked at room temperature in blocking buffer (5% BSA in TBS/Tween 0.1%) and then incubated overnight at 4 °C with primary antibodies: anti-Nrf2 (1/1000), anti-GST (1/1000), anti-HO-1 (1/1000), anti-actin (1/1000), and anti-H3 (1/1000) (the Beyotime Institute of Biotechnology, Nantong, China). After washing in 0.1% TBS/Tween three times, the membranes were incubated with the secondary antibody, HRP-conjugated anti-rabbit IgG antibody (1![[thin space (1/6-em)]](https://www.rsc.org/images/entities/char_2009.gif) :
:![[thin space (1/6-em)]](https://www.rsc.org/images/entities/char_2009.gif) 3000), for 1 h. After washing in TBS/Tween 0.1%, detection was achieved using an Immobilon Western Chemiluminescent HRP Substrate, and the bands were analysed for quantification using an LAS 3000 system (Raytest, Straubenhardt, Germany). H3 and β-actin were used as loading controls for nuclear and whole cell extracts, respectively.32
3000), for 1 h. After washing in TBS/Tween 0.1%, detection was achieved using an Immobilon Western Chemiluminescent HRP Substrate, and the bands were analysed for quantification using an LAS 3000 system (Raytest, Straubenhardt, Germany). H3 and β-actin were used as loading controls for nuclear and whole cell extracts, respectively.32
Statistical analysis
All data are expressed as means ± standard deviation of the mean of triplicate determinants. Statistical significance was determined by one-way analysis of variance (ANOVA) followed by least significant difference (LSD) post hoc testing, which are performed using the Statistical Package for Social Sciences, version 20.0 (SPSS, Chicago, USA). An IC50 concentration was calculated based on the probit curve of the cell viability. p values of less than 0.05 were considered statistically significant.Results
CGS protective effects against CP-induced hepatotoxicity
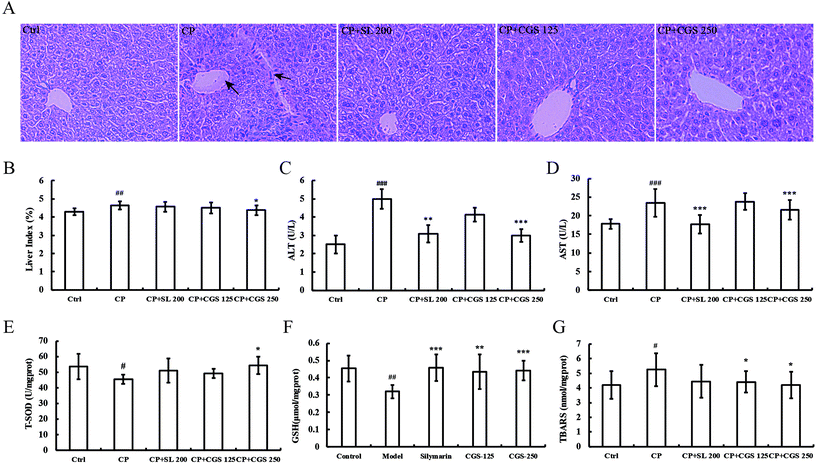
The liver architecture is shown in Fig. 2A. Tissue sections from the liver were stained with hematoxylin and eosin. Compared with the control group, after four times CP treatment, the major structural changes in the liver are portal tract sclerosis and portal artery thrombosis. In addition, the liver section from the CP group shows cellular inflammation of hepatocytes with vascular congestion. Oral administration of silymarin (200 mg per kg body weight), and CGS extract (250 and 125 mg per kg body weight) improved the hepatic architecture. The liver index is shown in Fig. 2B. CP treatment could significantly increase the liver index (p < 0.01) in comparison with the control group. CP with CGS 250 could reduce the liver index significantly (p < 0.05) compared with the CP-induced group. The liver function markers in CP-induced mice are shown in Fig. 2C and D. Mice administered with multiple doses of CP showed increased serum ALT levels (4.99 U L−1 ± 0.53 versus 2.51 U L−1 ± 0.50, p < 0.001) compared with the mice in the control group. Mice treated with CGS (250 mg per kg body weight) showed significant amelioration of ALT (3.00 U L−1 ± 0.34 versus 4.99 U L−1 ± 0.53, p < 0.001) compared with the CP treated group. Meanwhile, mice administered with positive control, silymarin, restored ALT levels significantly (3.09 U L−1 ± 0.48 versus 4.99 U L−1 ± 0.53, p < 0.01) compared with the CP treated group. In Fig. 2D, mice administered with multiple doses of CP showed increased serum AST levels (23.44 U L−1 ± 3.66 versus 17.82 U L−1 ± 1.32, p < 0.001) compared with the mice in the control group. Mice treated with CGS (250 mg per kg body weight) showed significant amelioration of AST (21.60 U L−1 ± 2.64 versus 23.44 U L−1 ± 3.66, p < 0.001) compared with the CP treated group. Meanwhile, mice administered with silymarin, restored the AST level significantly (17.74 U L−1 ± 2.52 U L−1versus 23.44 U L−1 ± 3.66 U L−1, p < 0.001) compared with the CP treated group. The antioxidant status of liver homogenate is shown in Fig. 2E–G. Mice administered with CP showed decreased liver T-SOD levels (53.62 U per mg prot ± 8.13 versus 45.47 U per mg prot ± 2.95, p < 0.05) compared with the control group. Mice treated with CGS (250 mg per kg body weight) showed significant amelioration of T-SOD (54.27 U per mg prot ± 5.63 versus 45.47 U per mg prot ± 2.95, p < 0.05) compared with the CP treated group. In Fig. 2F, mice administered with CP showed decreased liver GSH levels (0.32 μmol per mg prot ± 0.04 versus 0.45 μmol per mg prot ± 0.07, p < 0.01) compared with the control group. Mice treated with CGS (125 and 250 mg per kg body weight) showed significant amelioration of GSH (0.43 μmol per mg prot ± 0.10 and 0.44 μmol per mg prot ± 0.05, p < 0.01 and p < 0.001, respectively). Meanwhile, mice administered with silymarin, restored the GSH level significantly (0.46 μmol per mg prot ± 0.07 versus 0.32 μmol per mg prot ± 0.04, p < 0.001) compared with the CP treated group. In Fig. 2G, mice administered with CP showed increased liver MDA levels (5.25 nmol per mg prot ± 1.12 versus 4.20 nmol per mg prot ± 0.93, p < 0.05) compared with the mice in the control group. Mice treated with CGS (125 and 250 mg per kg body weight) significantly decreased the MDA levels (4.40 nmol per mg prot ± 0.72 and 4.21 nmol per mg prot ± 0.91, p < 0.05, respectively).Putative identification of compounds and determination of the content of cynarin in CGS
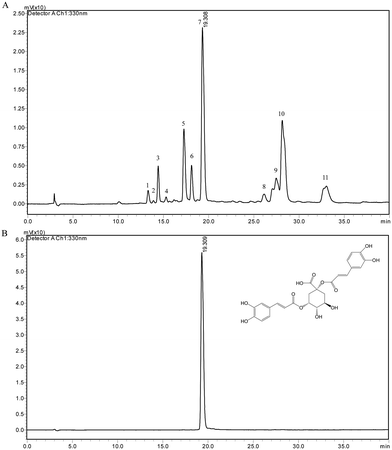
The chemical compositions in CGS extract were analyzed by HPLC coupled with HPLC-ESI/MS. The chromatogram is shown in Fig. 3A. The compositions of putative identification are shown in Table 1. Based on a previous study, compounds which exhibited quasi-molecular ions [M + H]+ include cichoriin (1), esculetin (2), 3-O-caffeoylquinic acid (3), 5-O-caffeoylquinic acid (5), 4-O-caffeoylquinic acid (6), cynarin (7), quercetin-3-glucoside (8), 3.4-dicaffeoylquinic acid (9), 3.5-dicaffeoylquinic acid (10), and 4,5-dicaffeoylquinic acid (11).27,33–35 The chromatogram of the cynarin standard is shown in Fig. 3B. A calibration curve of cynarin was constructed using different concentrations of the standard from Sigma (40, 20, 10, 5, 2.5, and 1.25 μg mL−1). The linear regression equation of this curve and the coefficient of determination (R2) were calculated as y = 57504x − 23![[thin space (1/6-em)]](https://www.rsc.org/images/entities/char_2009.gif) 563 (R2 = 0.9997). Therefore, the content of cynarin was 1.97% ± 0.02 in CGS extract.
563 (R2 = 0.9997). Therefore, the content of cynarin was 1.97% ± 0.02 in CGS extract.
| Peak | TR (min) | MS+ (m/z) | Tentative identification |
|---|---|---|---|
| 1 | 13.298 | 447.80 | Cichoriin |
| 2 | 13.885 | 179.00 | Esculetin |
| 3 | 14.413 | 354.83 | 3-O-Caffeoylquinic acid |
| 4 | 15.289 | 475.90 | Unknown |
| 5 | 17.257 | 354.83 | 5-O-Caffeoylquinic acid |
| 6 | 18.102 | 354.83 | 4-O-Caffeoylquinic acid |
| 7 | 19.308 | 516.92 | 1,3-Dicaffeoylquinic acid |
| 8 | 26.134 | 505.92 | Quercetin-3-glucoside |
| 9 | 27.460 | 516.92 | 3,4-Dicaffeoylquinic acid |
| 10 | 28.134 | 516.92 | 3,5-Dicaffeoylquinic acid |
| 11 | 33.015 | 516.92 | 4,5-Dicaffeoylquinic acid |
Protection of cynarin pretreatment against acrolein-induced cytotoxicity
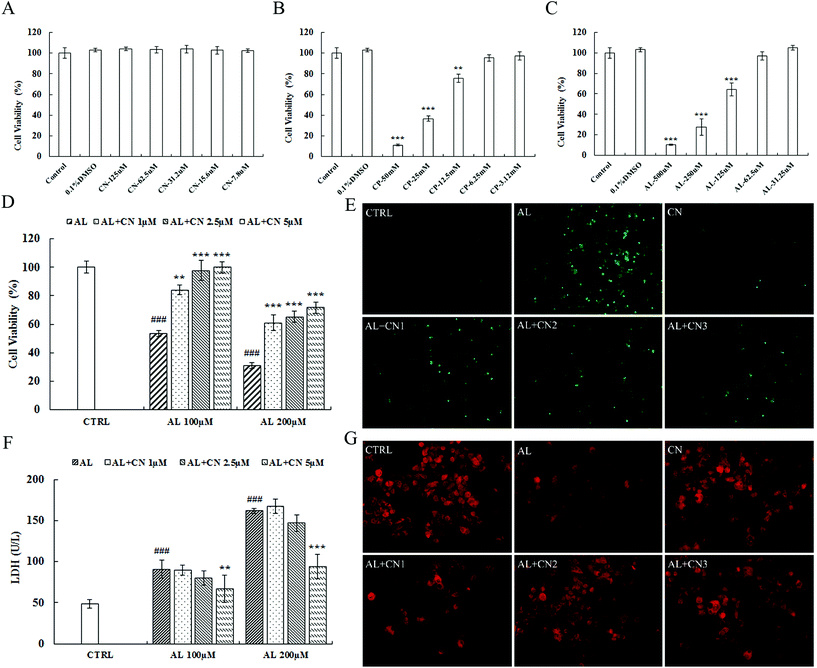
The cytotoxicity of cynarin, CP, and acrolein is shown in Fig. 4A, B, and C. First, cell viability was reduced at 12.5 mM for CP and 125 μM for acrolein. Cynarin showed no cytotoxicity in HepG2 cells from 7.8 μM to 125 μM. The IC50 value of CP was 10.04 mM ± 0.48 in HepG2 cells. For the toxic metabolite, acrolein, the IC50 was 118.2 μM ± 32.8. Second, incubation with cynarin at 1, 2.5, and 5 μM for 2 h significantly improved cell viability after exposure to acrolein for the following 24 h (Fig. 4D). LDH activity in culture medium was detected. Exposure to acrolein resulted in an increase in LDH release, which was suppressed by pretreatment with cynarin at concentrations of 1, 2.5, and 5 μM for 2 h pretreatment (Fig. 4F). These results show that cynarin could protect against acrolein-induced cytotoxicity. ROS generation performs an important function in cytotoxicity.36 HepG2 cells were treated with acrolein following the measurement of intracellular ROS by using DCFH-DA staining. As shown in Fig. 4E, the intracellular ROS level was increased by acrolein at a dose of 100 μM. The group treated with cynarin showed no increase. In contrast, the acrolein groups pretreated with cynarin showed a decrease in the intracellular ROS level in a dose-dependent manner. Mitochondrial membrane potential was monitored by applying the fluorescent probe JC-1, and the results are shown in Fig. 4G. Acrolein at a dose of 100 μM reduced the fluorescence intensity in comparison with the control group. Meanwhile, pretreatment of the acrolein group with cynarin inhibited the reduction in mitochondrial membrane potential relative to the acrolein group.Modulation of Nrf2 expression and GSH depletion in acrolein-induced HepG2 cells
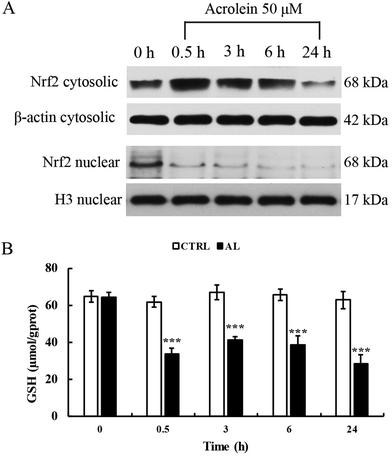
To explore whether acrolein affects the levels of Nrf2 protein expression and translocation, we conducted western blot analysis. Results showed that the total Nrf2 expression level was significantly increased after acrolein exposure at 50 μM for 0.5 h. This phenomenon sustained for 6 h. At 24 h, the level of Nrf2 decreased. Interestingly, the nuclear Nrf2 expression level significantly decreased, immediately after acrolein exposure (Fig. 5A). The intracellular GSH content showed identical trends compared to the Nrf2 expression level (Fig. 5B). The GSH level decreased drastically after acrolein exposure at 50 μM.Effect of cynarin on the activity of the Nrf2 pathway in acrolein-treated HepG2 cells
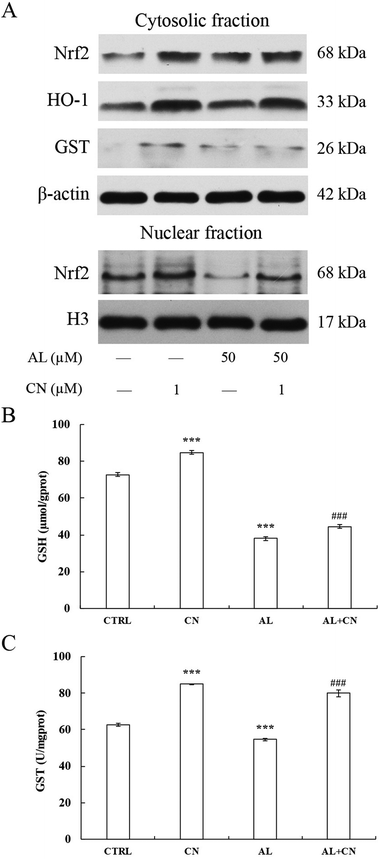
To investigate the role of the Nrf2 pathway in the cytoprotective effect of cynarin against acrolein, we analyzed the nuclear translocation of Nrf2 in response to acrolein with or without cynarin pretreatment by western blot. Pretreatment of 1 μM cynarin effectively augmented the cytosolic and Nrf2 (Fig. 6A). The expression levels of heme oxygenase1 (HO-1) and GST were also determined by western blot. Pretreatment of cynarin also increased the expression level of HO-1 and GST, which are the Nrf2 targets (Fig. 6A), and GSH and GST activities were also improved in comparison with the model group (p < 0.001) (Fig. 6B and C). Thus, cynarin treatment activates the Nrf2 pathway and causes significant nuclear translocation of Nrf2.Discussion
Our results demonstrated that CGS extract exerts chemopreventive efficacy against CP-induced hepatotoxicity in vivo. The liver architecture and biochemical parameters were improved. ALT, AST, GSH, T-SOD and MDA were ameliorated by treatment with CGS. Cynarin, the major compound in CGS, can efficiently protect HepG2 cells against acrolein-induced toxicity in vitro. The protective effect was mediated through ROS scavenging ability and associated with the activation of the Nrf2 pathway.Hepatotoxicity caused by drugs is the single most important cause for the non-approval and withdrawal by FDA.37 For overcoming toxic side effects, a combination of the treatment regimen with potent antioxidants could be the desired approach.38 CGS may be a possible therapy to prevent CP-induced hepatotoxicity based on the combination of treatment strategies. In this regard, this study was designed to investigate the hepatoprotective activities of CP.
In this study, CGS exhibited hepatoprotective activities by restoring liver function biomarkers and improving the hepatic architecture at a dose level of 250 mg kg−1. Although the lower doses of CGS (125 mg kg−1) decreased the AST and ALT levels, the effects were not significantly different from that on the CP treatment group. These findings are in accordance with the traditional function and recent studies.39,40 However, the mechanisms of CGS against CP-induced hepatotoxicity are still unknown. Any subsequent research in vitro should be designed to elucidate these mechanisms. According to HPLC results, cynarin is the major compound in CGS (Fig. 3). Similarly in MTT assay results, CP showed weak cytotoxicity in comparison with its metabolite in HepG2 cells. Taken together, these results prompted us to study the protective mechanisms of cynarin against acrolein in vitro.
Acrolein, a metabolite of CP, is a common food and water pollutant. Humans are exposed to acrolein through oral, respiratory, and dermal routes. Acrolein is connected with several diseases, including Alzheimer's disease, Parkinson's disease, atherosclerosis, diabetes, and liver disorder.41 Current strategies to mitigate acrolein toxicity are insufficient.42 Acrolein toxicities mainly occur by ROS formation (reviewed by Moghe et al.). Kehrer et al. reported that acrolein contributes to cellular oxidative stress via loss of GHS directly.43 This route is extremely effective and rapid.44 Acrolein is a highly electrophilic, α,β-unsaturated carbonyl, which could conjugate with GSH (detoxification) by forming the acrolein–GSH adduct or GS–propionaldehyde.45,46 We observed a rapid depletion of GSH even within 15 min after acrolein exposure. However, pretreatment with cynarin could rectify the intracellular GSH level effectively at the time point (data not shown). There are reports that cynarin presents marked antioxidant and radical-scavenging activities.47,48 The protective effect of cynarin against acrolein was mediated through maintaining the level of GSH and ROS scavenging ability.
As a stress-activated transcription factor, Nrf2 could respond to intracellular oxidative stress. Activation of Nrf2 results in the induction of numerous cytoprotective proteins. Keap 1 is a major repressor of Nrf2 through binding with the protein regularly. Acrolein could trigger the activation of the Nrf2 pathway through ROS formation, as well as inactivate Keap 1.49 In this study, we demonstrated the kinetics of Nrf2 expression in cytosolic and nuclear fractions. Exposure to 50 μM of acrolein resulted in the increased expression of cytosolic Nrf2 in the following 6 h continuously but decreased in 24 h. Interestingly, the nuclear levels of Nrf2 presented different trends compared with the cytosolic levels. The expression decreased during the whole exposure process, indicating that acrolein could not trigger the translocation of Nrf2 to the nucleus, even increasing the total expression of Nrf2. Doggui et al. reported that the activations of Nrf2 by acrolein is concentration-dependent. With higher concentrations of acrolein, Nrf2 was activated after a short treatment duration of 30 min. This response could be considered as compensatory mechanisms, but these compensations could not be sufficient to ensure cell survival.50 In our study, the change in intracellular Nrf2 presented the same trends as that of Doggui's results at 50 μM dosage. However, the failure of translocation of Nrf2 may be the other potential explanation as to why acrolein triggers Nrf2 but fails in cell protection. Another explanation may be related to Cullin 3, which ubiquitinates Nrf2 and aids in transportation to the proteasome, where Nrf2 is degraded.51 Effects on Cullin 3 of acrolein should be studied in future.
Based on the kinetics of Nrf2 expression induced by acrolein, the study of cynarin protection was carried out by 24 h of acrolein exposure. Pretreatment with cynarin could significantly protect HepG2 cells, trigger Nrf2 nuclear translocation, increase the expression and activity of GST, and prevent the depletion of GSH. All of these actions would protect against acrolein hepatotoxicity.
Acrolein is known to induce inflammatory activity, whereas cynarin shows anti-inflammatory activity.52,53 In our study, NO and TNF-α levels were determined after acrolein exposure for 24 h, but no changes were measured (data not shown). Cichocki reported that acrolein induces antioxidant genes at a considerably lower exposure dose than that required to induce proinflammatory genes.54 We measured one time point with one dose only, thus possibly resulting in failure of testing the inflammatory factors.
In conclusion, our observations indicated that CP induces liver damage and that CGS effectively acts against hepatotoxicity. Acrolein shows cytotoxicity, and cynarin is able to protect HepG2 cells against acrolein toxicity. This protection is mediated through inhibition of GHS depletion, activating the Nrf-2-antioxidant response element pathway (Fig. 7).
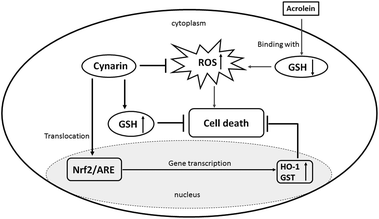 | ||
| Fig. 7 Probable molecular-signaling pathways for the cynarin-mediated hepatoprotective effect against acrolein in HepG2 cells. | ||
Abbreviations
| ALT | Alanine aminotransaminase |
| AREs | Antioxidant response elements |
| AST | Aspartate aminotransferase |
| BMT | Blood and marrow transplantation |
| CGS | Cichorium glandulosum seed |
| CP | Cyclophosphamide |
| FDA | Food and drug administration |
| GSH | Glutathione |
| GST | Glutathione S-transferase |
| HO-1 | Heme oxygenase1 |
| HPLC | High-performance liquid chromatography |
| LDH | Lactate dehydrogenase |
| LSD | Least significant difference |
| MDA | Malondialdehyde |
| MTT | Mumbai.3-(4,5-dimethyl thiazol-2-yl)-5-diphenyl tetrazolium bromide |
| ROS | Reactive oxygen species |
| TBARS | Thiobarbituric acid reactive substances |
| T-SOD | Total superoxide dismutase. |
Conflict of interest statement
The authors declare no competing financial interest.Acknowledgements
This work was supported by the National Natural Science Funds of China (81503356), the Project of the National Twelve-Five Year Research Program of China (2012BAI29B03), the Commonweal Specialized Research Fund of China Agriculture (201103016), and the Nanjing 321 plan for Bringing in technological leading talents (2013A12011).References
- M. T. Madondo, M. Quinn and M. Plebanski, Low dose cyclophosphamide: Mechanisms of T cell modulation, Cancer Treat. Rev., 2016, 42, 3–9 CrossRef PubMed.
- M. E. de Jonge, A. D. Huitema, S. Rodenhuis and J. H. Beijnen, Clinical pharmacokinetics of cyclophosphamide, Clin. Pharmacokinet., 2005, 44, 1135–1164 CrossRef CAS PubMed.
- S. Okano, M. Eto, Y. Tomita, T. Yoshizumi, H. Yamada, R. Minagawa, K. Nomoto and K. Sugimachi, Cyclophosphamide-induced tolerance in rat orthotopic liver transplantation, Transplantation, 2001, 71, 447–456 CrossRef CAS PubMed.
- A. M. Bacon and S. A. Rosenberg, Cyclophosphamide hepatotoxicity in a patient with systemic lupus erythematosus, Ann. Intern. Med., 1982, 97, 62–63 CrossRef CAS PubMed.
- R. J. M. Ten Berge, H. K. van Walbeek and P. T. Schellekens, Evaluation of the immunosuppressive effects of cyclophosphamide in patients with multiple sclerosis, Clin. Exp. Immunol., 1982, 50, 495–502 CAS.
- D. A. Burke, J. C. Stoddart, M. K. Ward and C. G. Simpson, Fatal pulmonary fibrosis occurring during treatment with cyclophosphamide, Br. Med. J., 1982, 285, 696 CrossRef CAS PubMed.
- H. J. Williams, J. C. Reading, J. R. Ward and W. M. O'Brien, Comparison of high and low dose cyclophosphamide therapy in rheumatoid arthritis, Arthritis Rheumatol., 1980, 23, 521–527 CrossRef CAS.
- J. L. Cohen and J. Y. Jao, Enzymatic basis of cyclophosphamide activation by hepatic microsomes of the rat, J. Pharmacol. Exp. Ther., 1970, 174, 206–210 CAS.
- J. Zhang, Q. Tian, S. Yung Chan, S. Chuen Li, S. Zhou, W. Duan and Y. Z. Zhu, Metabolism and transport of oxazaphosphorines and the clinical implications, Drug Metab. Rev., 2005, 37, 611–703 CrossRef CAS PubMed.
- M. Shokrzadeh, A. Ahmadi, F. Naghshvar, A. Chabra and M. Jafarinejhad, Prophylactic efficacy of melatonin on cyclophosphamide-induced liver toxicity in mice, BioMed Res. Int., 2014, 470425, DOI:10.1155/2014/470425.
- E. Habibi, M. Shokrzadeh, A. Chabra, F. Naghshvar, R. Keshavarz-Maleki and A. Ahmadi, Protective effects of Origanum vulgare ethanol extract against cyclophosphamide-induced liver toxicity in mice, Pharm. Biol., 2015, 53, 10–15 CrossRef CAS PubMed.
- H. Shah, A. M. Speen, C. Saunders, E. A. Brooke, P. Nallasamy, H. Zhu, Y. R. Li and Z. Jia, Protection of HepG2 cells against acrolein toxicity by 2-cyano-3,12-dioxooleana-1,9-dien-28-imidazolide via glutathione-mediated mechanism, Exp. Biol. Med., 2015, 240, 1340–1351 CrossRef CAS PubMed.
- R. M. Adibhatla and J. F. Hatcher, Lipid oxidation and peroxidation in CNS health and disease: from molecular mechanisms to therapeutic opportunities, Antioxid. Redox Signaling, 2010, 12, 125–169 CrossRef CAS PubMed.
- T. W. Kensler, N. Wakabayashi and S. Biswal, Cell survival responses to environmental stresses via the Keap1-Nrf2-ARE pathway, Annu. Rev. Pharmacol. Toxicol., 2007, 47, 89–116 CrossRef CAS PubMed.
- K. Zimmermann, J. Baldinger, B. Mayerhofer, A. G. Atanasov, V. M. Dirsch and E. H. Heiss, Activated AMPK boosts the Nrf2/HO-1 signaling axis–A role for the unfolded protein response, Free Radicals Biol. Med., 2015, 88, 417–426 CrossRef CAS PubMed.
- H. Motohashi and M. Yamamoto, Nrf2-Keap1 defines a physiologically important stress response mechanism, Trends Mol. Med., 2004, 10, 549–557 CrossRef CAS PubMed.
- G. Karthivashan, P. Arulselvan, S. W. Tan and S. Fakurazi, The molecular mechanism underlying the hepatoprotective potential of Moringa oleifera leaves extract against acetaminophen induced hepatotoxicity in mice, J. Funct. Foods, 2015, 17, 115–126 CrossRef CAS.
- G. Karthivashan, P. Arulselvan and S. Fakurazi, Pathways involved in acetaminophen hepatotoxicity with specific targets for inhibition/downregulation, RSC Adv., 2015, 5, 62040–62051 RSC.
- R. A. Street, J. Sidana and G. Prinsloo, Cichorium intybus: Traditional Uses, Phytochemistry, Pharmacology, and Toxicology, J. Evidence-Based Complementary Altern. Med., 2013, 579319, DOI:10.1155/2013/579319.
- M. K. Rasmussen, C. L. Klausen and E. Bo, Regulation of cytochrome P450 mRNA expression in primary porcine hepatocytes by selected secondary plant metabolites from chicory (Cichorium intybus L.), Food Chem., 2014, 146, 255–263 CrossRef CAS PubMed.
- H. A. Aisa and X. X. Lei, Cichorium glandulosum Boiss. et Huet (Juju, Chicory), in Dietary Chinese Herbs, Springer Vienna, Wien, Austria, 2015 Search PubMed.
- B. Schmidt, N. A. Ilic and I. Raskin, Toxicological evaluation of a chicory root extract, Food Chem. Toxicol., 2007, 45, 1131–1139 CrossRef CAS PubMed.
- C. P. Committee, Pharmacopoeia of the People's Republic of China, the first division of 2015 edition, China Medical Science and Technology Press, Beijing, China, 2015 Search PubMed.
- Research, C. o. S. a. I, Wealth of India, A Dictionay of India Raw Materials and Industrial Products, New Delhi, India, 1950, vol. 2 Search PubMed.
- J. Tong, B. X. Ma, L. L. Ge, Q. G. Mo, G. Zhou, J. S. He and Y. W. Wang, Dicaffeoylquinic Acid-Enriched Fraction of Cichorium glandulosum Seeds Attenuates Experimental Type 1 Diabetes via Multipathway Protection, J. Agric. Food Chem., 2015, 63, 10791–10802 CrossRef CAS PubMed.
- M. Clifford, Coffee bean dicaffeoylquinic acids, Phytochemistry, 1986, 25, 1767–1769 CrossRef CAS.
- L. G. Higgins, C. Cavin, K. Itoh, M. Yamamoto and J. D. Hayes, Induction of cancer chemopreventive enzymes by coffee is mediated by transcription factor Nrf2. Evidence that the coffee-specific diterpenes cafestol and kahweol confer protection against acrolein, Toxicol. Appl. Pharmacol., 2008, 226, 328–337 CrossRef CAS PubMed.
- B. Huang, Y. X. Chen, B. X. Ma, G. Zhou, J. Tong, J. S. He and Y. W. Wang, Protective effect of Cichorium glandulosum seeds from ultraviolet B-induced damage in rat liver mitochondria, Food Funct., 2014, 5, 869–875 CAS.
- J. Tong, X. C. Yao, H. Zeng, G. Zhou, Y. X. Chen, B. X. Ma and Y. W. Wang, Hepatoprotective activity of flavonoids from Cichorium glandulosum seeds in vitro and in vivo carbon tetrachloride-induced hepatotoxicity, J. Ethnopharmacol., 2015, 174, 355–363 CrossRef CAS PubMed.
- S. Zhang, P. Juan, Y. Wan and J. Liu, Comparative study of the liver injury induced with different medication times of cyclophosphamide in mice, J. Med. Sci., Yanbian Univ., 2009, 32, 22–25 CAS.
- E. Borenfreund, H. Babich and N. Martin-Alguacil, Comparisons of two in vitro cytotoxicity assays-The neutral red (NR) and tetrazolium MTT tests, Toxicol. In Vitro, 1988, 2, 1–6 CrossRef CAS PubMed.
- B. Romano, I. Fasolino, E. Pagano, R. Capasso, S. Pace, G. De Rosa, N. Milic, P. Orlando, A. A. Izzo and F. Borrelli, The chemopreventive action of bromelain, from pineapple stem (Ananas comosus L.), on colon carcinogenesis is related to antiproliferative and proapoptotic effects, Mol. Nutr. Food Res., 2014, 58, 457–465 CAS.
- D. Mascherpa, C. Carazzone, G. Marrubini, G. Gazzani and A. Papetti, Identification of phenolic constituents in Cichorium endivia var. crispum and var. latifolium salads by high-performance liquid chromatography with diode array detection and electrospray ioniziation tandem mass spectrometry, J. Agric. Food Chem., 2012, 60, 12142–12150 CrossRef CAS PubMed.
- C. Carazzone, D. Mascherpa, G. Gazzani and A. Papetti, Identification of phenolic constituents in red chicory salads (Cichorium intybus) by high-performance liquid chromatography with diode array detection and electrospray ionisation tandem mass spectrometry, Food Chem., 2013, 138, 1062–1071 CrossRef CAS PubMed.
- X. C. Yao, L. Zhu, Y. X. Chen, J. Tian and Y. W. Wang, In vivo and in vitro antioxidant activity and alpha-glucosidase, alpha-amylase inhibitory effects of flavonoids from Cichorium glandulosum seeds, Food Chem., 2013, 139, 59–66 CrossRef CAS PubMed.
- K. Hensley, K. A. Robinson, S. P. Gabbita, S. Salsman and R. A. Floyd, Reactive oxygen species, cell signaling, and cell injury, Free Radicals Biol. Med., 2000, 28, 1456–1462 CrossRef CAS PubMed.
- M. Z. Sakatis, M. J. Reese, A. W. Harrell, M. A. Taylor, I. A. Baines, L. Chen, J. C. Bloomer, E. Y. Yang, H. M. Ellens, J. L. Ambroso, C. A. Lovatt, A. D. Ayrton and S. E. Clarke, Preclinical strategy to reduce clinical hepatotoxicity using in vitro bioactivation data for >200 compounds, Chem. Res. Toxicol., 2012, 25, 2067–2082 CrossRef CAS PubMed.
- M. Zarei and T. Shivanandappa, Amelioration of cyclophosphamide-induced hepatotoxicity by the root extract of Decalepis hamiltonii in mice, Food Chem. Toxicol., 2013, 57, 179–184 CrossRef CAS PubMed.
- H. Upur, N. Amat, B. Blazekovic and A. Talip, Protective effect of Cichorium glandulosum root extract on carbon tetrachloride-induced and galactosamine-induced hepatotoxicity in mice, Food Chem. Toxicol., 2009, 47, 2022–2030 CrossRef CAS PubMed.
- W. J. Yang, Y. Q. Luo, H. A. Aisa, X. L. Xin, Z. Totahon, Y. Mao, M. Y. Hu, L. Xu and R. P. Zhang, Hepatoprotective activities of a sesquiterpene-rich fraction from the aerial part of Cichorium glandulosum, Chin. Med., 2012, 7, 21 CrossRef CAS PubMed.
- A. Moghe, S. Ghare, B. Lamoreau, M. Mohammad, S. Barve, C. McClain and S. Joshi-Barve, Molecular mechanisms of acrolein toxicity: relevance to human disease, Toxicol. Sci., 2015, 143, 242–255 CrossRef CAS PubMed.
- L. T. Beringer, S. Li, G. Gilmore, J. Lister and S. Averick, Synthesis of Reactive Polymers for Acrolein Capture Using AGET ATRP, Mol. Pharmaceutics, 2015, 12, 3776–3781 CrossRef CAS PubMed.
- J. P. Kehrer and S. S. Biswal, The molecular effects of acrolein, Toxicol. Sci., 2000, 57, 6–15 CrossRef CAS PubMed.
- E. Eder, C. Hoffman, S. Sporer and S. Scheckenbach, Biomonitoring studies and susceptibility markers for acrolein congeners and allylic and benzyl compounds, Environ. Health Perspect., 1993, 99, 245–247 CrossRef CAS PubMed.
- A. Pal, X. Hu, P. Zimniak and S. V. Singh, Catalytic efficiencies of allelic variants of human glutathione S-transferase Pi in the glutathione conjugation of alpha, beta-unsaturated aldehydes, Cancer Lett., 2000, 154, 39–43 CrossRef CAS PubMed.
- J. D. Adams and L. K. Klaidman, Acrolein-induced oxygen radical formation, Free Radicals Biol. Med., 1993, 15, 187–193 CrossRef CAS PubMed.
- M. Topal, H. Gocer, F. Topal, P. Kalin, L. P. Kose, I. Gulcin, K. C. Cakmak, M. Kucuk, L. Durmaz, A. C. Goren and S. H. Alwasel, Antioxidant, antiradical, and anticholinergic properties of cynarin purified from the Illyrian thistle (Onopordum illyricum L.), J. Enzyme Inhib. Med. Chem., 2016, 31, 266–275 CrossRef CAS PubMed.
- Z. Sun, J. Chen, J. Ma, Y. Jiang, M. Wang, G. Ren and F. Chen, Cynarin-rich sunflower (Helianthus annuus) sprouts possess both antiglycative and antioxidant activities, J. Agric. Food Chem., 2012, 60, 3260–3265 CrossRef CAS PubMed.
- J. D. Hayes and A. T. Dinkova-Kostova, The Nrf2 regulatory network provides an interface between redox and intermediary metabolism, Trends Biochem. Sci., 2014, 39, 199–218 CrossRef CAS PubMed.
- S. Doggui, A. Belkacemi, G. D. Paka, M. Perrotte, R. Pi and C. Ramassamy, Curcumin protects neuronal-like cells against acrolein by restoring Akt and redox signaling pathways, Mol. Nutr. Food Res., 2013, 57, 1660–1670 CAS.
- A. Kobayashi, M. I. Kang, H. Okawa, M. Ohtsuji, I. Zenke, T. Chiba, K. Igarashi and M. Yamamoto, Oxidative stress sensor Keap1 functions as an adaptor for Cul3-based E3 ligase to regulate proteasomal degradation of Nrf2, Mol. Cell. Biol., 2004, 24, 7130–7139 CrossRef CAS PubMed.
- M. C. Bufalo, I. Ferreira, G. Costa, V. Francisco, J. Liberal, M. T. Cruz, M. C. Lopes, M. T. Batista and J. M. Sforcin, Propolis and its constituent caffeic acid suppress LPS-stimulated pro-inflammatory response by blocking NF-kappaB and MAPK activation in macrophages, J. Ethnopharmacol., 2013, 149, 84–92 CrossRef CAS PubMed.
- N. Xia, A. Pautz, U. Wollscheid, G. Reifenberg, U. Forstermann and H. Li, Artichoke, cynarin and cyanidin downregulate the expression of inducible nitric oxide synthase in human coronary smooth muscle cells, Molecules, 2014, 19, 3654–3668 CrossRef PubMed.
- J. A. Cichocki, G. J. Smith and J. B. Morris, Tissue sensitivity of the rat upper and lower extrapulmonary airways to the inhaled electrophilic air pollutants diacetyl and acrolein, Toxicol. Sci., 2014, 142, 126–136 CrossRef CAS PubMed.
| This journal is © The Royal Society of Chemistry 2017 |

