 Open Access Article
Creative Commons Attribution 3.0 Unported Licence
Fast colorimetric screening for visible light photocatalytic oxidation and reduction reactions†
Michal
Poznik
and
Burkhard
König
 *
*
Institut für Organische Chemie, Universität Regensburg, Universitätsstraße 31, D-93053 Regensburg, Germany. E-mail: burkhard.koenig@ur.de; Fax: +49 941 943 1717; Tel: +49 941 943 4575
First published on 5th August 2016
Abstract
Fast screening accelerates the discovery and optimization of chemical reactions. Here, we present the parallel irradiation and evaluation of 96 visible light photocatalytic reactions in a microtiter plate. After completion, a chemical indicator is added, allowing the spectroscopic determination of the formed stoichiometric by-products. Their quantity correlates in many cases with the conversion of starting materials and yield of photochemical reaction products. We demonstrate the concept with known photooxidations of organic compounds by riboflavin tetraacetate (RFTA) and reproduce published results and gas chromatographic analyses by a colorimetric assay. Two new photocatalysts for the hydroxylation of boronic acids and new substrates for the photocatalytic generation of aryl radicals from aryl halides were identified. By screening a series of drug molecules containing aryl halides, new photochemical dehalogenation reactions were found. The presented methods enable laboratories lacking sophisticated high-throughput analytical instrumentation to perform parallel optimization and scope determination of photocatalytic oxidation and reduction reactions.
Introduction
The discovery of new reactions is of key importance in organic chemistry. For applications in synthesis, new transformations must be optimized and their scope and limitations defined. This typically requires the exhaustive systematic variation of many reaction parameters. Individual yield determination by product isolation or calibrated chromatographic methods, such as GC or HPLC, is laborious, slow and expensive. In recent years, organic chemists increasingly used advanced instrumentation and automatization to accelerate discovery and optimization steps1,2 leading to the development of various high-throughput screening methods.3,4 The scope of techniques ranges from multidimensional directed or undirected screens for reactivity discovery,5–7 over robustness8 and functional group tolerance9,10 assays to parallel reaction optimization protocols.11,12 These are usually performed in microvials or microfluidic systems.13,14 The bottleneck of such screening methods is typically the analysis of the reaction outcome, which often utilizes GC,15 HPLC16 and MS5,6,17 techniques. Even though the analysis based on chromatographic separation of all compounds present in the reaction mixture and their identification and database correlation allows the most accurate and detailed evaluation of an experiment, such an approach is not available to all laboratories due to lack of equipment. We therefore present here a low-cost colorimetric screening as an alternative for the initial assessment of photoredox catalytic reactions. Naturally, less accurate analysis will provide less detailed evaluation results, but this limitation may be compensated by faster and broader application in laboratories lacking high-end instrumentation.Visible light photocatalytic transformations have received a lot of attention in organic synthesis over the past decade.18–28 MacMillan showed with his approach of accelerated serendipity that by random high-throughput screening, new reactions can be discovered, and a mechanism-based screening method to accelerate discovery was recently reported by Glorius.29 A focused screening of radical photo-catalysed methylations by DiRocco demonstrated reactions in microtiter plates linked with UPLC-MS for the optimization of solvent and catalyst combination.30
An alternative screening procedure that does not require high-end instrumentation may be based on a colorimetric assay.31 It is easy to perform and evaluate. Numerous indicators were developed for the specific detection of functional groups,32–36 but this limits general applicability. However, many photoredox reactions need a sacrificial electron donor or acceptor to complete the catalytic cycle. During this process, a few typical by-products are formed. While the substrates and products of different reactions may vary in their properties and structure, the by-products often remain identical, e.g. reduced dioxygen species such as H2O2 and O2˙− or simply protons. Examples of reactivity screening using by-product analysis were reported before, but not applied recently or to photocatalytic reactions.37–40 We describe a simple colorimetric indicator method to detect and quantify by-products of 96 photocatalytic reactions simultaneously (Fig. 1). The by-product formation in these oxidation or dehalogenation reactions correlates in many cases with the reaction conversion and even with the product yield.
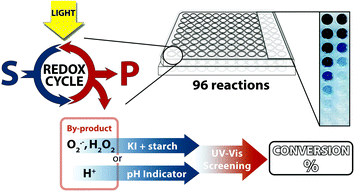 | ||
| Fig. 1 Parallel screening of visible light photocatalytic reactions generating oxidative by-products or protons. S = starting material; P = product. | ||
Results and discussion
Screening of photocatalytic oxidations
Air oxygen is a typical terminal oxidant in many photooxidation reactions generating hydrogen peroxide, superoxide anions or other reactive oxygen species. Mixtures of potassium iodide with starch give a strong blue colour when iodide is oxidized to iodine, which then forms a complex with amylose.41,42 Starch indicator was previously employed in screening methods, but usually as an indicator of produced iodine and not hydrogen peroxide (Fig. 2).35,43The reaction is very sensitive and can detect amounts of hydrogen peroxide as small as 50 μM when optimized for a microtiter plate reader (see the ESI,† Fig. S2). Using a UV plate reader allows a quantitative readout, but even with the naked eye, successful reactions are easily identified (Fig. 3). Fresh indicator was used for every measurement. In order for the indicator to work properly, the pH needs to be acidic and water is added in the detection step if the photoreactions are performed in organic solvents (see the ESI,† Fig. S4).
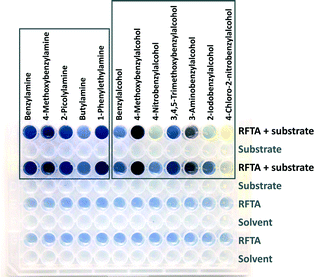 | ||
| Fig. 3 Picture of a microtiter plate experiment after irradiation and addition of iodine and starch as indicator. Blue color indicates the formation of peroxide. | ||
The well-described photooxidation of benzyl alcohols and benzylamines to benzaldehydes by riboflavin tetraacetate (RFTA) was used to evaluate the screening method (Fig. 4).45 The photooxidation produces equimolar amounts of hydrogen peroxide when converting substrates to products.46 For fast screening, the reaction mixtures were only irradiated for 15 min; initial conversions produce sufficient hydrogen peroxide for reliable detection and reaction conditions are more defined at low conversions facilitating a relative comparison.47‡ Three benzyl alcohols were oxidized to the corresponding benzaldehydes and the reaction mixtures from the microtiter plate were analysed by GC and simultaneously evaluated spectroscopically after indicator addition (Fig. 3). The product yield was estimated from the amount of released hydrogen peroxide determined using the KI–starch indicator by calibration. Both methods provided very similar results, showing that the amount of hydrogen peroxide reflects the product formation in this photooxidation. For the screening of different substrates, relative reactivities are more useful than absolute yields. Therefore, we normalized the obtained colorimetric response to the best converted substrate and correlated others by their relative reactivity. We expanded the scope of the screened benzyl alcohols. As expected from the literature,45 electron-rich derivatives react best. Using published reaction conditions for the oxidation of benzylamines in the microtiter plate assay gave relative reactivities, which reflect the reported yields of completed reactions very well.44 This shows that indicator response based on initial rates of reactions qualitatively correlates with isolated reaction yields for these photooxidations. Substrates that only serve as electron donors for flavin, but are not converted into aldehydes, such as butylamine, can give stronger or weaker false positive results.§ A critical evaluation of the produced data is essential as for most indirect screening methods.
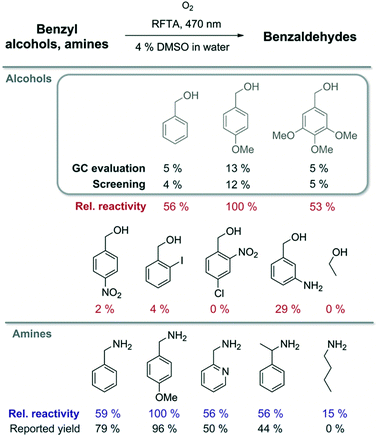 | ||
| Fig. 4 Solutions containing RFTA (1 mol%) and the respective substrates were irradiated for 15 min in a microtiter plate (in MilliQ water with 4% DMSO). Conversion was evaluated using a KI–starch indicator or by GC analysis. The relative reactivity of benzylamines was compared with reported product yields.44 | ||
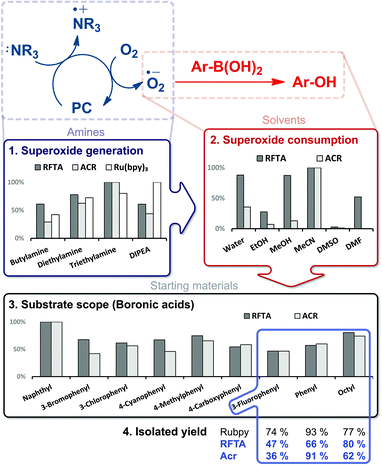
In the photocatalytic transformation of arylboronic acids to aryl alcohols introduced by Zou et al., a photocatalytically produced superoxide radical is consumed in the reaction (Fig. 5).48 Ruthenium-tris(bipyridine) (Ru(bpy)3) was initially used as a photocatalyst and later replaced by methylene blue, rose bengal, MOFs and flavin derivatives.49–55 The presence of reactive oxygen species in the mechanism inspired us to study this reaction in a screening approach with the goal of identifying other organic photocatalysts and further optimizing the reaction conditions (Fig. 5). We selected two catalysts with high oxidation potential: flavin RFTA and 9-mesityl-10-methylacridinium perchlorate (ACR). First, we investigated different aliphatic amines as sacrificial electron donors. Triethylamine was identified as the donor with the highest photocatalytic production of superoxide radical anions. In the presence of boronic acid, the generated oxidant is consumed. The quantified amount of the photogenerated oxidant in the presence and in the absence of the boronic acid therefore indicates the reaction conversion. This difference was recorded for 6 commonly used solvents; acetonitrile provided the best results. For comparison of a reaction in different solvents, the indicator response was normalized (see the ESI,† Table S1).¶ The identified best conditions were then used for larger-scale, batch reactions of three substrates giving comparable yields after 16 h of irradiation to the previously used ruthenium catalyst under reported conditions (Fig. 5).48
Screening of photocatalytic reductions
Aryl halides have been photocatalytically transformed into aryl radicals, which can abstract a hydrogen atom yielding the corresponding dehalogenated product. Other reaction pathways are C–H arylation or addition to double bonds (Fig. 6).57,58 An interesting approach for such transformation was reported using dimeric gold complexes.59 All reactions produce the corresponding acid H–X as a stoichiometric by-product.60 Although in many cases a base is used in excess to ensure high yields, pH changes may indicate the relative reactivity of different substrates or the best conditions.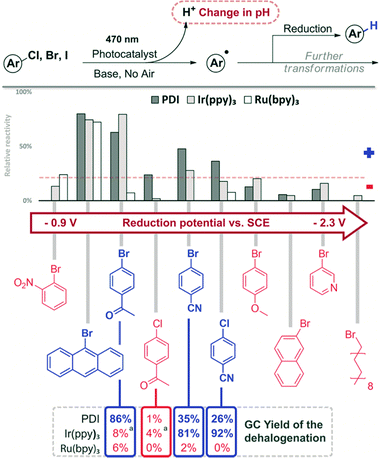 | ||
| Fig. 6 Screening results of the reduction of aryl halides. The compounds are given in the order of increasing reduction potential (V vs. SCE).56 Reaction conditions: 1 h, 470 nm, DMF, 1 mM substrate, 1 eq. DIPEA, 1 mol% catalyst. GC comparison for selected compounds: 12 h, 455 nm, DMF, 20 mM substrate, 10 eq. DIPEA, 1 mol% catalyst (10% for PDI). aFull conversion, but no yield of the reduction product. | ||
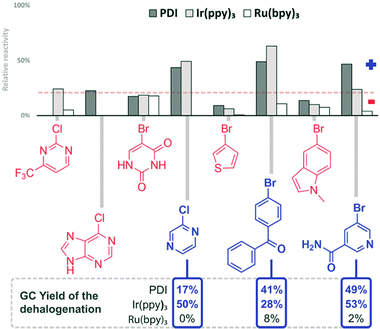
We recently reported the visible light photoreduction of aryl halides,60 using different perylene-3,4,9,10-bis(dicarboximide) (PDI) dyes as photocatalysts. The photocatalytic reaction of 4-bromoacetophenone with 1 eq. of DIPEA results in a slightly acidic reaction medium of approximately pH = 5. We therefore selected bromocresol green (BCG) as an appropriate indicator for this pH range. Reaction mixtures, in which photocatalytic dehalogenation proceeds, give a yellow colour after addition of BCG, while a blue colour is observed for non-successful reaction trials (see the ESI,† Fig. S14). We correlated the relative change in absorbance at the indicator λmax absorption (617 nm) with the relative reactivity of the aryl halides investigated. All reactions were performed in DMF with 1 eq. of DIPEA using PDI, Ir(ppy)3 and Ru(bpy)3 as photocatalysts under 470 nm irradiation (Fig. 6).61
In DMF solution, the aryl radical abstracts a proton from the solvent or the sacrificial electron donor DIPEA and the dehalogenation product is formed.62 Representative aryl halides were selected covering a wide range of reduction potentials to explore the substrate limits of the three photocatalysts.56 Compounds octadecyl bromide, 3-bromopyridine, 2-bromonaphthalene and 4-bromoanisole, which are very difficult to reduce, show only negligible colorimetric response (<10%). Their potentials are outside the available reduction potential of the investigated catalysts under the reaction conditions and no conversion can be expected. However, the compounds ranging from 9-bromoanthracene to 4-chlorobenzonitrile (Fig. 6) require reduction potentials matching the reducing power of the catalysts and produce a detectable colour change (>10%). No colour change is detected in the case of 2-bromonitrobenzene, even though it has a redox potential lower than −1 V vs. SCE; therefore, it should be reduced. Previous findings showed that 2-bromonitrobenzene is unable to produce the aryl radical, as the radical anion is very stable and back electron transfer is favoured.56 Conversion of 9-bromoanthracene to anthracene was monitored by UV-vis spectral changes (see the ESI,† Fig. S16). Selected reactions of the screening were repeated on a larger scale (10 eq. DIPEA, 455 nm) and the reaction outcome was monitored by GC. The yields of the dehalogenated products correlate well with the relative reactivity derived from the colorimetric screening. The quick assay reproduces the accessible substrate scope and limitation of the three catalysts for the photocatalytic reaction well. Next, a series of heteroaromatic halides were investigated for photocatalytic dehalogenation using the same procedure (Fig. 7). 2-Chloropyrazine, 2-bromobenzophenone and 5-bromonicotinamide in combination with PDI or Ir(ppy)3 showed moderate conversion in the assay (>10%), which was confirmed by GC, producing the corresponding dehalogenated compounds, although only in low to moderate yields (Fig. 8).
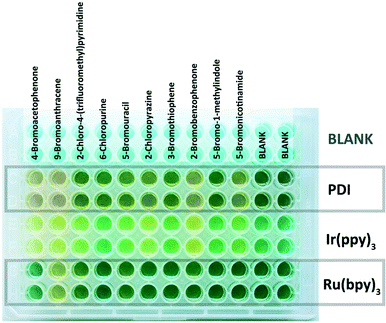 | ||
| Fig. 8 Picture of a microtiter plate experiment after irradiation and addition of BCG indicator. A yellow color indicates increased acidity and hence reaction conversion. | ||
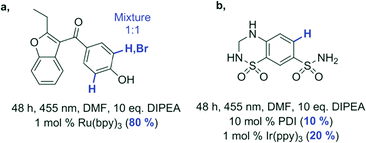
To test our reactivity screening method on more complex substrates, we selected fifteen commercially available drugs (structures available in the ESI†) bearing an aryl halide moiety (Table 1). The compounds were screened for photocatalytic dehalogenation using the described assay. For three compounds, the acidification of the reaction mixture indicated a possible reactivity, and these were investigated individually on a larger scale. The indication for bromazepam was found to be a false positive; the compound does not convert into the expected product. In the case of hydrochlorothiazide and benzbromarone, we were able to isolate the dehalogenation products in moderate to good yield (Table 1, bottom) applying any of the three tested catalysts. This shows that our method is useful for an initial reactivity screening of more complex molecules with different functional groups.
| PDI | Ir(ppy)3 | Ru(bpy)3 | |
|---|---|---|---|
| a Mixture of mono- and di-dehalogenated benzbromarone. b Dechlorinated hydrochlorothiazide. c Fragmentation of the substrate. d No significant reaction. | |||
| Ambroxol-HCl | - | - | - |
| Amlodipine besylate | - | - | - |
| Atorvastatin-Ca | - | - | - |
| Benzbromarone | - | •c | •a |
| Bromazepam | •d | - | - |
| Chlordiazepoxide | - | - | - |
| Diazepam | - | - | - |
| Glibenclamide | - | - | - |
| Griseofulvin | - | - | - |
| Hydrochlorothiazide | •b | •b | - |
| Meclofenoxate-HCl | - | - | - |
| Metoclopramide | - | - | - |
| Miconazole | - | - | - |
| Norfloxacin | - | - | - |
| Oxazepam | - | - | - |
|
|||
Screening of photocatalyst stability
Crucial for all catalytic reactions is the stability of the catalyst. The photostability of the photocatalysts under the reaction conditions is essential to achieve good overall performance of the reaction. We investigated therefore the potential bleaching of several typical photocatalysts under different reaction conditions. The dyes were tested in different solvents with addition of a base (NaOH) or an acid (CF3COOH) in air and in nitrogen atmosphere (Table 2, exact values see the ESI,† Table S3). The summarized stability results may serve as a starting point for the selection of the appropriate photocatalyst under the given reaction conditions. ), 80–60% (
 ), 60–0% (
 )
)
Conclusions
We have described and validated a simple high-throughput reactivity screening for photocatalytic reactions based on the colorimetric detection of by-products. Reactive oxygen species and pH changes were semi-quantitatively detected to monitor the reaction conversion of photooxidations and photodehalogenations. Using flavin photooxidations of benzyl alcohols and benzylamines as an example, the relative reactivities derived from the indicator response very well reflect the reported product yields for the respective substrate. For the photooxidative conversion of boronic acids into phenols, we identified two new photocatalysts by screening. As an example for photoreduction reactions, a colorimetric screening for aryl halide dehalogenation was developed, and the indicator results were confirmed by GC for several substrates including more complex drug molecules. The reported method may find use for facile initial screening of photocatalytic reactions and be a helpful tool in exploring reactivity or optimization without the need for sophisticated instrumentation. Using the described approach for by-product detection by an indicator enables laboratories with limited analytical capacities to perform rapid parallel screening based on UV measurements or visual inspection, which may accelerate the discovery and application of new photocatalytic transformation in synthesis.Notes and references
- S. V. Ley, D. E. Fitzpatrick, R. J. Ingham and R. M. Myers, Angew. Chem., Int. Ed., 2015, 54, 3449–3464 CrossRef CAS PubMed.
- J. G. Houston and M. Banks, Curr. Opin. Biotechnol., 1997, 8, 734–740 CrossRef CAS PubMed.
- K. D. Collins, T. Gensch and F. Glorius, Nat. Chem., 2014, 6, 859–871 CrossRef CAS PubMed.
- C. Houben and A. A. Lapkin, Curr. Opin. Chem. Eng., 2015, 9, 1–7 CrossRef.
- D. W. Robbins and J. F. Hartwig, Science, 2011, 333, 1423–1427 CrossRef CAS PubMed.
- A. Buitrago Santanilla, E. L. Regalado, T. Pereira, M. Shevlin, K. Bateman, L.-C. Campeau, J. Schneeweis, S. Berritt, Z.-C. Shi, P. Nantermet, Y. Liu, R. Helmy, C. J. Welch, P. Vachal, I. W. Davies, T. Cernak and S. D. Dreher, Science, 2015, 347, 49–53 CrossRef CAS PubMed.
- K. Ding, H. Du, Y. Yuan and J. Long, Chem. – Eur. J., 2004, 10, 2872–2884 CrossRef CAS PubMed.
- K. D. Collins and F. Glorius, Nat. Chem., 2013, 5, 597–601 CrossRef CAS PubMed.
- P. S. Kutchukian, J. F. Dropinski, K. D. Dykstra, B. Li, D. A. DiRocco, E. C. Streckfuss, L.-C. Campeau, T. Cernak, P. Vachal, I. W. Davies, S. W. Krska and S. D. Dreher, Chem. Sci., 2016, 7, 2604–2613 RSC.
- K. D. Collins and F. Glorius, Acc. Chem. Res., 2015, 48, 619–627 CrossRef CAS PubMed.
- S. M. Preshlock, B. Ghaffari, P. E. Maligres, S. W. Krska, R. E. Maleczka and M. R. Smith, J. Am. Chem. Soc., 2013, 135, 7572–7582 CrossRef CAS PubMed.
- A. Bellomo, N. Celebi-Olcum, X. Bu, N. Rivera, R. T. Ruck, C. J. Welch, K. N. Houk and S. D. Dreher, Angew. Chem., Int. Ed., 2012, 51, 6912–6915 CrossRef CAS PubMed.
- T. Rodrigues, P. Schneider and G. Schneider, Angew. Chem., Int. Ed., 2014, 53, 5750–5758 CrossRef CAS PubMed.
- J. W. Tucker, Y. Zhang, T. F. Jamison and C. R. J. Stephenson, Angew. Chem., Int. Ed., 2012, 51, 4144–4147 CrossRef CAS PubMed.
- O. Trapp, J. Chromatogr. A, 2008, 1184, 160–190 CrossRef CAS PubMed.
- C. Cai, J. Y. L. Chung, J. C. McWilliams, Y. Sun, C. S. Shultz and M. Palucki, Org. Process Res. Dev., 2007, 11, 328–335 CrossRef CAS.
- V. I. Martin, J. R. Goodell, O. J. Ingham, J. A. Porco and A. B. Beeler, J. Org. Chem., 2014, 79, 3838–3846 CrossRef CAS PubMed.
- Chemical Photocatalysis, ed. B. König, De Gruyter, Göttingen, 2013 Search PubMed.
- T. P. Yoon, M. A. Ischay and J. Du, Nat. Chem., 2010, 2, 527–532 CrossRef CAS PubMed.
- D. M. Schultz and T. P. Yoon, Science, 2014, 343, 985 CrossRef CAS PubMed.
- A. Ibhadon and P. Fitzpatrick, Catalysts, 2013, 3, 189 CrossRef CAS.
- A. A. Adesina, Catal. Surv. Asia, 2004, 8, 265–273 CrossRef CAS.
- C. H. Langford, Catalysts, 2012, 2, 327 CrossRef CAS.
- J. M. R. Narayanam and C. R. J. Stephenson, Chem. Soc. Rev., 2011, 40, 102–113 RSC.
- L. Shi and W. Xia, Chem. Soc. Rev., 2012, 41, 7687–7697 RSC.
- J. Xuan and W.-J. Xiao, Angew. Chem., Int. Ed., 2012, 51, 6828–6838 CrossRef CAS PubMed.
- K. Teegardin, J. I. Day, J. Chan and J. Weaver, Org. Process Res. Dev, 2016, 20, 1156–1163 CrossRef CAS.
- X. Lang, X. Chen and J. Zhao, Chem. Soc. Rev., 2014, 43, 473–486 RSC.
- M. N. Hopkinson, A. Gómez-Suárez, M. Teders, B. Sahoo and F. Glorius, Angew. Chem., Int. Ed., 2016, 55, 4361–4366 CrossRef CAS PubMed.
- D. A. DiRocco, K. Dykstra, S. Krska, P. Vachal, D. V. Conway and M. Tudge, Angew. Chem., Int. Ed., 2014, 53, 4802–4806 CrossRef CAS PubMed.
- K. L. Bicker, S. L. Wiskur and J. J. Lavigne, in Chemosensors, John Wiley & Sons, Inc., 2011, ch. 14, pp. 275–295, DOI:10.1002/9781118019580.
- O. Lavastre and J. P. Morken, Angew. Chem., Int. Ed., 1999, 38, 3163–3165 CrossRef CAS.
- O. Löber, M. Kawatsura and J. F. Hartwig, J. Am. Chem. Soc., 2001, 123, 4366–4367 CrossRef.
- M. Kawatsura and J. F. Hartwig, Organometallics, 2001, 20, 1960–1964 CrossRef CAS.
- S. Kim, E. Jung, M. J. Kim, A. Pyo, T. Palani, M. S. Eom, M. S. Han and S. Lee, Chem. Commun., 2012, 48, 8751–8753 RSC.
- M. S. Eom, J. Noh, H.-S. Kim, S. Yoo, M. S. Han and S. Lee, Org. Lett, 2016, 18, 1720–1723 CrossRef CAS PubMed.
- G. T. Copeland and S. J. Miller, J. Am. Chem. Soc., 1999, 121, 4306–4307 CrossRef CAS.
- E. R. Jarvo, C. A. Evans, G. T. Copeland and S. J. Miller, J. Organomet. Chem., 2001, 66, 5522–5527 CAS.
- C. A. Evans and S. J. Miller, Curr. Opin. Chem. Biol, 2002, 6, 333–338 CrossRef CAS PubMed.
- M. B. Onaran and C. T. Seto, J. Org. Chem., 2003, 68, 8136–8141 CrossRef CAS PubMed.
- G. Schmitz, Phys. Chem. Chem. Phys., 2001, 3, 4741–4746 RSC.
- R. E. Rundle, J. F. Foster and R. R. Baldwin, J. Am. Chem. Soc., 1944, 66, 2116–2120 CrossRef CAS.
- S. Kurtovic, R. Jansson and B. Mannervik, Arch. Biochem. Biophys, 2007, 464, 284–287 CrossRef CAS PubMed.
- R. Lechner and B. König, Synthesis, 2010, 2010, 1712–1718 CrossRef.
- H. Schmaderer, P. Hilgers, R. Lechner and B. König, Adv. Synth. Catal., 2009, 351, 163–174 CrossRef CAS.
- U. Megerle, M. Wenninger, R.-J. Kutta, R. Lechner, B. Konig, B. Dick and E. Riedle, Phys. Chem. Chem. Phys., 2011, 13, 8869–8880 RSC.
- R. A. Y. Jones, Physical and Mechanistic Organic Chemistry (Cambridge Texts in Chemistry and Biochemistry), Cambridge University Press, 1979 Search PubMed.
- Y.-Q. Zou, J.-R. Chen, X.-P. Liu, L.-Q. Lu, R. L. Davis, K. A. Jørgensen and W.-J. Xiao, Angew. Chem., 2012, 124, 808–812 CrossRef.
- S. P. Pitre, C. D. McTiernan, H. Ismaili and J. C. Scaiano, J. Am. Chem. Soc., 2013, 135, 13286–13289 CrossRef CAS PubMed.
- H. Kotoucova, I. Strnadova, M. Kovandova, J. Chudoba, H. Dvorakova and R. Cibulka, Org. Biomol. Chem, 2014, 12, 2137–2142 CAS.
- J. Luo, X. Zhang and J. Zhang, ACS Catal., 2015, 5, 2250–2254 CrossRef CAS.
- A. Paul, D. Chatterjee, Rajkamal, T. Halder, S. Banerjee and S. Yadav, Tetrahedron Lett, 2015, 56, 2496–2499 CrossRef CAS.
- I. G. T. M. Penders, Z. Amara, R. Horvath, K. Rossen, M. Poliakoff and M. W. George, RSC Adv, 2015, 5, 6501–6504 RSC.
- X. Yu and S. M. Cohen, Chem. Commun., 2015, 51, 9880–9883 RSC.
- T. Toyao, N. Ueno, K. Miyahara, Y. Matsui, T.-H. Kim, Y. Horiuchi, H. Ikeda and M. Matsuoka, Chem. Commun., 2015, 51, 16103–16106 RSC.
- C. Costentin, M. Robert and J.-M. Savéant, J. Am. Chem. Soc., 2004, 126, 16051–16057 CrossRef CAS PubMed.
- Y. Cheng, X. Gu and P. Li, Org. Lett, 2013, 15, 2664–2667 CrossRef CAS PubMed.
- H. Kim and C. Lee, Angew. Chem., 2012, 124, 12469–12472 CrossRef.
- G. Revol, T. McCallum, M. Morin, F. Gagosz and L. Barriault, Angew. Chem., 2013, 125, 13584–13587 CrossRef.
- I. Ghosh, T. Ghosh, J. I. Bardagi and B. König, Science, 2014, 346, 725–728 CrossRef CAS PubMed.
- C. K. Prier, D. A. Rankic and D. W. C. MacMillan, Chem. Rev., 2013, 113, 5322–5363 CrossRef CAS PubMed.
- M. Majek, F. Filace and A. Jacobi von Wangelin, Chem. – Eur. J., 2015, 21, 4518–4522 CrossRef CAS PubMed.
Footnotes |
| † Electronic supplementary information (ESI) available: Detailed experimental procedures, reactor set-up, experimental analytical procedures, and video showing the application of the method. See DOI: 10.1039/c6re00117c |
| ‡ The initial rate of conversion of a reaction is often used to derive data for relative comparison. |
| § All amines as electron-rich nucleophiles are oxidized by flavin releasing reactive oxygen species. |
| ¶ Big differences between slopes of calibration curves can cause changes in standard deviation for each solvent. |
| This journal is © The Royal Society of Chemistry 2016 |


