 Open Access Article
Creative Commons Attribution 3.0 Unported Licence
Decay kinetics of sensitive bioinorganic species in a SuperFocus mixer at ambient conditions†
Daniela
Schurr
*a,
Florian
Strassl
b,
Patricia
Liebhäuser
b,
Günter
Rinke
a,
Roland
Dittmeyer
a and
Sonja
Herres-Pawlis
 *b
*b
aInstitute for Micro Process Engineering, Karlsruhe Institute of Technology, Hermann-von-Helmholtz-Platz 1, 76344 Eggenstein-Leopoldshafen, Germany. E-mail: daniela.schurr@kit.edu; Fax: +49 721 608 23186; Tel: +49 721 608 22839
bInstitut für Anorganische Chemie, RWTH Aachen University, Landoltweg 1, 52074 Aachen, Germany. E-mail: sonja.herres-pawlis@ac.rwth-aachen.de; Fax: +49 241 8092074; Tel: +49 241 8093902
First published on 5th August 2016
Abstract
We performed studies on the oxygenation of a copper(I) complex targeting the intrinsic kinetics of this reaction in a continuous flow setup. It is an example reaction for the metal-based activation of dioxygen. For these experiments we used a SuperFocus mixer, a customised micro mixer with fast mixing behaviour. By means of this setup, we were able for the first time to detect the formation and decay of a thermally very sensitive bis(μ-oxo)dicopper species at ambient temperature. Comparing these data to results from a stopped-flow setup we could confirm the performance of the SuperFocus mixer setup. The rate constant for the decay of the bis(μ-oxo)dicopper species was determined to be 0.90 s−1 using the SuperFocus mixer and to be 1.57 s−1 by stopped-flow at slightly different temperatures.
Introduction
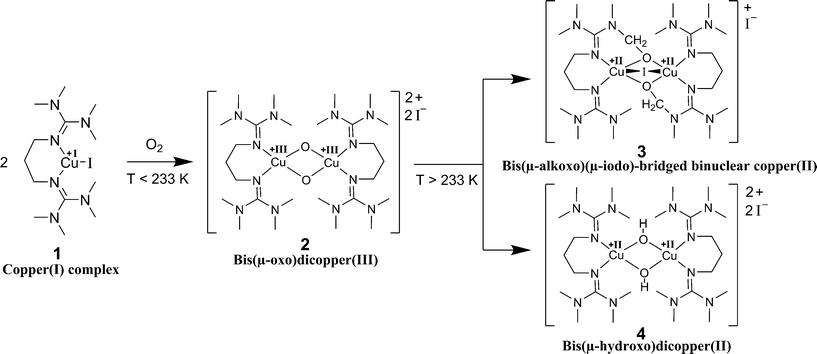
Metal-complex based activation of dioxygen is an important reaction in many industrial processes.1 One prominent example is the Wacker reaction where copper chloride mediates the back-oxidation of the palladium catalyst using dioxygen.1 Better understanding reaction-enhanced mass transfer between gaseous reagents and liquid phases containing other reagents and catalysts could allow such reactions to be run more efficiently.2,3 Copper-mediated oxygen activation is highly relevant not only to industry but also to biochemistry. Organisms have used copper-containing enzymes, such as tyrosinase, for millions of years.4 In tyrosinase enzymes, two copper ions activate the dioxygen provided by air. This allows the mild and selective oxygenation of organic substrates that result in the formation of skin pigments and the ripening of fruits and vegetables. Specifically, tyrosinases catalyse the ortho-hydroxylation of monophenols and the oxidation of catechols to ortho-quinones.4–6 A bioinorganic model example for the protein tyrosinase is provided by the reaction of copper(I) complexes stabilised by bis(guanidine) ligands with dioxygen.7 It was shown that bis(guanidine) ligands are strong N-donors and stabilise high metal oxidation states.8,9 Bis(guanidine) ligands represent a ligand class which is intensively investigated for use in biomimetic coordination chemistry.10,11 Libraries of ligands with different attributes have been synthesised and studied.12,13 In this study, we focus on a specific copper(I) bis(guanidine) system. Bis(tetramethylguanidino)propylene (btmgp) was synthesised and subsequently complexed with Cu(I) to form the complex [Cu(btmgp)I] as an O2 activating model system.14 Biomimetic copper–dioxygen chemistry has led to various applications in synthetic chemistry.15–17 The underlying mechanism of the reaction of [Cu(btmgp)I] with dioxygen is well known for very low temperatures.17 Two Cu(I) complexes and dioxygen form a bis(μ-oxo)dicopper(III) species (Scheme 1). Afterwards the bis(μ-oxo)dicopper(III) 2 reacts concomitantly to the bis(μ-hydroxo)dicopper(II) complex 4 and the bis(μ-alkoxo)(μ-iodo)-bridged binuclear copper(II) complex 3 in equal amounts.18 The decay of the Cu(III) complex can be expressed as a first order reaction with respect to the Cu(III) complex, whose maximum concentration is dependent on the initial copper(I) complex concentration.7The reaction kinetics have already been studied with UV/vis at low temperatures.7 The oxygenated form of Cu(III) complex is stable only at temperatures below 195 K.7 In the range of 195 K to 233 K the decay is very slow. However, the reaction at room temperature generally occurs within several seconds. For determining the reaction kinetics in this short time period a setup with a fast and close to ideal mixing of the Cu(I) complex and dioxygen and in situ spectroscopy is required.
The detailed characterisation of reactions affected by mass transport presents a significant challenge. At room temperature, this reaction proceeds very fast and may be influenced by mass transfer. Hence, it is a suitable example reaction. In order to quantify the influence of mass transfer processes on chemical reactions, it is necessary to know the intrinsic reaction kinetics. Time and again, reactions that are supposed to be kinetically simple turn out to have highly complex reaction networks. Additionally, regarding fast reactions as presented above, it is hard to spatially and temporally separate the mixing from the reaction. Thus, diffusion processes of the species involved in the reaction obscure the intrinsic kinetics. The clarification of the kinetics of the oxygenation of Cu(I) complexes by dioxygen has industrial relevance and represents a suitable model reaction to study the mass transfer of dioxygen. To tackle the challenges described above, microstructured mixing devices, well-known for their fast mixing capabilities, appear to be a suitable tool. In micro process engineering passive mixers are most common, since they provide a simple setup, good mixing behaviour, and they are robust.19–23 For experimental studies the device should be resistant towards the test fluids and it should be suitable for the application of local analysis techniques. Systems made of silicon-glass composites are one possibility. The microstructures are exactly etched into the silicon, and the glass provides optical access.20–24 Due to the predominant laminar flow regimes in microstructured devices the mixing process is mainly controlled by molecular diffusion. Thus, increasing the contact surface between the fluids and decreasing the diffusional path will result in a more effective mixing process.21,24
For our experiments we used a continuous flow setup and compared the results to those obtained with our own stopped-flow setup. Thus, in terms of ideal reactor concepts the first one is comparable to a continuous process with steady state flow and the latter one to a batch process. By means of the continuous flow setup, we used a mixer design according to the SuperFocus mixer (SFM), initially developed at the “Institut für Mikrotechnik Mainz GmbH” by Hessel and coworkers.25,26 The concept is shown in Fig. 1. The contacting of the fluids to be mixed is realised by multiple microchannels which provide an alternating arrangement of the two fluids. Consequently, a high surface area in-between the two fluids is achieved. It is followed by a focusing zone where the diffusional length is reduced gradually by reducing the width of the lamellae of the fluids. In comparison to other micromixers, the SuperFocus mixer is characterised by a large focusing ratio of a to b, respectively the ratio of the widths of the arc at the feed channels to the width at the beginning of the rectangular mixing channel. c is the distance between the arc of the feed channels and the beginning of the rectangular mixing chamber.25,26
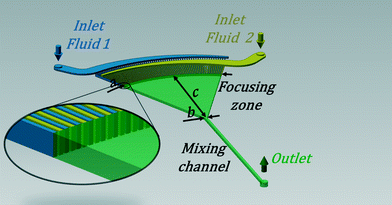 | ||
| Fig. 1 Schematic drawing of the SFM according to Hessel and coworkers;25,26 with its characteristic dimensions a, b and c. | ||
Hessel et al. predicted a mixing time of 10 ms for a similar mixer geometry and flow rates like the ones used in this study.25 The mixing time is defined as the time until no more significant concentration gradients of solutions in the liquid can be monitored.25
Such a SFM was used in this study and this is the first time that a sensitive bioinorganic species has been investigated in continuous flow. The special advantages of the SuperFocus mixer lie in its flexibility towards the observation method (e.g. Raman spectroscopy, fluorescence spectroscopy), the mobility of the small-dimensional setup and the well-defined flow regime as well as mixing characteristics.
The results obtained in the continuous flow setup are compared to the results obtained with a stopped-flow setup. In the stopped-flow apparatus the two fluids are fed into the measurement cell via a micromixer and then stopped immediately in the measuring cell. The reaction takes place, after several time steps the concentration is measured and afterwards the product leaves the cell.
In our stopped-flow setup, the mixing time is given by the manufacturer to be 2 ms. For the reaction studied here, this is not critical since the decay as reaction of first order is not mixing dependent.18,19
Experimental part
2.1 Materials and methods
All reagents were obtained from commercial suppliers and used as purchased. Acetonitrile was refluxed over CaH2 and distilled under nitrogen for purification. The solvent was then transferred into an inert-gas glovebox for solution preparation.2.2 Synthesis of the complex
The ligand btmgp as well as the complex [Cu(btmgp)I] were prepared according to procedures described previously.14,18,27–29 Solutions of the copper(I) complexes in acetonitrile were prepared in the glovebox and transferred into gas-tight Hamilton syringes. The dioxygen needed for the synthesis of the copper(III) complexes was provided by a dioxygen saturated acetonitrile solution. The dioxygen solution was obtained by bubbling dry dioxygen gas (O2 99.994%) for about 15 minutes through the solvent against ambient pressure. The resulting solution has an oxygen concentration of 8.1 × 10⁻³ mol L−1.302.3 Stopped-flow setup
The stopped-flow measurements were performed with a HI-TECH Scientific SF-61SX2 device. 0.2 mL of the two solutions {(a) MeCN solution with varying concentrations of [Cu(btmgp)I] and (b) MeCN solution of oxygen at a concentration of 8.1 × 10⁻³ mol L−1} are fed by two syringe pumps through the detection cell via an efficient micromixer placed very close upstream the flow cell. The transfer time from the mixer into the detection cell sets a lower limit to the reaction time observable with the system. In the present case this has been specified by the manufacturer as 2 ms. Note that this assumes a perfectly mixed state of the solution immediately after the micromixer. The initially steady flow is then stopped by a third syringe pump at the outlet of the detection cell which acts against the flow. From then on the concentration of the detectable species in the detection cell is monitored as a function of time by UV/vis spectroscopy with a diode array (spectra measurements) and a photomultiplier (kinetics at one wavelength) detector. The path length for transmission of the quartz glass cuvette was 10 mm. The fastest scan rate was 667 spectra per second in a wavelength range of 250 nm to 480 nm. The analyses were carried out with the TgK Scientific program Kinetic Studio 4.0.8.18533.2.4 Continuous flow and SFM setup
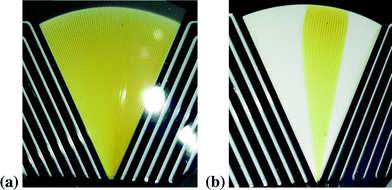
The SFM is the main part of the continuous flow setup. It was manufactured at the TUHH, Institut für Mikrosystemtechnik and Institut für Mehrphasenströmungen, according to the design described in the introduction. The structure of the mixer is etched anisotropic into a silicon wafer using the deep reactive ion etching process. Glass plates of 0.5 mm thickness are anodic bonded to the bottom and the top of the silicon wafer. The design of the mixer is shown in Fig. 2(a). The two fluids enter continuously via two curved fluidic inlets. Each of them is split into 64 feed channels. The focusing zone has a length c of 22 mm and a ratio a/b of 38; see notations in Fig. 1. For the experiment we used two different designs of the mixing channel, shown in Fig. 2(a). Both of them have a cross section of 0.5 mm × 0.5 mm. However, one has a total length of 200 mm (i), the other one a total length of 60 mm (ii). After the mixing length the progress of the reaction can be monitored along the channel in order to determine the kinetics. By calculating the velocity of the liquid flow the spatial coordinate is converted into a time scale. Viz., the residence time is calculated by dividing the traversed volume, focusing zone and mixing channel up to the measurement point, by the total flow rate.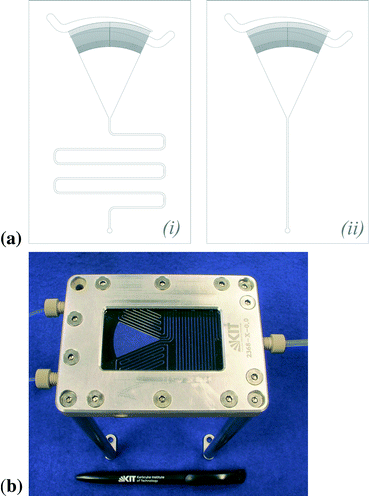 | ||
| Fig. 2 (a) Design of the SFM with a total length of the mixing channel of (i) 200 mm, respectively (ii) 60 mm and (b) support of the SFM. | ||
We constructed a support for the mixer. It is shown in Fig. 2(b). Syringes with a volume of 100 mL are fixed to the mixer via 1/8′′ FEP capillaries and Luer connectors. One of the syringes is filled with an oxygen saturated solution of acetonitrile. The other one contains the copper(I) complex dissolved in acetonitrile with a concentration of 2 × 10⁻³ mol L−1 to 10 × 10−3 mol L−1. Since this complex is sensitive to oxygen, it has to be filled under inert atmosphere. The adjusted total flow rates were set between 0.4 mL min−1 and 52 mL min−1 (corresponding to a residence time between 130 ms and 17 s at a distance of 22.5 mm from the outlet of the focusing zone) for the shorter mixing channel (ii), respectively 0.4 mL min−1 and 34 mL min−1 (corresponding to a residence time between 260 ms and 22 s at a distance of 157 mm from the outlet of the focusing zone) for the longer one (i). The maximum flow rate is limited by the pressure resistance of the cover glass of the focusing zone. The pressure in the mixing channel results from the pressure drop, which is mainly caused by the mixing channel. The temperature was measured at the outlet of the mixer and determined to be 295 K.
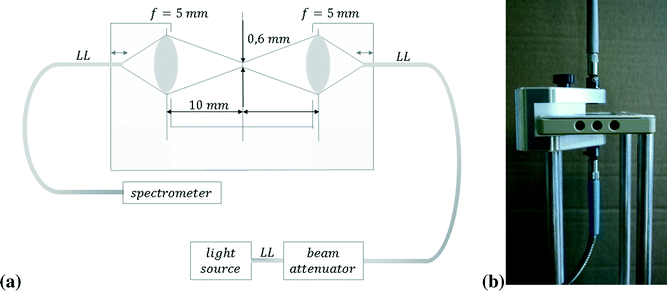
For the concentration measurements an in situ analysis technique based on UV/vis spectroscopy was developed. A schematic description is shown in Fig. 3(a). As light source we used a combined halogen and deuterium lamp. The beam attenuator together with the current regulation of the halogen lamp enables the adjustment of the light intensity in a way to have the highest possible intensity in the region of interest without overloading the detector of the spectrometer. In contrast to conventional UV/vis setups we did not use a wide parallel beam for the measurements, but focused the light into the mixing channel on a spot of 0.6 mm diameter using biconvex lenses with a short focal lengths of 5 mm. This is important to get a high light throughput and good signal to noise ratio. Furthermore, it must be avoided that a large light beam transverses several neighbouring microchannels. We constructed a special holder shown in Fig. 3(b). It was designed to fix the lenses and to adapt the fibers (LL) in the right distance from the lenses. Thus, the light was focused directly into the mixing channel. The optical pathlength is determined by the channel depth of 0.5 mm. The beam was placed at a distance of 22.5 mm in the short mixing channel, respectively 157 mm in the longer one, from the end of the focusing zone.
2.5 Fitting procedure
According to the reaction mechanism, the concentration of the Cu(III) complex should pass through a maximum. The height of the maximum at the time tmax is dependent on the ratio of the rate constants of the formation and the decay, whereby the formation is much faster than the decay (see ESI,† Fig. S1 and S2). The formation is stopped after the time t* > tmax, as soon as any Cu(I) complex is consumed. From t > t* the decrease in the Cu(III) concentration is only dependent on its decay.Practically, except for very short residence times, this maximum cannot be detected with our setup. Additionally, the formation of the Cu(III) complex is a very fast process. Thus, it is assumed to be mass transfer limited, consequently dependent on the different experimental setups. Therefore, only the decay of the Cu(III) complex for t > t* is fitted to a kinetics of first order with the rate constant k. Thus the formation of the copper(III) species at low residence times is excluded from the fitting procedure. Furthermore, for high residence times, the stationary state cannot be modelled by the exponential equation. For a linear dependency of the concentration c on the absorbance Abs, the following correlation is valid:
Abs (t) = A′![[thin space (1/6-em)]](https://www.rsc.org/images/entities/char_2009.gif) exp{−kt} + B′. exp{−kt} + B′. | (1) |
A systematic derivation of this equation is shown in the ESI.† In this fitting equation B′ is the time-invariant value of the absorbance at 395 nm for a long residence time, viz. the absorbance of copper(II) complex. A′ is the absorbance of the Cu(III) complex at time t*. The logarithmic plot of the experimental data (Abs − B′) versus time results in a straight line with negative slope. This slope corresponds to the rate constant of the decay. However, B′ has to be determined graphically based on the experimental data for long residence times and the rate constant is very sensitive to little discrepancies of B′. To minimize the uncertainty by a manual determination of B′, we preferred a mathematical fit to eqn (1) based on a nonlinear least squares method using the curve fitting tool of MATLAB®.
Additionally, we used the computer program Kinetic Studio by TgK Kinetics to determine the rate constant of the decay k and the parameters B′ and A′. The results of the two different methods agree very well.
Results
3.1 Measurements using the SFM
The formation of the Cu(III) complex is very fast at ambient temperature and was not observed until now in a SuperFocus mixer. Due to the optical access to the mixing zone we could see that the Cu(III) complex was formed directly after contacting, respectively at the outlet of the feed channels. In Fig. 4(a) the characteristic orange color of the Cu(III) complex formed in the focusing zone is shown.This also provides an opportunity to check visually the flow quality. First experiments in the SFM showed that gas bubbles in the two curved fluid inlets easily block the entrance to the small feed channels for the liquids. In that case, the mixer is not working well and allows an optical control, see Fig. 4(b). The blocking was removed by countercurrent purging.
Initial experiments were done in the SFM of type (i). The point of measurement was always set to the same position at 157 mm in the mixing channel. By varying the flow rates we were able to change the residence time. The measured spectra are shown in Fig. 5.
 | ||
| Fig. 5 UV/vis spectra obtained in the SFM (i) when varying the flow rate with an average initial concentration of 2.5 × 10⁻³ mol L−1 at 295 K. | ||
With increasing flow rate the maximum absorbance at 395 nm is increasing. A plot of the absorbance at 395 nm of the obtained spectra at different flow rates against the corresponding residence time, see Fig. 6, demonstrates that the absorbance for the Cu(III) complex decreases with time. Thus, we observe the decay to the Cu(II) complex for t > tmax. Regarding the straight logarithmic plot of the absorbance against the residence time in Fig. 7, an exponential decay can be confirmed and the decay constant is determined to be 0.87 s−1 for an initial averaged concentration of 2.5 × 10⁻³ mol L−1 of the Cu(I) in the focusing zone.
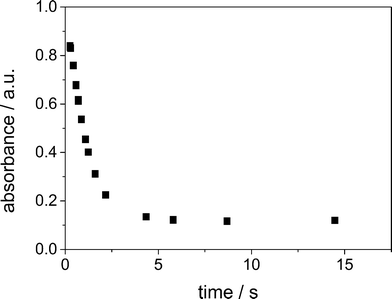 | ||
| Fig. 6 Absorbance at 395 nm against residence time in the SFM (i) with an average initial concentration of 2.5 × 10⁻³ mol L−1 at 295 K. | ||
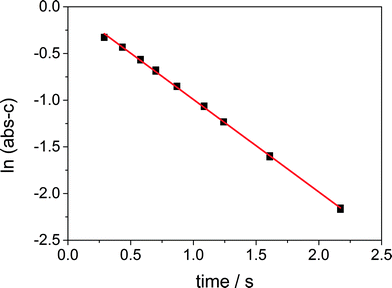 | ||
| Fig. 7 Logarithmic plot of the decay in the SFM (i) with an average initial concentration of 2.5 × 10⁻³ mol L−1 at 295 K, ln(Abs − B′) = −0.87 t, R2 = 0.9989. | ||
At each set point of the flow rate at least three spectra were recorded. The relative standard deviation for the absorbance at 395 nm was determined to be 0.64%. Furthermore, the reliability of the experiments was checked by repeating the experiments. The experiment with an initial concentration of 2.5 × 10⁻³ mol L−1 was done twice in the SFM of type (i). We changed the quality of the solvent, by distilling it before doing the experiments. A comparison of the results is shown in Fig. 8. Since we could observe good agreement of the results, a possible influence of the solvent quality on the results was ruled out.
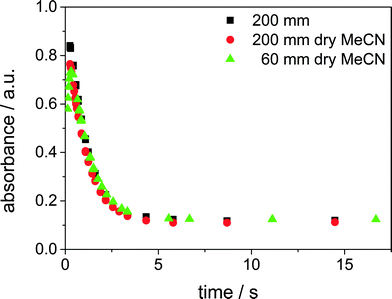 | ||
| Fig. 8 Reproducibility: comparison of the quality of the solvent and experiments in mixer type (i) and (ii), average initial concentration of 2.5 × 10⁻³ mol L−1 at 295 K. | ||
Additionally, the experiment was repeated in the SFM of type (ii). Due to the shorter channel, the pressure loss is reduced and a higher volume flow rate could be set than in the SFM of type (i). As a result, the reaction could be observed at residence times starting at 130 ms. Fig. 8 demonstrates that it was possible to detect the end of the formation of the Cu(III) complex, since a maximum of the absorbance is shown (green dots in Fig. 8). However, the maximum concentration of the Cu(III) complex detected is lower than in the longer mixing channel. This may result from the temporal resolution of the measurement, which is determined by the distance of the flow rate set points. As the maximum is very narrow, the exact time tmax was not hit by one of the adjusted flow rates. The rate constant of decay is well reproducible in the two different mixer types.
We varied the concentration from 1 × 10⁻³ mol L−1 to 5 × 10⁻³ mol L−1. The resulting decay constants are shown in Table 1. The initial concentration of the Cu(I) complex does not affect the rate constant of the decay rate of the Cu(III) complex. The average rate constant of the decay was determined to be 0.90 s−1.
3.2 Stopped-flow measurements
To review the results on the kinetics obtained with the SFM and to investigate the reaction further, stopped-flow measurements were carried out with the same chemical system. In Fig. 9 the spectrum of the bis(μ-oxo)dicopper(III) complex at 0.1 s after mixing the copper(I) complex and the dioxygen solutions at room temperature is shown.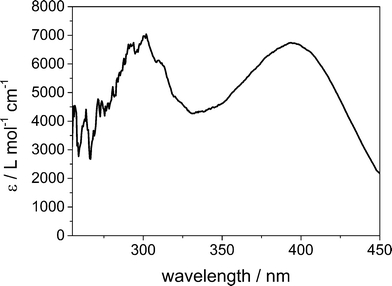 | ||
| Fig. 9 Spectrum of bis(μ-oxo)dicopper(III) at 293 K after full formation. The distinct peaks are at 300 nm and 395 nm. Initial copper(I) complex concentration of 1.5 × 10⁻⁴ mol L−1. | ||
The signals originating from the bis(μ-oxo)dicopper(III) species are observed at the wavelengths 300 nm and 395 nm. For these studies, only the maximum of the absorption at 395 nm was used. The initial concentrations of the copper(I) complexes in the mixture in the stopped-flow experiments were in a range of 0.5 × 10⁻⁴ mol L−1 to 3.0 × 10⁻⁴ mol L−1. Lower concentrations did not show a signal high enough to be analysed as a distinct wavelength maximum. Higher concentrations showed an absorbance above 2.0 which is outside the Lambert–Beer range. Lower concentrations compared to the SFM experiments were used due to the longer path length in the UV sample chamber (part 2.4).
First of all, the formation of the bis(μ-oxo)dicopper(III) species at room temperature was observed. Fig. 10 shows the increase of the signal at 395 nm. The time until the full amount of bis(μ-oxo)dicopper(III) complex was formed, was only around 100 ms.
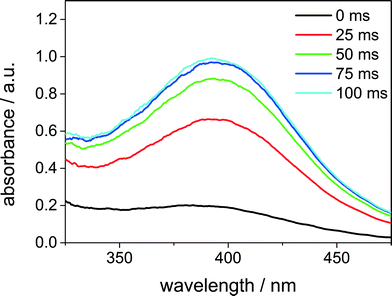 | ||
| Fig. 10 Formation of the bis(μ-oxo)dicopper(III) complex, measured with the stopped-flow setup. The peak has a maximum at 395 nm. Initial copper(I) complex concentration 3 × 10⁻⁴ mol L−1. | ||
Next, the decay of the bis(μ-oxo)dicopper(III) species through formation of the bis(μ-hydroxo)dicopper(II) complex (Scheme 1) was analysed at different initial copper(I) complex concentrations.
Table 2 shows that for all cases the rate constant is around 1.25 s−1. These results confirm that the rate constant of the decay is not dependent on the initial concentration of the Cu(I).
Following the experiments with different concentrations, measurements at different reaction temperatures were carried out. The stopped-flow setup is equipped with a cryostat; hence the temperature could be tuned to the desired value and kept stable on that level. In Fig. S3 (ESI†) the decay at room temperature (293 K) and at 283 K is shown. It is observed that the time period for the decay is cut by one half through a temperature difference of 10 K. The same trend is followed in the temperature range of 273 K to 253 K (Fig. S4, ESI†). From a decay time of 1 s at 293 K, the reaction time slows down to 450 s at a temperature of 253 K.
In Table 3 the reaction rate constants are listed for the different temperatures. Entry 1 shows that the decay at 233 K has a rate constant of 0.0004 s−1. This is 25 times slower than the rate constant at 253 K, which indicates that the temperature is low enough to finally provide a stable bis(μ-oxo)dicopper(III) species. For 295 K, the temperature at which the SFM was operated, a rate constant of 1.57 s−1 could be determined.
| Entry | Temperature (K) | Rate constant (s−1) |
|---|---|---|
| 1* | 233 | 0.0004 ± 3.0 × 10⁻⁵ |
| 2 | 253 | 0.01 ± 3.5 × 10⁻⁵ |
| 3 | 263 | 0.05 ± 3.9 × 10⁻⁴ |
| 4 | 273 | 0.14 ± 0.002 |
| 5 | 283 | 0.46 ± 0.003 |
| 6 | 293 | 1.27 ± 0.03 |
| 7 | 295 | 1.57 ± 0.01 |
Discussion
Bis(μ-oxo)dicopper species are thermally sensitive and difficult to handle and therefore usually investigated at very low temperature. We have now demonstrated that they can be detected at room temperature in a SuperFocus mixer. The temporal resolution derived from the spatial resolution of the absorbance measurements in the SFM setup is sufficient to detect this bioinorganic species and to monitor its decay. The rate constant of the decay has been determined to be app. 0.90 s−1 at 295 K, whereby the results are reproducible and the rate constant determined within the two different mixer designs is in good agreement.With the stopped-flow setup the rate constant of the decay was elicited to 1.57 s−1 at 295 K and to 1.27 s−1 at 293 K. Thus, the value for the rate constant deviates by the maximum factor of 1.7. However, the studies with the stopped-flow device showed a very strong dependency of the decay constant on temperature. 2 K temperature difference do change the rate constant by 20%. In the stopped-flow setup, the temperature was well adjusted by the cryostat and kept isothermal within the flow cell as well as throughout the measuring time. The simple SFM setup was not thermostatically controlled, but chemicals as well as setup were maintained at the same lab with defined room temperature of 295 K. The temperature was determined by measuring the temperature of the fluid at the outlet of the SFM.
Until now the mixing characteristics of the SFM have not been studied in detail. The UV/vis setup of the SFM is integrating over the depth and the width of the channel. As a result, locally non-uniform concentration profiles that may occur within the mixing channel are not taken into account. However, mixing effects, e.g. diffusion limitation, are not supposed to influence the rate constant of the decay due to the fact that the decay is a unimolecular reaction.
The applied stopped-flow setup allows faster mixing, assumed that the two solutions are perfectly mixed after the dead time of 2 ms in the mixer before entering into the flow cell, than our SFM setup. Hence, the formation of the bis(μ-oxo) species could be monitored as well. Moreover, the rate constant of the decay could be determined more exactly, viz. with smaller confidence bounds. Taking into account the experimental effort of a SFM vs. a stopped-flow setup, the advantages of the SFM become clear: the SFM is a mobile and robust apparatus which can be transported in a backpack and needs only 50 cm of benchspace whereas the stopped-flow setup needs 4 m of bench space and can hardly be moved. Moreover, the SFM needs an investment of 15![[thin space (1/6-em)]](https://www.rsc.org/images/entities/char_2009.gif) 000€ which is only one sixth of the investment costs of the stopped-flow setup. Generally, the continuous flow method is capable to measure very fast reactions, too. However, this often requires a high throughput and therefore high consumption of chemicals31 or mixing under high pressure,32 our SFM design is not capable to deal with. Next steps concern the measurement of lateral concentration profiles within the mixing channel and the focusing zone of the SFM and using a SFM with integrated heating channels to enable measuring at different temperatures.
000€ which is only one sixth of the investment costs of the stopped-flow setup. Generally, the continuous flow method is capable to measure very fast reactions, too. However, this often requires a high throughput and therefore high consumption of chemicals31 or mixing under high pressure,32 our SFM design is not capable to deal with. Next steps concern the measurement of lateral concentration profiles within the mixing channel and the focusing zone of the SFM and using a SFM with integrated heating channels to enable measuring at different temperatures.
Conclusion
This study shows that thermally sensitive bioinorganic species can be monitored by means of a SuperFocus mixer at room temperature. The rate constants of decay are in the range of those derived with the stopped-flow method. This result paves the way to more kinetic studies on dioxygen activation using continuous flow micromixers like for example the SFM applied in this work.Symbols
| A′ | [a. u.] | Absorbance of the Cu(III) complex at time t* |
| Abs | [a. u.] | Absorbance |
| B′ | [a. u.] | Time-invariant value of the absorbance at 395 nm for a long residence time |
| c | [mol L−1] | Concentration |
| k | [s−1] | Rate constant |
| t | [s] | Residence time |
| t* | [s] | Time until the formation of the Cu(III) complex is completed |
| t max | [s] | Time of the maximum concentration of the Cu(III) complex |
| MeCN | Acetonitrile | |
| SFM | SuperFocus mixer | |
Acknowledgements
The authors gratefully acknowledge funding by Deutsche Forschungsgemeinschaft (DFG) in the frame of the Priority Program 1740 ‘The Influence of Local Transport Processes on Chemical Reactions in Bubble Flows’ (grant numbers Ri 2512/1-1 and HE5480/10-1).References
- B. Meunier and W. Adam, Metal-Oxo and Metal-Peroxo Species in Catalytic Oxidations, ed. B. Meunier, Springer-Verlag, Berlin, Heidelberg, New York, 2000 Search PubMed.
- N. G. Deen, R. F. Mudde, J. A. M. Kuipers, P. Zehner and M. Kraume, Bubble Columns, Ullmann's Encyclopedia of Industrial Chemistry, Wiley-VCH Verlag GmbH & Co. KGaA, Weinheim, 2012, DOI:10.1002/14356007.b04_275.pub2.
- V. Pangarkar and M. Sharma, Chem. Eng. Sci, 1974, 2, 561–569, DOI:10.1016/0009-2509(74)80067-9.
- Y. Matoba, T. Kumagai, A. Yamamoto, H. Yoshitsu and M. Sugiyama, J. Biol. Chem., 2006, 281, 8981–8990, DOI:10.1074/jbc.M509785200.
- E. I. Solomon, D. E. Heppner, E. M. Johnston, J. W. Ginsbach, J. Cirera, M. Qayyum, M. T. Kieber-Emmons, C. H. Kjaergaard, R. G. Hadt and L. Tian, Chem. Rev., 2014, 114, 3659–3853, DOI:10.1021/cr400327t.
- C. Citek, C. T. Lyons, E. C. Wasinger and T. D. P. Stack, Nat. Chem, 2012, 4, 317–322, DOI:10.1038/nchem.1284.
- S. Herres-Pawlis, U. Flörke and G. Henkel, Eur. J. Inorg. Chem, 2005, 2005, 3815–3824, DOI:10.1002/ejic.200400822.
- J. Stanek, T. Rösener, A. Metz, J. Mannsperger, A. Hoffmann and S. Herres-Pawlis, Top. Heterocycl. Chem., 2015, 2 Search PubMed.
- S. Herres-Pawlis, S. Binder, A. Eich, R. Haase, B. Schulz, G. Wellenreuther, G. Henkel, M. Rübhausen and W. Meyer-Klaucke, Chem. – Eur. J., 2009, 15, 8678–8682, DOI:10.1002/chem.200901092.
- P. J. Bailey and S. Pace, Coord. Chem. Rev., 2001, 214, 91–141, DOI:10.1016/S0010-8545(00)00389-1.
- S. H. Oakley, M. P. Coles and P. B. Hitchcock, Inorg. Chem, 2004, 43, 7564–7566, DOI:10.1021/ic0495416.
- S. Herres-Pawlis, A. Neuba, O. Seewald, T. Seshadri, H. Egold, U. Flörke and G. Henkel, Eur. J. Org. Chem, 2005, 2005, 4879–4890, DOI:10.1002/ejoc.200500340.
- C. Wilfer, P. Liebhäuser, A. Hoffmann, H. Erdmann, O. Grossmann, L. Runtsch, E. Paffenholz, R. Schepper, R. Dick, M. Bauer, M. Dürr, I. Ivanović-Burmazović and S. Herres-Pawlis, Chem. – Eur. J., 2015, 21, 17639–17649, DOI:10.1002/chem.201501685.
- S. Pohl, M. Harmjanz, J. Schneider, W. Saak and G. Henkel, Inorg. Chim. Acta, 2000, 311, 106–112, DOI:10.1016/S0020-1693(00)00310-8.
- E. A. Lewis and W. B. Tolman, Chem. Rev., 2004, 104, 1047–1076, DOI:10.1021/cr020633r.
- L. Que Jr. and W. B. Tolman, Angew. Chem., Int. Ed., 2002, 41, 1114–1137, DOI:10.1002/1521-3773(20020402)41:7<1114::AID-ANIE1114>3.0.CO;2-6.
- S. Herres-Pawlis, R. Haase, P. Verma, A. Hoffmann, P. Kang and T. D. P. Stack, Eur. J. Inorg. Chem, 2015, 2015, 5426–5436, DOI:10.1002/ejic.201500884.
- S. Herres, A. J. Heuwing, U. Flörke, J. Schneider and G. Henkel, Inorg. Chim. Acta, 2005, 358, 1089–1095, DOI:10.1016/j.ica.2004.10.009.
- V. Hessel, A. Renken, J. C. Schouten and J. Yoshida, Micro Process Engineering: A Comprehensive Handbook, ed. V. Hessel, Wiley-VCH, Weinheim, 2009 Search PubMed.
- N. Kockmann, Transport phenomena in micro process engineering, Springer Berlin Heidelberg, Berlin, Heidelberg, 2008 Search PubMed.
- N.-T. Nguyen and Z. Wu, J. Micromech. Microeng, 2005, 15, R1–R16, DOI:10.1088/0960-1317/15/2/R01.
- N.-T. Nguyen, Micromixers: Fundamentals, Design and Fabrication, Elsevier, Amsterdam, 2nd edn, 2012 Search PubMed.
- M. Hoffmann, M. Schlüter and N. Räbiger, Chem. Eng. Sci, 2006, 61, 2968–2976, DOI:10.1016/j.ces.2005.11.029.
- J. Aubin, M. Ferrando and V. Jiricny, Chem. Eng. Sci, 2010, 65, 2065–2093, DOI:10.1016/j.ces.2009.12.001.
- V. Hessel, S. Hardt, H. Lowe and F. Schönfeld, AIChE J, 2003, 49, 566–577, DOI:10.1002/aic.690490304.
- V. Hessel, H. Löwe, A. Müller and G. Kolb, Chemical Micro Process Engineering, Wiley-VCH, Weinheim, 2005 Search PubMed.
- S. Herres-Pawlis, S. Binder, A. Eich, R. Haase, B. Schulz, G. Wellenreuther, G. Henkel, M. Rübhausen and W. Meyer-Klaucke, Chem. – Eur. J., 2009, 15, 8678–8682, DOI:10.1002/chem.200901092.
- S. Herres-Pawlis, G. Berth, V. Wiedemeier, L. Schmidt, A. Zrenner and H.-J. Warnecke, J. Lumin, 2010, 130, 1958–1962, DOI:10.1016/j.jlumin.2010.05.012.
- S. Pohl, M. Harmjanz, J. Schneider, W. Saak and G. Henkel, J. Chem. Soc., Dalton Trans, 2000, 3473–3479, 10.1039/B002554M.
- J. M. Archord and C. L. Hussey, Anal. Chem, 1980, 52, 601–602, DOI:10.1021/ac50053a061.
- A. Kölbl, M. Kraut and K. Schubert, Chem. Eng. J., 2010, 130, 865–872 CrossRef.
- S. I. Masca, I. R. Rodriguez-Mendieta, C. T. Friel, S. E. Radford and D. A. Smith, Rev. Sci. Instrum., 2006, 77, 055105, DOI:10.1063/1.2198800.
Footnote |
| † Electronic supplementary information (ESI) available. See DOI: 10.1039/c6re00119j |
| This journal is © The Royal Society of Chemistry 2016 |

