Investigation of free radicals and carbon structures in chars generated from pyrolysis of antibiotic fermentation residue

Chen Hongab, Zhiqiang Wanga, Yi Xing*ac, Yifei Lia, Qiang Yanga, Mengmeng Jiaa and Lihui Fenga
aSchool of Energy and Environmental Engineering, University of Science and Technology Beijing, Beijing 100083, China. E-mail: xingyi@ustb.edu.cn; Tel: +86 010 62332206
bResearch Center for Eco-Environmental Sciences, Chinese Academy Science, Beijing 100085, China
cBeijing Key Laboratory of Resource-oriented Treatment of Industrial Pollutants, University of Science and Technology Beijing, Beijing 100083, China

Received 5th September 2016 , Accepted 10th November 2016

First published on 11th November 2016


Abstract

The effect of pyrolysis on the chemical characteristics of Antibiotic Fermentation Residue (AFR) was studied in this paper. Electron Spin Resonance (ESR) spectrometry, X-ray photoelectron spectroscopy (XPS) and solid state 13C nuclear magnetic resonance (13C NMR) spectroscopy were applied to investigate the variation of free radicals and carbon structures. Results indicated that the free radical concentration (Ng) of AFR/chars changed dramatically during the pyrolysis process, first increasing and then decreasing. Ng reached 1.24 × 10¹⁹ spins per g in a N2 atmosphere and 1.11 × 10¹⁹ spins per g in a CO2 atmosphere at 320 °C. The g-values monotonically decreased, demonstrating that the chemical structures of free radicals changed during pyrolysis. Bond cleavage in methoxyl groups, aliphatic C–O bonds, aliphatic C–C bonds and C[double bond, length as m-dash]O groups was enhanced with increasing pyrolysis temperature. These carbon structures converted to aromatic C–O bonds and aromatic C–C bonds through polymerization and condensation reactions. Compared with the CO2 atmosphere, the N2 atmosphere was more conducive to the production of free radicals and aromatization of carbon structures in chars during pyrolysis process.

1. Introduction

China is one of the largest producers of antibiotics in the world. 80% of cephalosporin antibiotics, 75% of penicillin industrial salt and 90% of streptomycin antibiotics are produced in China. As a kind of organic solid waste produced from the antibiotic ferment process, antibiotic fermentation residue (AFR) is mainly composed by mycelia, remaining substrate, intermediate metabolite and residual antibiotic,1 and rich in lipid, polysaccharide and protein.2 The residual antibiotic in AFR can easily accumulate in animals and human beings. Therefore AFR is identified as hazardous waste (HW02 Toxicity) on the China Hazardous Waste List.

Pyrolysis and incineration are effective ways for the treatment and resource recovery of biomass.3–5 Jiang et al.6 investigated the pyrolysis and incineration characteristics by thermogravimetric analysis (TGA), and indicated that AFR addition would not affect the incineration system significantly. Du et al.7,8 studied the thermal behavior and reaction characteristics of AFR mixed with coal and found interactions between AFR and coal in pyrolysis.

Intense free radicals reaction are happened during the pyrolysis process of biomass or fossil fuel, which could have significant effect on the types and quantities of pyrolysis products.9 Plenty of free radicals are created along with the homolytic cleavage of covalent bonds, and then formed new chemical bonds by combining with each other.10–13 These two conversions occur sequentially and concurrently, and the products may undergo further pyrolysis to yield additional radical fragments, resulting in more coupling reactions.14 However, it is found that the lifetime of radicals varies greatly and could be as short as nanoseconds, which is too short to be detected.14,15 Therefore, the radicals detected are only those with a long lifetime due to their poor mobility or inaccessibility by steric hindrance.16,17 Liu et al.18 studied the variation of free radicals during coal pyrolysis, and the results indicated that free radicals concentration increased with increasing of temperature. Wang et al.19 pyrolyzed oil shale and characterized the properties of free radicals. The free radicals concentration in the products, such as semicoke, thermal bitumen and shale oil, greatly increased after pyrolysis. And g-values and linewidths of the products were also affected by temperature. He et al.16 pyrolysed walnut shell and corncob, and found that bio-tars also contained large amounts of radicals. The characteristics variation of free radicals revealed that the carbon structures of biomass changed during the pyrolysis process.20–22 Qiao et al.20 pyrolyzed chitin biomass and found that almost all the hydrocarbon functional groups vanished and converted into aromatic functional groups. Ben et al.23 examined the carbon structures of kraft lignin and pine wood in slow pyrolysis process. The bonds breaking of aliphatic carbon function groups were enhanced and plenty of polyaromatic hydrocarbons with high molecular weight formed.

Although many works focused on the chemical characteristics of fossil fuels and biomass in pyrolysis process, less attention were paid to that of AFR, especially in free radicals and carbon structure characteristics change. In this study, Electron Spin Resonance (ESR) spectrometer was applied to investigate the free radicals characteristics of AFR, such as radicals concentration, g-value and linewidth. The X-ray photoelectron spectroscopy (XPS) and solid state 13C nuclear magnetic resonance (13C NMR) spectroscopy were employed to understand the carbon structures changes in AFR pyrolysis process. The pyrolysis experiments were carried out in two kinds of inert atmosphere (N2 and CO2 atmosphere), and the relationships between free radicals, carbon functional groups and temperature were evaluated.

2. Materials and methods

2.1. Sample preparation

The antibiotic fermentation residue (AFR) used in this study was produced from production process of terramycin. 50 g of AFR was dried in electricity heat drum wind drying oven (DGH-9023A, Pinggang, China) at 105 °C for 5 hours. The AFR sample was then grounded to fine particle, and its equivalent mean particle size was 46.68 μm analyzed by Malvern Laser Mastersizer (Mastersizer 3000, U.K.). The proximate and ultimate analysis of AFR were shown in Table 1.
Table 1 The proximate and ultimate analysis of AFR
Proximate analysis (wt%) Ultimate analysis (wt%)
Moisture 2.57 C 44.54
Volatile 64.82 H 4.76
Ash 12.16 O 26.91
Fixed carbon 20.45 N 8.42
    S 0.64


2.2. Pyrolysis tests

The pyrolysis experiment was carried out in a tube furnace pyrolysis reactor (OTF-1200X-S50-SL, KJ Group, China) under the inert atmosphere of N2 and CO2, with a flow rate of 1000 mL min−1. About 5 g AFR were heated from room temperature (25 °C) to 160, 320, 480 and 600 °C at the heating rate of 10 °C min−1. After holding at the target temperature for 30 min, the reactor was cooled to room temperature at a cooling rate of 5 °C min−1, and the chars were obtained to characterize their free radicals and carbon structures.

2.3. Electron Spin Resonance (ESR) spectrometer

The ESR was applied to investigated the free radicals characteristics of AFR samples and chars. The ESR experiments were carried out with a JES-FA 200 spectrometer (JEOL, Japan). ESR scan parameters during all the experiments were as follows: modulation frequency, 100 kHz, X-band; modulation amplitude, 100 Hz; microwave frequency, about 9070 MHz; microwave power, 0.0997 mW; central magnetic field, 324.254 mT; sweep width, 10 mT; time constant, 0.1 s and sweep time, 1 min. All observations were accomplished at room temperature (25 °C) and atmospheric pressure. 1,1-Diphenyl-2-picrylhydrazyl (DPPH) was used as standard sample to calculate the radical concentration in AFR and chars.16 And g-value and linewidth were extracted through the ESR analysis by JEOL computer software CW-ESR.

The free radicals concentration (Ng, spins per g) in samples were calculated by the developed standard curve of DPPH. The amount of free radicals in DPPH (Rg) with a certain quality was obtained by the following equation:

 
image file: c6ra22192k-t1.tif(1)
where m(DPPH) is the mass of the mixture of DPPH and anhydrite calcium sulfate, g; ω(DPPH) is the percentage of DPPH, wt%; M(DPPH) is the molecular mass of DPPH (394.32 g mol−1). The ESR spectra of DPPH samples are shown in Fig. S1. The relationship of Ng(DPPH) versus S(DPPH) (area of ESR spectra curve) based on numerical analysis is given by the following:
 
S(DPPH) = 1834.05R(DPPH) × 10−15 − 400.01 (2)

The Ng in samples can be calculated by eqn (3). S(sample) is the area of the sample absorption curve; m(sample) is the mass of mixture of sample.

 
image file: c6ra22192k-t2.tif(3)

2.4. X-ray photoelectron spectroscopy (XPS)

The XPS experiments were carried out with an AXIS ULTRA DLD system (Kratos, Japan). C 1s spectra were measured with the following scan parameters: source of X-ray, monochromatic Al Kα (150 W, = 1486.6 eV); pass energy, 20 eV; analysis area, 800 × 800 μm; resolution, 0.05 eV.

2.5. Solid state 13C nuclear magnetic resonance (13C NMR) spectroscopy

The solid state 13C NMR was employed to understand the carbon structures of AFR sample and chars. All the experiments were performed in a 13C solid state CP/MAS/TOSS NMR spectrometer (Advance 400 MHz, Bruker, Germany) with a frequency of 100.63 MHz and rotor spun of 5 kHz. The contact time and pulse repetition delay of 13C-1H CP were 1 ms and 4 s respectively.

3. Results and discussion

3.1. The variation of free radicals characteristics during pyrolysis process

3.1.1 ESR spectra analysis and free radicals concentration changes. The ESR spectra of AFR during pyrolysis process were shown in Fig. 1. It was observed that all of the spectra were symmetrical curves without hyperfine structure. The peak intensities, wave linewidths and locations of ESR spectra during pyrolysis process changed significantly both in N2 and CO2 atmosphere, which indicated that pyrolysis temperature affected the formation, distribution and species of free radicals dramatically. The covalent bonds in AFR broke when thermochemical reaction happened during pyrolysis process, leading to the formation and coupling of free radicals. These results were consistent with Wang et al.,19 who also observed significant changes of ESR spectra in oil shale pyrolysis.
image file: c6ra22192k-f1.tif
Fig. 1 The ESR spectra of AFR during pyrolysis process. (a) N2 atmosphere, (b) CO2 atmosphere.

The changes in the free radical concentration (Ng) during AFR pyrolysis are shown in Fig. 2. Dramatic changes of Ng were observed during pyrolysis process. A moderate increasing of free radicals were obtained over the range 25–160 °C. Desorption of moisture and release of light gases took place in this temperature range. Cleavage of chemical bonds, which characterizes the decomposition of organic matter in the AFR, was at its starting stage, with only a trace amount of free radicals being produced. When the AFR samples were heated to 320 °C, Ng increased sharply. A significant proportion of organic components were decomposed. The weak bonds in these components such as hydroxyl, carbonyl, alkyl, ether, amino and some side chain groups were ruptured.20,24 A large amount of active free radicals formed in chars with the releasing of gaseous species including CO, CO2, NOx, HCN, NH3 and hydrocarbon gases.20 In the subsequent bonding process, a portion of active free radicals vanished due to condensation reaction among themselves, and others were reserved through hydrogen extraction or combining with stable fragments in the solid residues. As a result, plenty of stable free radicals formed. Ng of the stable free radicals at 320 °C reached 1.24 × 10¹⁹ spins per g in N2 atmosphere and 1.11 × 10¹⁹ spins per g in CO2 atmosphere. The free radicals in the AFR reduced dramatically in the range 320–600 °C. The carbonization degree of AFR improved significantly with the forming of multi-ring aromatic compounds during aromatization reaction. Meanwhile, the coupling of unpaired electrons were taken place in the reaction, and Ng decreased. As a result, the free radicals dropped to a lower level in concentration, about 4 × 10¹⁸ spins per g (both in N2 and CO2 atmosphere) at 600 °C.


image file: c6ra22192k-f2.tif
Fig. 2 Variation of Ng with AFR pyrolysis temperature.

Basically, Ng of AFR in N2 atmosphere were larger than in CO2 atmosphere during pyrolysis process. Probably because large amounts of CO2 was adsorbed on chars and involved in cross-linking reactions, reduced the particle swelling and inhibited the volatile release.25 On the other hand, N2 had lower thermal capacities and higher mass diffusivities compared to CO2. More thermal energy could be exerted on the AFR particles in the N2 atmosphere.26 Therefore more organic components were thermal decomposed with the releasing of volatile matter. Bonds cracking were susceptible to occur in N2 atmosphere,18,19 forming more free radicals in the chars.

3.1.2 Analysis of g-value. The g-value reflects the interaction between spin motion and orbital motion of electrons in paramagnetic center. The g-value is determined by the chemical environments of unpaired electrons, and has been used to characterize interior-molecular structures. Base on the different g-values, the radicals could be classified as σ-type oxygen-containing radicals (2.0008–2.0014), graphite radicals (2.0015–2.0025), π radicals on aliphatic hydrocarbons (2.0025–2.0026), π radicals on aromatic hydrocarbons (2.0025–2.00291), π-type oxygen-containing radicals (2.0035–2.00469), nitrogen-containing radicals (2.0031) and sulfur-containing radicals (2.0080–2.0081).27 The g-values of AFR and chars during pyrolysis in different atmosphere (N2 and CO2) were shown in Fig. 3.
image file: c6ra22192k-f3.tif
Fig. 3 Variation of the g-values with AFR pyrolysis temperature.

The g-values revealed the superposition of various free radicals types. The g-value of AFR sample was 2.00339 at 25 °C, implying that most of the free radicals might be π radicals on aliphatic/aromatic hydrocarbons, π-type oxygen-containing radicals and nitrogen-containing radicals considering the chemical component in AFR (Table 1).19,28 Meanwhile, some unpaired electrons with spins are localized on heteroatom sites, such as S (0.64% in the sample mass), which had strong spin–orbit coupling.29 This could be another reason for AFR sample to reach a high g-value. With the increasing of temperature, the g-value decreased monotonically. The decrease in the g-value was minor below 160 °C. There were slight bonds cracking in AFR with the desorption of combined water and light gases. Few changes of free radicals content and species were taken place. As a result, the g-values of chars were similar to original sample at 160 °C. When AFR samples were heated up to 600 °C, g-values of chars decreased sharply. On the one hand, the quantities of certain atoms such as O, N, S decreased with the releasing of volatile matter, resulting in the decrease of π-type oxygen-containing radicals, nitrogen-containing radicals and sulfur-containing radicals. On the other hand, with the increase of pyrolysis temperature, the aromatization of chars became more significant, and more simple aromatic and even multi-ring aromatic structures were formed. Large multi-ring aromatic components increased until a structure resembling graphite is approached, as reported by Petrakis.27 The formation of these graphite-like radicals were considered to be another reason for the decrease of g-values in chars.

The species of free radicals showed similar variation trends both in N2 atmosphere and CO2 atmosphere. This was because that the pyrolysis reactivity in N2 atmosphere was similar to CO2 atmosphere at low temperatures (lower than 700 °C).30–32 When the pyrolysis temperature was higher than 320 °C, the g-values in N2 atmosphere were smaller than in CO2 atmosphere. One possible reason was that the reactions of bonds cleavage were more active in N2 atmosphere than CO2 atmosphere. The deoxygenation and dehydrogenation mechanisms on chars were obviously exhibited, and the reactions in N2 were more pronounced than in CO2.33 Thus, more oxygen-containing components and hydrocarbon components decomposed, resulting in a lower g-value in N2 atmosphere.

3.1.3 Analysis of linewidth. The linewidth reflects the relaxation time of spinning electrons, which is used to measure the interactions between unpaired electrons and their chemical environment. The variation of linewidths during AFR pyrolysis process were shown in Fig. 4. All the linewidths fell in the range of 0.5–0.8 mT, in the same order of magnitude as the results of Wang et al.19 obtained from pyrolysis of oil shale. When the AFR was heated from 25 °C up to 480 °C, the linewidths increased monotonically in the N2 and CO2 atmosphere. The condensation reaction in the remaining solid became intensified with the releasing of volatile matter. A large number of simple aromatic structures produced and the dipolar spin–spin interaction between unpaired electrons became stronger, which was responsible for the linewidths broadening.28 It was observed that linewidths were broader in N2 atmosphere compared with in CO2 atmosphere. This might due to less simple aromatic structures formed in CO2 atmosphere compared with N2 atmosphere.34 And the dipolar spin–spin interaction between unpaired electrons became weaker, led to the linewidth narrower in CO2 atmosphere.
image file: c6ra22192k-f4.tif
Fig. 4 Variation of the linewidths with AFR pyrolysis temperature.

When AFR were gradually heated up to 600 °C, the structure of aromatic rings in chars was mainly peri-condensed during the carbonization process, and large amount of multi-ring aromatic components or even larger aromatic ring clusters were created. The spin-lattice interactions of paramagnetic centers in chars became stronger with the increase of multi-ring aromatic units.35 Thus, the relaxation time of unpaired electrons increased, which made the linewidths narrower. The linewidths of chars in N2 atmosphere was narrower at 600 °C than in CO2 atmosphere. That was because the chemisorption of CO2 on the nascent char surface could promote the thermal cracking of aromatic networks. The multi-ring aromatic structures, which could narrow linewidth through enhance the spin–lattice interactions, formed in CO2 atmosphere were less than N2 atmosphere.36,37

3.2. Analysis of C element by XPS

The chemical nature of the C element on surface of AFR and chars during pyrolysis process were analyzed by XPS (C 1s). XPS spectra and deconvolution results were shown in Fig. 5 and 6. The deconvoluted peaks at 284.75, 285.3, 286.3, 287.5, 289.0 ± 0.2 eV represented C1 (C–C or C–H bonds), C2 (carbon bound to nitrogen, C–N), C3 (carbon connect with hydroxyl or ether, C–O/C–OH), C4 (carbon bound to oxygen with two bonds, C[double bond, length as m-dash]O/O–C–O), C5 (carbon bound to oxygen with three bonds, O–C[double bond, length as m-dash]O), respectively.2,38,39 CO was the sum of C3, C4 and C5, which meant the total groups of carbon bounding to oxygen in samples.
image file: c6ra22192k-f5.tif
Fig. 5 XPS spectra for the C 1s of AFR during pyrolysis process. (a) N2 atmosphere (b) CO2 atmosphere.

image file: c6ra22192k-f6.tif
Fig. 6 Carbon functional groups on surface of AFR and chars.

The ratio of C1–C5 dramatic changed dramatically at the temperature range 320–600 °C after a steady phase (25–160 °C). C1 increased substantially to about 78% at 600 °C from 57% at room temperature (both in N2 and CO2 atmosphere). It indicated that the aromatization reactions occurred during pyrolysis, and led to the increase of the C–C bonds in aromatic ring system. Nitrogen containing components in AFR, such as amine and protein, decomposed during pyrolysis process and released NH3, HCN and NOx.40 Thus, the percentage of C2 in chars decreased from 7% to 2%. In addition, the percentage of CO decreased from about 36% to 20% with the increase of temperature, which was mainly attributed to the bond cleavage reaction of C4. The proportion of C3 changed slightly, from 13% to 15%. The proportion of C5 was at a low level with a percentage range of 0–3%, and had little impact on the percentage of CO. Unpaired electrons located in carbon functional groups mentioned above were the main source of free radicals in raw AFR. The variation of C1, C2 and CO during pyrolysis process would have significant effect on the characteristics of free radicals in chars, which were consistent with the variation of g-values.

3.3. Conversion of carbon structures analyzed by solid state 13C NMR spectra

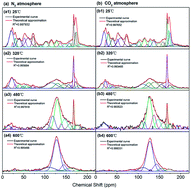
3.3.1 Analysis of 13C NMR spectra. The 13C NMR spectra of AFR sample (25 °C) and chars (pyrolyzed under 320 °C, 480 °C, 600 °C, respectively) were measured to characterize the evolution of carbon structures during pyrolysis process in detail (Fig. 7).
image file: c6ra22192k-f7.tif
Fig. 7 The 13C NMR spectra of AFR and chars. (a) N2 atmosphere, (b) CO2 atmosphere.

The carbon structures showed the same variation in N2 and CO2 atmosphere. There were distinct characteristic peaks of aliphatic carbon functional groups (chemical shift range 0–95.8 ppm) and carbonyl or carboxyl groups (166.5–215.0 ppm) in AFR sample when at room temperature (25 °C), which might be attributed to that the main components of AFR were crude lipid, protein and polysaccharide. With increasing of temperature, the peak intensity of aliphatic carbon functional groups and carbonyl groups decreased significantly, and almost disappeared at 600 °C. In contrast, the characteristic peaks of aromatic carbon (95.8–166.5 ppm) continuously increased with increasing pyrolysis temperature. This indicated that the species of carbon functional groups had obvious changes during pyrolysis process.

3.3.2 Conversion of carbon structures during pyrolysis process. The 13C NMR spectra of AFR and chars in this study were analyzed by curve fitting resolution.28 The spectra were well fitted by Gaussian and Lorentzian lines with good correlation factor (R2 ≥ 0.99). According to previous studies,41–43 carbon structures in biomass mainly include aliphatic C–C bonds (0–55.2 ppm), methoxyl groups (55.2–60.8 ppm), aliphatic C–O bonds (60.8–95.8 ppm), aromatic C–H bonds (95.8–125.0 ppm), aromatic C–C bonds (125.0–142.0 ppm), aromatic C–O bonds (142.0–166.5 ppm) and C[double bond, length as m-dash]O bonds (166.5–215.0 ppm). Based on the chemical shift ranges of carbon functional groups, the percentage of carbon functional groups in AFR and chars were summarized by calculating the share of certain fitted curves area in total fitted curves area, as shown in Fig. 8.
image file: c6ra22192k-f8.tif
Fig. 8 Variation of carbon structures in AFR and chars. (a) N2 atmosphere, (b) CO2 atmosphere.

The total percentage of aliphatic C–C bonds, methoxyl groups and aliphatic C–O bonds in AFR (25 °C) was as high as 51.88%. The results above indicated that aliphatic structure was dominant in raw AFR carbon structures. In addition, the percentage of C[double bond, length as m-dash]O bonds was 24.67%, which might mainly contributed by ester groups (–CO–OR) and amide groups (–CO–NH–) from lipid and protein in AFR. During pyrolysis, the percentage of different carbon functional groups changed obviously. The dominant carbon functional groups mentioned above decreased with the enhancing of pyrolysis degree. Meanwhile, the aromatic carbon functional groups, such as aromatic C–C bonds and aromatic C–O bonds, formed rapidly.

With pyrolysis temperature increasing from 25 °C to 320 °C, the percentage of methoxyl groups decreased from 10.65% to 2.58% (N2 atmosphere) and 4.08% (CO2 atmosphere), while the percentage of aliphatic C–O bonds decreased from 10.14% to 4.91% (N2 atmosphere) and 5.31% (CO2 atmosphere). This indicated that side chain groups, such as methoxyl groups and aliphatic C–O bonds, were susceptible to cracking by thermal decomposition, and the reaction was more active in N2 atmosphere. These results were consistent with the ESR analysis in Section 3.1.1. With the further increasing of pyrolysis temperature, the percentage of methoxyl groups and aliphatic C–O bonds continued to decrease. Especially methoxyl groups, almost disappeared at 600 °C. By contrast, the significant decrease of the aliphatic C–C bonds and C[double bond, length as m-dash]O bonds percentage happened when temperature higher than 480 °C, that was because the bond-breaking reactions of aliphatic C–C bonds and C[double bond, length as m-dash]O bonds needed more energy.

The percentage of aromatic C–C bonds and aromatic C–O bonds increased with the increasing pyrolysis temperature, while the ratio of aromatic C–H bonds showed a contrary tendency. The increasing of aromatic C–C bonds and aromatic C–O bonds could be mainly attributed to the pyrolysis condensation reaction of aliphatic carbon functional groups, methoxyl groups and C[double bond, length as m-dash]O bonds.20 In addition, the bonds cracking in aliphatic/aromatic hydroxyl groups produced oxygen-containing free radicals and π radicals on hydrocarbons, and subsequently formed aromatic C–O bonds during pyrolysis.44,45 The decrease of aromatic C–H bonds were due to its consumption in radical reactions which happened between aromatic C–H bonds and methoxyl groups. Meanwhile, more aromatic C–C bonds and aromatic C–O bonds were created. When AFR were pyrolyzed at 600 °C, the vast majority of carbon structures in chars converted into aromatic carbon functional groups which had high carbonization degree. Ben et al.23,46 studied the conversion of carbon functional groups in kraft lignin pyrolysis process, and obtained the similar results. The ratio of aromatic carbon functional groups reached 94.14% in N2 atmosphere and 90.13% in CO2 atmosphere at 600 °C. This indicated that N2 atmosphere was more beneficial to the reaction of AFR pyrolysis, resulting in a higher aromatization level of carbon structure in chars.

4. Conclusions

Pyrolysis process had significant influence on the AFR chemical properties such as free radicals and carbon structures. More free radicals and aromatic carbon functional groups were created in N2 atmosphere compared with CO2 atmosphere.

As the pyrolysis temperature increased, the degree of aromatization of carbon structures in the chars increased due to intensified condensation reaction, causing dramatic changes in the composition of free radicals.

The contributions of methoxyl groups, aliphatic C–O bonds, aliphatic C–C bonds and C[double bond, length as m-dash]O bonds decreased substantially in the free radicals composition, while that of aromatic C–C bonds and C–O bonds increased significantly with increasing pyrolysis temperature.

Conflict of interest

No potential conflict of interest was reported by the authors.

Acknowledgements

This work was supported by the National Natural Science Foundation of China (Grant No. 51508553), Beijing Training Project For The Leading Talents in S & T (Grant No. LJ201620), and China Postdoctoral Science Foundation Funded Project (Grant No. 2016M591266).

References

  1. C. Li, G. Zhang, Z. Zhang, D. Ma, L. Wang and G. Xu, Chem. Eng. J., 2015, 279, 530–537 CrossRef CAS.
  2. D. Ma, G. Zhang, P. Zhao, C. Areeprasert, Y. Shen, K. Yoshikawa and G. Xu, Chem. Eng. J., 2015, 273, 147–155 CrossRef CAS.
  3. Y. Wang, S. De and N. Yan, Chem. Commun., 2016, 52, 6210–6224 RSC.
  4. N. Yan and X. Chen, Nature, 2015, 524, 155–157 CrossRef CAS PubMed.
  5. Y. Gao, X. C. Chen, J. Zhang and N. Yan, ChemPlusChem, 2015, 80, 1556–1564 CrossRef CAS.
  6. X. Jiang, Y. Feng, G. Lv, Y. Du, D. Qin, X. Li, Y. Chi, J. Yan and X. Liu, Environ. Sci. Technol., 2012, 46, 13539–13544 CrossRef CAS PubMed.
  7. Y. Du, X. Jiang, X. Ma, X. Liu, G. Lv, Y. Jin, F. Wang, Y. Chi and J. Yan, Energy Fuels, 2013, 27, 6295–6303 CrossRef CAS.
  8. Y. Du, X. Jiang, G. Lv, X. Ma, Y. Jin, F. Wang, Y. Chi and J. Yan, Energy Convers. Manage., 2014, 88, 459–463 CrossRef CAS.
  9. J. Zhan, R. Wu, X. Liu, S. Gao and G. Xu, Fuel, 2014, 134, 283–292 CrossRef CAS.
  10. C. Baehrle, V. Custodis, G. Jeschke, J. A. van Bokhoven and F. Vogel, ChemSusChem, 2014, 7, 2022–2029 CrossRef CAS PubMed.
  11. K. H. Kim, X. Bai, S. Cady, P. Gable and R. C. Brown, ChemSusChem, 2015, 8, 894–900 CrossRef CAS PubMed.
  12. J. Kibet, L. Khachatryan and B. Dellinger, Environ. Sci. Technol., 2012, 46, 12994–13001 CrossRef CAS PubMed.
  13. C. Amen-Chen, H. Pakdel and C. Roy, Bioresour. Technol., 2001, 79, 277–299 CrossRef CAS PubMed.
  14. M. Liu, J. Yang, Z. Liu, W. He, Q. Liu, Y. Li and Y. Yang, Energy Fuels, 2015, 29, 5773–5780 CrossRef CAS.
  15. R. V. Hedegaard, L. Liu and L. H. Skibsted, Food Chem., 2015, 167, 185–190 CrossRef CAS PubMed.
  16. W. He, Q. Liu, L. Shi, Z. Liu, D. Ci, C. Lievens, X. Guo and M. Liu, Bioresour. Technol., 2014, 156, 372–375 CrossRef CAS PubMed.
  17. W. He, Z. Liu, Q. Liu, D. Ci, C. Lievens and X. Guo, Fuel, 2014, 134, 375–380 CrossRef CAS.
  18. J. Liu, X. Jiang, J. Shen and H. Zhang, Powder Technol., 2015, 272, 64–74 CrossRef CAS.
  19. W. Wang, Y. Ma, S. Li, J. Shi and J. Teng, Energy Fuels, 2016, 30, 830–834 CAS.
  20. Y. Qiao, S. Chen, Y. Liu, H. Sun, S. Jia, J. Shi, C. M. Pedersen, Y. Wang and X. Hou, Carbohydr. Polym., 2015, 133, 163–170 CrossRef CAS PubMed.
  21. Y. Wang, C. M. Pedersen, T. Deng, Y. Qiao and X. Hou, Bioresour. Technol., 2013, 143, 384–390 CrossRef CAS PubMed.
  22. L. Sanchez-Silva, D. Lopez-Gonzalez, J. Villasenor, P. Sanchez and J. L. Valverde, Bioresour. Technol., 2012, 109, 163–172 CrossRef CAS PubMed.
  23. H. Ben and A. J. Ragauskas, Bioresour. Technol., 2013, 147, 577–584 CrossRef CAS PubMed.
  24. M. L. Poutsma, Energy Fuels, 1990, 4, 113–131 CrossRef CAS.
  25. C. R. Shaddix and A. Molina, Proc. Combust. Inst., 2009, 32, 2091–2098 CrossRef CAS.
  26. A. Molina and C. R. Shaddix, Proc. Combust. Inst., 2007, 31, 1905–1912 CrossRef.
  27. L. Petrakis and D. W. Grandy, Anal. Chem., 1978, 50, 303–308 CrossRef CAS.
  28. J. Liu, X. Jiang, J. Shen and H. Zhang, Adv. Powder Technol., 2014, 25, 916–925 CrossRef CAS.
  29. M. Korkmaz and T. Özbey, Fuel, 1991, 70, 789–793 CrossRef CAS.
  30. K. Li, C. Zhu, L. Zhang and X. Zhu, Bioresour. Technol., 2016, 209, 142–147 CrossRef CAS PubMed.
  31. C. A. Wang, X. Zhang, Y. Liu and D. Che, Appl. Energy, 2012, 97, 264–273 CrossRef CAS.
  32. R. K. Rathnam, L. K. Elliott, T. F. Wall, Y. Liu and B. Moghtaderi, Fuel Process. Technol., 2009, 90, 797–802 CrossRef CAS.
  33. W. Chen and B. Lin, Energy, 2016, 94, 569–578 CrossRef CAS.
  34. Y. Bai, Y. Wang, S. Zhu, F. Li and K. Xie, Energy, 2014, 74, 464–470 CrossRef CAS.
  35. B. Pilawa, A. B. Więckowski, H. Wachowska and M. Kozłowski, Fuel, 1998, 77, 1561–1567 CrossRef CAS.
  36. L. Chang, Z. Xie, K. C. Xie, K. C. Pratt, J. I. Hayashi, T. Chiba and C. Z. Li, Fuel, 2003, 82, 1159–1166 CrossRef CAS.
  37. S. P. Gao, J. T. Zhao, Z. Q. Wang, J. F. Wang, Y. T. Fang and J. J. Huang, J. Fuel Chem. Technol., 2013, 41, 257–264 CrossRef CAS.
  38. B. Q. Liao, H. J. Lin, S. P. Langevin, W. J. Gao and G. G. Leppard, Water Res., 2011, 45, 509–520 CrossRef CAS PubMed.
  39. B. Pilawa, A. B. Wieckowski, R. Pietrzak and H. Wachowska, Fuel, 2002, 81, 1925–1931 CrossRef CAS.
  40. X. Zhu, S. Yang, L. Wang, Y. Liu, F. Qian, W. Yao, S. Zhang and J. Chen, Environ. Pollut., 2016, 211, 20–27 CrossRef CAS PubMed.
  41. M. Nagy, M. Kosa, H. Theliander and A. J. Ragauskas, Green Chem., 2010, 12, 31–34 RSC.
  42. P. Sannigrahi, A. J. Ragauskas and S. J. Miller, Energy Fuels, 2009, 24, 683–689 CrossRef.
  43. R. Samuel, Y. Pu, B. Raman and A. J. Ragauskas, Appl. Biochem. Biotechnol., 2010, 162, 62–74 CrossRef CAS PubMed.
  44. W. J. DeSisto, N. I. Hill, S. H. Beis, S. Mukkamala, J. Joseph, C. Baker, T. Ong, E. A. Stemmler, M. C. Wheeler, B. G. Frederick and A. van Heiningen, Energy Fuels, 2010, 24, 2642–2651 CrossRef CAS.
  45. J. M. Younker, B. Ariana and A. C. Buchanan, ChemPhysChem, 2011, 12, 3556–3565 CrossRef CAS PubMed.
  46. H. Ben and A. J. Ragauskas, Energy Fuels, 2011, 25, 5791–5801 CrossRef CAS.

Footnote

Electronic supplementary information (ESI) available. See DOI: 10.1039/c6ra22192k

This journal is © The Royal Society of Chemistry 2016
Click here to see how this site uses Cookies. View our privacy policy here.