Preparation of pH-responsive hollow poly(MAA-co-EGDMA) nanocapsules for drug delivery and ultrasound imaging†
He
Hu‡
a,
Xiaofen
Zhang
a,
Jin
Sun
a,
Lu
An
a,
Jing
Du
b,
Hong
Yang
a,
Fenghua
Li
b,
Huixia
Wu
a and
Shiping
Yang
*a
aThe Education Ministry Key Lab of Resource Chemistry, Shanghai Key Laboratory of Rare Earth Functional Materials, Shanghai Normal University, Shanghai, 200234, China. E-mail: shipingy@shnu.edu.cn
bDepartment of Ultrasound, Renji Hospital, School of Medicine, Shanghai Jiaotong University, Shanghai, 200127, China
First published on 27th October 2016
Abstract
pH-Responsive hollow poly(MAA-co-EGDMA) (abbreviated as HPMAA) copolymer nanocapsules with uniform core size of ∼250 nm and flexible shell thickness of ∼17 nm were synthesized by a hard-template protocol that combined a sol–gel process and surface-initialized polymerization. The silica template was then removed in a 10% HF solution. After further partial surface modification the HPMAA with biocompatible methoxypolyethylene glycol amine (mPEG2000-NH2) and the HPMAA–mPEG nanocapsules displayed negligible hemolytic activity and low cytotoxicity that could be used for pH-responsive delivery of drug (doxorubicin: DOX) and ultrasound imaging. The HPMAA–mPEG nanocapsules have high DOX-loading content (52.4 wt%). The DOX-loaded nanocapsules can be efficiently internalized by cells and controlled release within 20 h under high pH (7.4) condition, resulting substantial inhibition of HeLa cells. Then, the real-time in vivo ultrasound imaging of mice demonstrated that the HPMAA–mPEG nanocapsules can also be used as a novel ultrasound imaging contrast agent.
1. Introduction
With the rapid development of “personalized medicine”, smart nanoplatforms that focus on the combination of diagnostic agents with therapeutic drugs in a single formulation have attracted much attention.1 Among other various diagnostic techniques, ultrasound imaging is noteworthy for its real-time analysis, cost effectiveness, portability, and availability.2–5 However, weak differences of echogenicity between some human tissues often limits precise diagnosis. In order to visualize the specific detected area clearly, ultrasound contrast agents (UCAs) are frequently introduced in clinics.4,5UCAs can alter or enhance the emitting ultrasound signal to improve resolution of tissues in interest tissues. For this purpose, gas-filled microbubbles, such as SonoVue®, were developed to enhance the ultrasound signal.3,6 Unfortunately, the gas-microbubbles dissolved and collapsed due to effects of Laplace pressure, blood pressure, oxygen metabolism, and exposure of ultra sound energy within seconds of injection into the bloodstream.3,6 Recently, we have demonstrated that the hollow silica nanosphere with stiff and functional silica shell displayed good physiological stability, low cytotoxicity, and significant ultrasound positive contrast enhancement efficiency both in vitro and in vivo.3 The hollow silica nanospheres were further modified with Gd-complex and arginine–glycine–aspartic acid (RGD) peptide for targeted ultrasound and magnetic resonance imaging of mice tumor model.2 Our work has opened a promising application of silica-based inorganic UCAs. Alternatively, many efforts have been reported to develop gas-filled organic-based polymer UCAs in which poly(lactide-co-glycolide) (PLGA),7–9 polyvinyl alcohol (PVA), and poly(DL-lactide) (PLA)10 have been synthesized as the shell. However, there are still some drawbacks, such as overlarge size and relative polydispersity size distribution. That may result in instability and reluctant accumulation in normal organs that severely limit their clinical applications.6 Particularly, they lack the requirements of drug loading and controlled drug release. Therefore, it's still a challenge to synthesize monodispersed polymer nanocapsules with combined functionalities for ultrasound imaging and smart drug delivery.
Recently, a great number of types of stimuli (pH, temperature, redox, light, ultrasound, and enzyme) were reported on the environmentally sensitive nanovesicles as smart drug delivery systems.11–14 The pH-stimuli is considered as one of the most extraordinary and important method for many applications due to its unique biological trigger.13–15 For instance, the pH value changes from 1.0–3.0 within the stomach and 5.1–7.8 within the intestine of the human body. Thus, pH-responsive polymeric vesicles have good integrity at pH < 3, but have release channels at pH > 7. They are particular promising for oral delivery to specific organs in order to avoid possible side effects in stomach,15 or uptake by specific cancer cell lines such as HeLa cells with high pH of ∼7.34 in the cytosol and nucleus.16 The pH-responsive polymers represent an important group of stimuli-responsive materials where ionizable functional groups are capable of donating or accepting protons upon physiologically environmental pH changes.12 Polyacids, such as poly(acrylic acid) (PAA) and poly(methacrylic acid) (PMAA), with pKa values around 5–6, are two representative pH-sensitive polymers used in oral drug delivery systems.12,17,18 In addition, they are also considered to be biocompatible as the ionic carboxyl of PAA or PMAA in the polymer micellar corona can facilitate mucoadhesion. This property could enhance the retention time of the drug-entrapped micelles in the gastrointestinal tract and ensure complete drug dissolution, and consequently maximize drug absorption in the small intestine.12,19 For example, S. C. Lee's groups12,19 synthesized poly(ε-caprolactone)-b-poly(methacrylic acid) (PCL-b-PMAA) copolymer and investigated the pH responsive fluorescence dye release property in buffer; L. J. Zhang15 and Y. Liu20 prepared pH-sensitive amphiphilic triblock brush poly(lactide)-b-poly(methacrylic acid)-b-poly(poly-(ethylene glycol) methyl ether monomethacrylate) (PLA-b-PMAA-b-PPEGMA) copolymer and poly(methacrylic acid)-grafted hollow silica (PMAA-g-hollow SiO2) vesicles, respectively, and both of them studied the pH-sensitive release capability of their products in buffer. Most recently, C. H. Wang's group21 reported the 300 nm PMAA-based hollow nanospheres for ultrasound triggered drug delivery. Up-to-day, therefore, the most related reports were mainly focused on the materials preparation and characterization, but no more biological applications. In this context, the PMAA based hollow nanocapsules are an ideal candidate for nanotherapeutics, but also other scientific and technological interest.
Herein, we report the development and evaluation of a new type of pH- responsive hollow poly(methacrylic acid-co-ethylene glycol dimethacrylate) (poly(MAA-co-EGDMA) abbreviated as HPMAA) copolymer nanocapsules with uniform particle size of ∼250 nm for simultaneous ultrasound imaging and drug delivery. After surface modification of the HPMAA with methoxy polyethylene glycol amine (HPMAA–mPEG), the cytotoxicity test, hemolysis assay, drug loading/release cures and in vitro ultrasound imaging of the HPMAA–mPEG nanocapsules were systematically investigated. Finally, the HPMAA–mPEG was used in ultrasound imaging of mice in vivo.
2. Experimental section
2.1 Chemicals
Tetraethylorthosilicate (TEOS), (1-ethyl-3-(3-dimethyl aminopropyl)-carbodiimide) (EDC), N-hydroxy sulfosuccinimide (NHS), 2,2′-azobisisobutyronitrile (AIBN), acetonitrile, ammonia and ethanol were purchased from Sinopharm Chemical Reagent (Shanghai, China). Methoxypolyethylene glycol amine (mPEG2000-NH2), methacrylic acid (MAA, 99%), 3-(trimethoxysilyl)propylmethacrylate (MPS, 98%), ethylene glycol dimethacrylate (EGDMA) were purchased from shanghai civil chemical technology. All other chemical reagents were analytical grade and used directly without further purification. Double distilled water used in all experiments was purified using a Milli-Q Plus 185 water purification system (Millipore, Bedford, MA) with a resistance higher than 18 MΩ cm.2.2 Synthesis of hollow PMAA (HPMAA)
Firstly, the MPS modified silica templates were prepared by the modified Stöber method.12,22 Briefly, about 1 mL of TEOS was added to the mixture of 18 mL of ethanol, 4 mL of H2O, and 20 mL of ammonium hydroxide (27%). The mixture was stirred at room temperature for 4 h. The silica cores were collected by centrifugation and washed with deionized water and then ethanol 3 times. The final silica nanoparticles were dispersed in 18 mL of ethanol, followed by 0.5 mL of MPS injection into the silica solution. The solution was stirred for 24 h. After the reaction, the MPS modified silica (SiO2-MPS) templates were purified by centrifuging and washing with ethanol and water several times.Secondly, the SiO2@PMAA core/shell nanoparticles were prepared by distillation–precipitation polymerization with MAA as the monomer and EGDMA as the cross-linker. About 0.2 g of the SiO2-MPS seeds were dispersed in 80 mL of acetonitrile in a 250 mL flask. The mixture of MAA (0.82 mL), EGDMA (0.28 mL), and AIBN (0.02 g) were added into the flask to initiate the polymerization under reflux conditions (about 81 °C), the reaction was stopped at about 4 h when 40 mL of acetonitrile was distilled off. The SiO2@PMAA core/shell nanoparticles were purified by alternating washes with acetonitrile and ethanol three times.
Finally, a 10% HF solution used to etch the silica core of the SiO2@PMAA core/shell nanoparticles by stirring for 0.5 h. Excess HF and SiF4 were removed from the HPMAA nanoparticles by centrifuging and alternating washes with ethanol and water several times. The products were further dialyzed in water for 24 h, and the final HPMAA nanocapsules were concentrated by centrifuge filter.
2.3 Synthesis of mPEG conjugated HPMAA (HPMAA–mPEG)
First, 10 mg of HPMAA nanocapsule (∼1.32 µmol –COOH) in PBS solution (50 mL, pH 7.4) was activated with EDC and sulfo-NHS (with a molar ratio of –COOH/EDC/sulfo-NHS = 1![[thin space (1/6-em)]](https://www.rsc.org/images/entities/char_2009.gif) :
:![[thin space (1/6-em)]](https://www.rsc.org/images/entities/char_2009.gif) 10
10![[thin space (1/6-em)]](https://www.rsc.org/images/entities/char_2009.gif) :
:![[thin space (1/6-em)]](https://www.rsc.org/images/entities/char_2009.gif) 20) at R.T. for 4 h. Then, activated HPMAA was purified by centrifuge and washed with PBS (pH 7.4) 3 times. Afterwards, 0.5 µmol of mPEG–NH2 (MW = 2000) was added into 20 mL PBS solution containing activated HPMAA, and the mixture was stirred for 3 h at RT. Finally it was purified by centrifuge and washed with acetate buffer (pH 5.4) 3 times, and stored in 10 mL PBS solution for further use.
20) at R.T. for 4 h. Then, activated HPMAA was purified by centrifuge and washed with PBS (pH 7.4) 3 times. Afterwards, 0.5 µmol of mPEG–NH2 (MW = 2000) was added into 20 mL PBS solution containing activated HPMAA, and the mixture was stirred for 3 h at RT. Finally it was purified by centrifuge and washed with acetate buffer (pH 5.4) 3 times, and stored in 10 mL PBS solution for further use.
2.4 Hemolysis assay
Human blood stabilized with ethylenediaminetetraacetic acid disodium salt (EDTA) was kindly provided by Shanghai Blood Center (obtained from volunteers). The serum was removed from the blood by centrifugation, and the human red blood cells (HRBCs) were then washed five times with sterile isotonic PBS solution. Then, the cells were diluted 10 times with PBS. The diluted HRBCs suspension (0.3 mL) was then mixed with: (a) 1.2 mL PBS as a negative control; (b) 1.2 mL deionized water as a positive control; (c) 1.2 mL HPMAA–mPEG nanocapsule suspensions at concentrations of 50, 100, 200, 400 µg mL−1. The mixture was vortexed and then left to stand for 2 h at room temperature. Afterwards, the samples were centrifuged and diluted four times. The absorbance of the supernatants at 541 nm was measured on a Shimadzu UV-3101PC UV-vis absorption spectrophotometer. The hemolysis percentages of the samples were calculated by dividing the difference in absorbance between the sample and the negative control by the difference in absorbance between positive and negative controls, and multiplying the resulting ratio by 100%.2.5 Drug load and release of HPMAA–mPEG
The common anticancer drug doxorubicin (DOX) was chosen as a model drug to investigate the drug loading and controlled release behavior of HPMAA–mPEG nanocapsules. Typically, HPMAA–mPEG (5 mg) is dispersed in a DOX PBS (6 mL, 1 mg mL−1, pH 7.4) solution, and stirred at room temperature for 24 h under dark condition. The DOX-loaded HPMAA–mPEG was collected by centrifugation and washed 3 times with acetate buffer (pH 4.5) to remove excess DOX. The DOX–HPMAA–mPEG was obtained by centrifugation and freeze-dried. The mass of DOX loaded into the HPMAA–mPEG nanocapsules was calculated by subtracting the mass of DOX in the total supernatant from the total mass of the drug in the initial solution measured by a UV-vis spectrophotometer at 490 nm and a standard DOX calibration curve.For pH-response controlled release DOX from DOX–HPMAA–mPEG nanocapsules, the buffer solution (2.0 mL, phosphate buffer/pH 7.4; acetate buffer/pH 6.3, 5.2) containing DOX–HPMAA–mPEG (5 mg) was sealed in dialysis membranes (Mw cutoff = 3500). The dialysis bags were incubated in the corresponding buffer solution (8.0 mL) of the different pH (5.2, 6.3, 7.4), respectively, at 37 °C under gentle shaking (110 rpm). The amount of released drug was measured at the given time intervals by a UV-vis spectrophotometer at 490 nm. Each measurement was repeated three times.
2.6 Cell culture, cell uptake and cytotoxicity
A human cervical carcinoma cell line (HeLa cells) was provided by the Shanghai Institute of Biochemistry and Cell Biology, SIBS, Chinese Academy of Sciences. Cells were cultured in RPMI 1640 (Roswell Park Memorial Institute) supplemented with 10% FBS (Fetal Bovine Serum) at 37 °C and 5% CO2. Cells (5 × 10⁸ L) were plated on 14 mm glass cover slips under 100% humidity and allowed to adhere for 24 h.The cellular uptake of the DOX-loaded HPMAA–mPEG nanocapsules were observed by laser confocal scanning confocal microscopic (LSCM) (Olympus, FV10-ASW). The HeLa cells were seeded in 6-well culture plates (a clean cover slip was put in each well) and grown, overnight, as a monolayer, and incubated with 50 µg mL−1 of DOX–HPMAA–mPEG at 37 °C for a given time (3, 6, 9 and 12 h). The cells were washed 3 times with PBS and visualized by LSCM.
The cytotoxicity was measured by using the methyl thiazolyl tetrazolium (MTT) assay in HeLa cells. 5 × 10⁴ cells per well were seeded into 96-well cell culture plate, 100% humidity cultured at 37 °C and 5% CO2 for 24 h, and then different concentrations of free HPMAA–mPEG or DOX–HPMAA–mPEG nanocapsules (0, 20, 50, 100, 150, 200 µg mL−1), diluted in RPMI 1640, were added to the wells. The cells were then incubated for 12 and 24 h (or 3–24 h) under 5% CO2 at 37 °C. Subsequently, 10 µL MTT (5 mg mL−1) was added to each well and incubated for an additional 4 h under 5% CO2 at 37 °C. After addition of 10% sodium dodecyl sulfate (SDS, 100 µL per well), the assay well was allowed to stand at room temperature for 12 h. The OD570 (Abs. value) of each well with background subtraction at 690 nm was measured on Tecan Infinite M200 monochromator-based multi-function microplate reader. The following formula was used to calculate the inhibition of cell growth:
| Cell viability (%) = (mean of Abs. value of treatment group/mean Abs. value of control) × 100%. |
2.7 In vitro and in vivo ultrasound (US) imaging
In vitro US imaging was measured in the static state. The Eppendorf tube (2 mL) was filled with the physiological saline solution of HPMAA–mPEG nanocapsule with different concentrations (0–1 mg mL−1), and then the tube was immerged in a pure water tank. The transducer was coated with ultrasound gel to avoid air background. 2D gray-scale ultrasound and contrast-enhanced ultrasonography (CEUS) imaging were measured by the Mylab 90 scanner (Esaote Medical Systems, Genova, Italy). The ultrasound imaging was recorded by using a LA435 linear-array transducer under the following parameters: the frequency = 6.0 MHz, the medical index (MI) = 0.06. All images were saved as digital files for subsequent playback and analysis.2,3Handling and all manipulations were carried out in accordance with the guidelines of the Regional Ethic Committee, and all the experiments were approved by the Ethical Committee of the Shanghai Normal University. In vivo US imaging was scanned by small animal US imaging system (Prospect, S-Sharp) before and after tail vein injection of HPMAA–mPEG nanocapsule (500 µL, 0.8 mg mL−1) immediately with following parameters: dynamic range = 50 dB, Gain = 0 dB, Freq = 40 MHz, depth = 4.1 mm, power = 35.3%, Fps = 10 Hz. The nude mice (∼20 g) were anesthetized and kept on a heated stage to maintain their body temperature. US gel was used as a coupling agent on the mice. All images were performed by the imaging system as green overlays on the contrast mode. The liver was monitored as region of interest (ROI).
2.8 Materials characterization
The size and morphology of the SiO2-MPS template, SiO2@PMAA, HPMAA and HPMAA–mPEG nanocapsules was investigated by a JEOL JEM-2100 low to high resolution transmission electron microscope (HR-TEM) and a S-4800 field emission scanning electron microscopy (FE-SEM). These as-prepared samples were dispersed in ethanol and dropped on the surface of a copper grid for TEM and SEM test. Fourier-transform infrared (FTIR) spectra were performed using an IRPRESTIGE-21 spectroscope (Shimadzu) with KBr pellets.3. Results and discussion
3.1 Synthesis and characterization of the mPEG-modified hollow copolymer nanocapsules (HPMAA–mPEG)
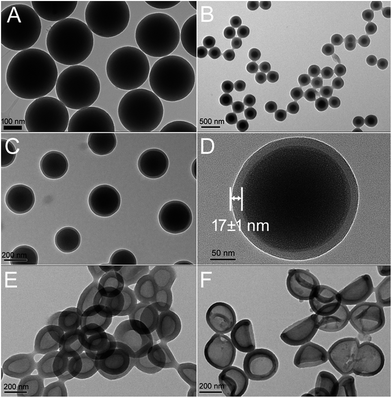
As shown in Scheme 1, the HPMAA copolymer nanocapsules were synthesized by the hard-template protocol that combined inorganic sol–gel process and polymerization reaction, and followed with the removal of the silica template in 10% HF solution.12,22 After further surface modification of the HPMAA with biocompatible methoxypolyethylene glycol amine (mPEG2000-NH2), the HPMAA–mPEG nanocapsules were used for pH-responsive delivery of drug (Dox) and mice ultrasound imaging. The size and morphology of the nanoparticles at each step was characterized by transmission electron microscopy (TEM) as shown in Fig. 1. First, the 3-(trimethoxysilyl)propylmethacrylate modified silica template (SiO2-MPS) was prepared by the Stöber process. Fig. 1A shows that the SiO2-MPS template has a spherical shape with a smooth surface and uniform particle size distribution of 245 ± 5 nm. Here the MPS units with carbon–carbon double bonds were introduced onto the surface of SiO2-MPS templates that can serve as initiation sites in the subsequent surface-initiated polymerization process to produce the silica-polymer core/shell nanospheres. Therefore, the silica-copolymer (SiO2@PMAA) core/shell nanospheres was obtained by distillation–precipitation polymerization of methacrylic acid (MAA) on the surface of the SiO2-MPS templates by using ethylene glycol dimethacrylate (EGDMA) as a cross-linking agent. After successful formation of a uniform co-polymeric shell on the surface of the SiO2 core, the core/shell structure could clearly be observed by TEM (Fig. 1B–D) due to the different contrast between the inorganic silica core and organic PMAA shell. The average particle size of the resultant SiO2@PMAA core/shell nanospheres was increased to 270 ± 5 nm compared to the SiO2-MPS cores (245 ± 5 nm). The thickness of the PMAA shell is around 17 nm (Fig. 1D). To obtain hollow PMAA nanocapsules, the SiO2@PMAA core/shell nanostructure was treated in 10% HF solution to remove the silica core (Fig. 1E). As well known, the PEG stealth layers can prevent nonspecific adsorption of proteins and nonspecific uptake by the reticuloendothelial system (RES), and render a long circulation time in the blood stream and passive targeting of cancer cells.3 Therefore, the one third amount of the –COOH in HPMAA were consumed to conjugate with methoxypolyethylene glycol amine (mPEG2000-NH2) to improve the biocompatibility of the final products HPMAA–mPEG (Fig. 1F). TEM images of the two hollow structures showed high contrast between the cores and the shells, which confirmed the silica cores had been removed, and the homogeneous PMAA shell still exhibited no obvious difference in morphology and thickness (∼17 nm). Notably, the average size of the both HPMAA was measured to be 250 ± 5 nm, which is slightly smaller than the precursor core/shell structure (Fig. 1B). It is believed that the small decrease in size is due to the shrinkage of the shell while drying the sample after removal of the silica core. Particularly, the HPMAA–mPEG nanocapsules exhibit no obvious difference in morphology and dimension as compared with its precursor HPMAA, but the monodispersibility was improved (Fig. 1F). The shell of HPMAA–mPEG kept its smoothness, uniformness and integrity after conjugation with mPEG-NH2 making it promising for further ultrasound imaging applications.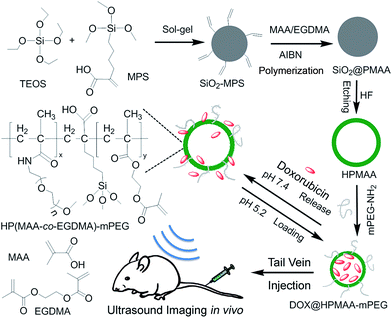 | ||
| Scheme 1 The synthetic route of mPEG modified hollow copolymer nanocapsules and its bioapplication for pH-responsive drug-delivery and ultrasound imaging. | ||
The process of the fabrication of the SiO2-MPS template, SiO2@PMAA, HPMAA and HPMAA–mPEG was monitored by FTIR analysis (Fig. 2). A strong and broad band in the range of 1210–1060 cm−1, corresponding to the Si–O–Si asymmetric (νas) stretching vibration from the SiO2 matrix, was observed in SiO2-MPS. The existence of the MPS was confirmed by the FTIR absorption spectrum of the SiO2-MPS nanoparticles that shown a peak at 1630 cm−1 (Fig. 2A) which corresponds to the vinyl groups of the MPS molecular. The two absorptions centered at 1735 and 1090 cm−1 should attribute to the stretching vibration of carboxyl groups in SiO2@PMAA (Fig. 2B). These two characteristic bonds became stronger in the HMPAA after removing the silica cores (Fig. 2C). After the mPEG-NH2 conjugation, the strong amide-bond vibration was at 1736 cm−1, and the broad new bond from 1240 to 1100 cm−1 was observed. This was attributed to the –C–O–C– of the PEG chain, determining successful synthesis of HPMAA–mPEG nanocapsules (Fig. 2D).
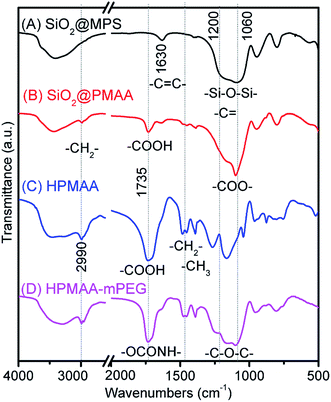 | ||
| Fig. 2 The FTIR spectra of the (A) SiO2-MPS template, (B) SiO2@PMAA core/shell nanoparticle, (C) HPMAA and (D) HPMAA–mPEG nanocapsule. | ||
Additionally, the surface zeta potential of each sample was measured to further prove the successful modification at each step (Fig. S1†). The surface zeta potential of SiO2-MPS template was −25.0 mV, and negative charge of SiO2@PMAA core/shell nanostructure was reduced to −33.2 mV due to the coverage of PMAA layer. The zeta potential of HPMAA was increased to −25.4 mV, while after conjugated with PEG, the HPMAA–mPEG has similar potential as −25.7 mV due to the de-proton balance of the nanocapsules in buffer and nearly neutral charge of –mPEG chain.23 In addition, the amount of carboxyl groups on the surface of the HPMAA and HPMAA–mPEG nanocapsule was evaluated to be ∼132.03 and ∼109.37 µmol g−1, respectively, by a quantitative colorimetric method.24,25 Based on the above-described FTIR, zeta potential, and carboxyl quantitative characterization, we can declare that the HPMAA and HPMAA–mPEG nanocapsules were fabricated successfully.
3.2 Hemolysis assay and cytotoxicity
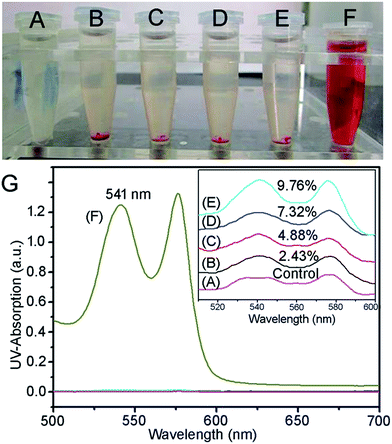
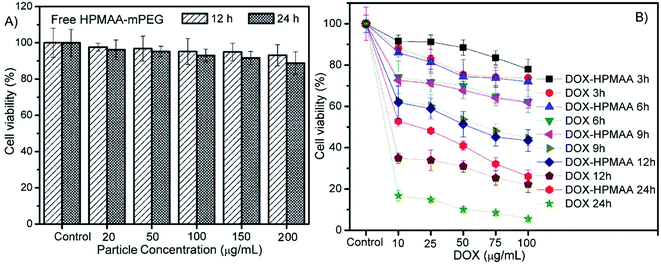
Blood biocompatibility is an important issue whether the HPMAA–mPEG nanocapsules can be used as a novel contrast agent or drug carrier for in vivo applications. Essentially, the hemolysis of human red blood cells (HRBCs) has been recognized as the main factor of limiting blood circulation half-lives of nanocapsules. Herein, the hemolytic behavior of HPMAA–mPEG nanocapsule was investigated by the standard hemolysis assay, as in our previous reports.3,25 The corresponding digital photograph of each sample is shown in Fig. 3A–F, the resulting solution visibly turned red due to the release of hemoglobin in solution by hemolysis; a denser red color of the corresponding solution means higher hemolytic activity. No obvious hemolysis effect was observed over a broad concentration range of 50–400 µg mL−1 (Fig. 3A–D). Here the negative and positive controls were prepared by using PBS (Fig. 3E) and deionized nanopure water (Fig. 3F), respectively. The concentration of hemoglobin released from the hemolyzed HRBCs was detected by measuring the absorbance of the supernatant at 541 nm by UV/Vis spectroscopy (Fig. 3G). The hemolysis percentage was about 9.76% even at a high concentration (400 µg mL−1) of HPMAA–mPEG nanocapsules. The negligible hemolysis assay confirmed the good biocompatibility of the nanocapsule with blood cells, which is favorable for intravenous administration.3.3 DOX loading and release kinetics of the HPMAA–mPEG
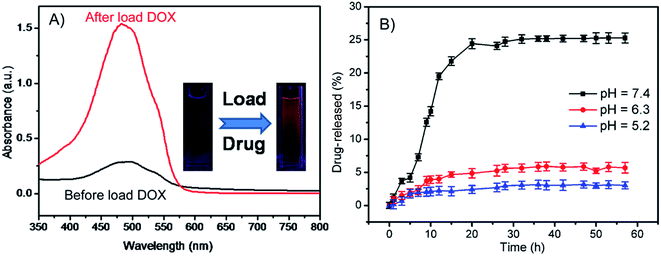
Investigations have demonstrated that the pH-sensitivity of the HPMAA nanocapsule is due to the structure of the shell layer (Scheme 1) which can be switched reversibly from a collapsed state to a swollen state at different pH.15,22,26 With increasing pH of the medium, the acrylic acid groups are ionized and the nanocapsules assumed a swollen or open structure that allow it to load or release guest molecular. On the other hand, as the pH is adjusted to a lower value, the HPMAA starts to shrink and aggregate due to the strong deionization and the formation of intermolecular hydrogen bond of the carboxyl groups.15 The shrunken HPMAA should seal the shell that could be expected to provide secure encapsulation of species under acidic condition. Doxorubicin (DOX) is a well-known antibiotic which used in the treatment of a wide range of cancer. Herein, the DOX was used to study the loading and sustainable release property of the HPMAA–mPEG nanocapsules. The load capacity of DOX in the nanocapsule was determined to be ∼524.15 µg mg−1 by monitoring the UV-vis absorption of solution before and after the loading process at 490 nm (Fig. 4A). The inset photography shows the fluorescence of DOX in HPMAA–mPEG nanocapsules after drug loading. The kinetics of DOX release from HPMAA–mPEG nanocapsules under different pH conditions at 37 °C was shown in Fig. 4B. The rate of DOX release from the HPMAA–mPEG nanocapsules under acidic conditions of pH 5.2 and 6.3 was relatively slow, with only 2% and 5% after 60 h, respectively. Meanwhile, the amount of DOX release was accelerated significantly in the presence of physiological condition (pH 7.4 PBS). There was more than 25% of DOX released within 20 h that attributed to the swelling of the shell structure which was caused by the stronger protonation of carboxyl groups of PMAA–mPEG at higher pH condition. Such drug release pattern of the HPMAA–mPEG nanocapsules ensures controllable drug dissolution in particular cancer cells and organs. For example, the nanocapsules can reduce drug leakage in the stomach by maximizing its release in the small intestine which offers largest area for drug absorption.15 This result suggests that the pH-responsive HPMAA–mPEG nanocapsules are much more favorable as delivery carriers for efficient administration of various hydrophobic drugs.3.4 Drug release in cell
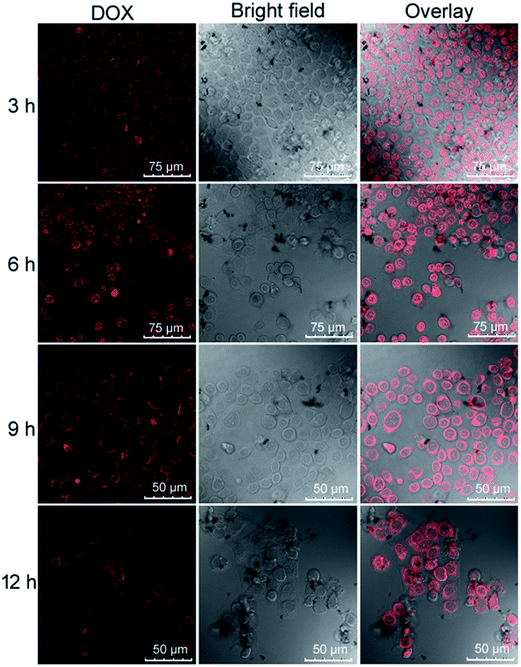
The enhanced permeability and retention (EPR) effect of nanoparticles are of vital importance for their bio-application as drug vehicles and imaging agents. To further investigate whether the HPMAA–mPEG nanocapsules can be efficiently internalized by cells and delivery drug in cells, the HeLa cells, which the pH value in its cytosol and nucleus reported around 7.34,16,27 were observed after incubated with the DOX–HPMAA–mPEG nanocapsules (50 µg mL−1) at 37 °C from 3 to 12 hours, by laser scanning confocal microscopy (LSCM). As shown in Fig. 5, after 3 h of incubation, the red fluorescence from DOX was observed in cytoplasm along with little red signal in the cell nucleus, suggesting that the DOX–HPMAA–mPEG nanocapsules which crossed the cell membrane and DOX molecules were released and internalized within the cytoplasm. As the incubation time prolonged to 6, 9 and 12 h, the intensity of red fluorescence increased gradually both in the cytoplasm and cell nucleus. Importantly, with increase the incubation time, we noticed that some cells were detached and the morphology of these cells turned round indicating the apoptosis of the cells. In addition, the cell density decreased suggesting that the DOX–HPMAA–mPEG nanocapsules inhabited the proliferation of cell effectively through release of DOX. The above results indicated that the efficient intracellular delivery and release of DOX by HPMAA–mPEG carriers.Next, the cytotoxicity of DOX-loaded HPMAA–mPEG nanocapsules was assessed on HeLa cells by using an in vitro toxicology assay kit (TOX-1, Sigma) based on the reduction activity of methyl thiazolyl tetrazolium (MTT) protocol (Fig. 6). But firstly we need to clarify the biocompatibility of the free HPMAA–mPEG nanocapsules. The viability of the untreated cells was used as the control group (100%) in all experiments. As shown in Fig. 6A, no significant decrease in the cell viability (>95%) was observed upon incubating the HeLa cells with free HPMAA–mPEG nanocapsules (concentration: 20 to 200 µg mL−1) at 37 °C for either 12 or 24 h. In contrast, the viability of HeLa cells in the presence of DOX-loaded HPMAA–mPEG nanocapsules and free DOX with a wide range of concentration based on DOX dosages from 10 to 100 µg mL−1 for 3 to 24 h was studied as shown in Fig. 6B. The DOX-loaded HPMAA–mPEG nanocapsules (guide by solid line) exhibited an increasing inhibition against HeLa cells with both increased concentration and incubation time that matched well with the LSCM observation (Fig. 5). When the incubation time was prolonged to 24 h, the cell viability only retained 26% at the highest DOX concentration (100 µg mL−1), suggesting a fairly high therapeutic effectiveness. We noticed that the cell viability was decreased dramatically as HeLa cell treated with free DOX (guide by dot line). Specifically, free DOX killed more cells as compared to DOX–HPMAA–mPEG after 12 and 24 h incubation. Unlike free DOX, however, we expect that the DOX–HPMAA–mPEG nanocapsules to deliver the cytotoxic agent selectively to the cancer cells with deserved pH condition than to normal tissue. Taken together, these results imply that the biocompatible HPMAA–mPEG nanocapsules have great potential to be used as pH-responsible drug carriers for nanomedicine application.
3.5 In vitro ultrasound imaging of the HPMAA–mPEG
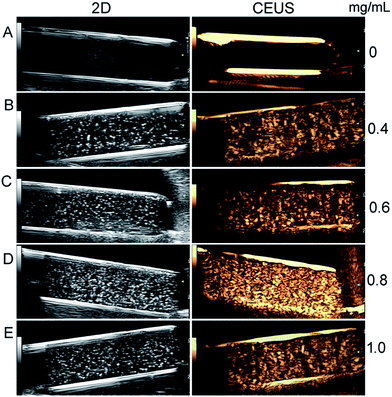
The in vitro ultrasound imaging of HPMAA–mPEG nanocapsules was investigated by the Mylab 90 scanner system equipped with 2D gray-scale ultrasound and contrast-enhanced ultrasonography (CEUS) imaging modes under different concentrations (0.4–1.0 mg mL−1) in PBS (7.0) buffer. The frequency and mechanical index (MI) of the ultrasound probe was chosen as 6.0 MHz and 0.06, respectively, according to our previous experiments.3,25 As shown in Fig. 7, we noticed that the signal intensity of the ultrasound imaging increased as a function of HPMAA–mPEG concentration. There were no signals observed when only PBS buffer used as control, indicating the absence of acoustical reflective capsules. The signal intensity became stronger from 0.40 mg mL−1 of HPMAA–mPEG, and reached a maximum at 0.80 mg mL−1 under the CEUS imaging model. Meanwhile, the signal intensity at 1.0 mg mL−1 shown slightly decrease that maybe attributed to the aggregation of the nanocapsules at high concentration, resulting poor ultrasound resonance. Therefore, for the HPMAA–mPEG, the optimal US imaging concentration should be around 0.80 mg mL−1.3.6 In vivo ultrasound imaging of the HPMAA–mPEG
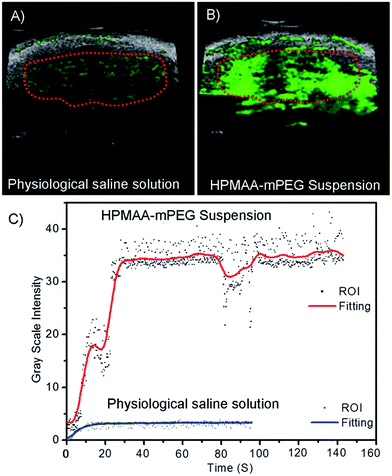
Based on the promising US phantom results, further application of HPMAA–mPEG nanocapsules as contrast agents for in vivo US imaging of healthy nude mice was investigated (Fig. 8). The liver of the mice was tracked as region of interest (ROI) because of abundant macrophages cells named Kupffer cells which could rapidly uptake of nanoparticles.1 The images were recorded digitally by overlaying the US enhanced signal (green) on the background (gray) and analyzed by a small animal US imaging system (Prospect, S-Sharp). There was nearly no enhanced signal which could be observed after injection of pure physiological saline solution as control (Fig. 8A). As the nanocapsules were intravenously administered into the mice, the contrast in the liver increased significantly (Fig. 8B). For quantitative analysis, the enhancement of the contrast signal, the complete cross-section of the liver was chosen for the measurement, and the differences of average image intensity determined by subtraction of the different administration images were automatically calculated by the imaging system (Fig. 8C). The inflow of the nanocapsules was recorded for 2 min began at the start of injection. The signal intensity in the liver region increased during the first 30 s after injection completed, and then maintained at a steady level that revealed the continuous circulation of the HPMAA–mPEG in mice. The signal intensity in the liver was shown obvious enhancement as compared to the control image. These results demonstrated that HPMAA–mPEG nanocapsules shown bright future to be used as a novel contrast agent for real-time monitor of organism by US imaging.4. Conclusion
We have demonstrated the successful synthesis of pH-responsive hollow poly(MAA-co-EGDMA) (abbreviated as HPMAA) copolymer nanocapsules with uniform particle size of ∼250 nm and flexible shell of ∼17 nm in thickness by a combination of hard-template protocol and surface-initialized polymerization. The PEG modified HPMAA (HPMAA–mPEG) nanocapsules displayed negligible hemolytic activity and low cytotoxicity. The hollow structure and carboxyl functionalized shell of the HPMAA–mPEG nanocapsules offered its superior ultrasound imaging contrast efficiency and excellent drug-delivery capacity. The HPMAA–mPEG nanocapsules have high DOX-loading content (52.4 wt%), and the DOX-loaded nanocapsules can be efficiently internalized by cells and controlled release within 20 h under high pH (7.4) condition, resulting outstanding inhibition against HeLa cells. The overall in vitro drug release results shows the great potential of HPMAA–mPEG nanocapsules as delivery vehicles for the efficient administration of various hydrophobic drugs triggered by pH value. Finally, the real-time in vivo ultrasound imaging of nude mice indicated that the HPMAA–mPEG nanocapsules can also been used as a novel UCAs. All these merits show the light of the final goal for combining the diagnostic and therapeutic functionalities in one theranostics nanoplatform.Acknowledgements
This work was supported by the National Natural Science Foundation of China (51102171).References
- T. Lammers, S. Aime, W. E. Hennink, G. Storm and F. Kiessling, Acc. Chem. Res., 2011, 44, 1029 CrossRef CAS PubMed.
- L. An, H. Hu, J. Du, J. Wei, L. Wang, H. Yang, D. Wu, H. Shi, F. Li and S. Yang, Biomaterials, 2014, 35, 5381 CrossRef CAS PubMed.
- H. Hu, H. Zhou, J. Du, Z. Wang, L. An, H. Yang, F. Li, H. Wu and S. Yang, J. Mater. Chem., 2011, 21, 6576 RSC.
- B. A. Kaufmann and J. R. Lindner, Curr. Opin. Chem. Biol., 2007, 18, 11 CrossRef CAS PubMed.
- H. D. Liang and M. J. K. Blomley, Br. J. Radiol., 2003, 76, S140 CrossRef CAS PubMed.
- E. G. Schutt, D. H. Klein, R. M. Mattrey and J. G. Riess, Angew. Chem., Int. Ed., 2003, 42, 3218 CrossRef CAS PubMed.
- R. Diaz-Lopez, N. Tsapis, M. Santin, S. L. Bridal, V. Nicolas, D. Jaillard, D. Libong, P. Chaminade, V. Marsaud, C. Vauthier and E. Fattal, Biomaterials, 2009, 31, 1723 CrossRef PubMed.
- R. Diaz-Lopez, N. Tsapis, D. Libong, P. Chaminade, C. Connan, M. M. Chehimi, R. Berti, N. Taulier, W. Urbach, V. Nicolas and E. Fattal, Biomaterials, 2009, 30, 1462 CrossRef CAS PubMed.
- E. Pisani, N. Tsapis, B. Galaz, M. Santin, M. Berti, N. Taulier, E. Kurtisovski, O. Lucidarme, M. Ourevitch, B. T. Doan, J. C. Beloeil, B. Gillet, W. Urbach, S. L. Bridal and E. Fattal, Adv. Funct. Mater., 2008, 18, 2963 CrossRef CAS.
- F. Yang, Y. X. Li, Z. P. Chen, Y. Zhang, J. R. Wu and N. Gu, Biomaterials, 2009, 30, 3882 CrossRef CAS PubMed.
- P. Theato, B. S. Sumerlin, R. K. O'Reilly and I. I. I. T. H. Epps, Chem. Soc. Rev., 2013, 42, 7055 RSC.
- S. C. Lee and H. J. Lee, Langmuir, 2007, 23, 488 CrossRef CAS PubMed.
- Y. Dai, P. a. Ma, Z. Cheng, X. Kang, X. Zhang, Z. Hou, C. Li, D. Yang, X. Zhai and J. Lin, ACS Nano, 2012, 6, 3327 CrossRef CAS PubMed.
- X. Zhang, P. Yang, Y. Dai, P. a. Ma, X. Li, Z. Cheng, Z. Hou, X. Kang, C. Li and J. Lin, Adv. Funct. Mater., 2013, 23, 4067 CrossRef CAS.
- Y. Q. Yang, W. J. Lin, B. Zhao, X. F. Wen, X. D. Guo and L. J. Zhang, Langmuir, 2012, 28, 8251 CrossRef CAS PubMed.
- pH of cytosol and nucleus in living HeLa cell, http://bionumbers.hms.harvard.edu/bionumber.aspx?%26id=105943%26ver=4.
- H. Zhang, X. Zhang and X. Yang, J. Colloid Interface Sci., 2010, 348, 431 CrossRef CAS PubMed.
- L. Li, G. Liu, D. Qin and X. Yang, Polym. Chem., 2010, 1, 650 RSC.
- H. Lee and S. Lee, Polym. Bull., 2010, 65, 743 CrossRef CAS.
- C. L. Lay, H. R. Tan, X. Lu and Y. Liu, Chem.–Eur. J., 2011, 17, 2504 CrossRef CAS PubMed.
- P. Yang, D. Li, S. Jin, J. Ding, J. Guo, W. Shi and C. Wang, Biomaterials, 2014, 35, 2079 CrossRef CAS PubMed.
- G. Li, Q. Shi, S. J. Yuan, K. G. Neoh, E. T. Kang and X. Yang, Chem. Mater., 2010, 22, 1309 CrossRef CAS.
- A.-C. Faure, S. Dufort, V. Josserand, P. Perriat, J.-L. Coll, S. Roux and O. Tillement, Small, 2009, 5, 2565 CrossRef CAS PubMed.
- H. Hu, D. Li, S. Liu, M. Wang, R. Moats, P. S. Conti and Z. Li, Biomaterials, 2014, 35, 8649 CrossRef CAS PubMed.
- H. Hu, S. Liu, D. Li, M. Wang, R. Moats, H. Shan, P. Conti and Z. Li, J. Mater. Chem. B, 2014, 2(25), 3998–4007 RSC.
- I. Drachuk, O. Shchepelina, M. Lisunova, S. Harbaugh, N. Kelley-Loughnane, M. Stone and V. V. Tsukruk, ACS Nano, 2012, 6, 4266 CrossRef CAS PubMed.
- J. Llopis, J. M. McCaffery, A. Miyawaki, M. G. Farquhar and R. Y. Tsien, Proc. Natl. Acad. Sci. U. S. A., 1998, 95, 6803 CrossRef CAS.
Footnotes |
| † Electronic supplementary information (ESI) available. See DOI: 10.1039/c6ra21411h |
| ‡ Current address: Department of Biomedical Engineering, School of Medicine, Case Western Reserve University, 2109 Adelbert Road, Cleveland, OH, 44106-5056, USA |
| This journal is © The Royal Society of Chemistry 2016 |

