
 Open Access Article
 This Open Access Article is licensed under a Creative Commons Attribution-Non Commercial 3.0 Unported Licence
Effect of the morphology and phases of WO3 nanocrystals on their photocatalytic efficiency
Dávidné
Nagy
a,
Dávid
Nagy
b,
Imre Miklós
Szilágyi
cd and
Xianfeng
Fan
*a
aInstitute for Materials and Processes, School of Engineering, The University of Edinburgh, The King's Buildings, Mayfield Road, Edinburgh, EH9 3JL, UK. E-mail: x.fan@ed.ac.uk; Fax: +44 (0)131 6506551; Tel: +44 (0)131 6505678
bSchool of Engineering and Physical Sciences, Heriot-Watt University, Edinburgh, EH14 4AS, UK
cDepartment of Inorganic and Analytical Chemistry, Budapest University of Technology and Economics, Szent Gellért tér 4., Budapest, H-1111, Hungary
dMTA-BME Technical Analytical Research Group, Szent Gellért tér 4., Budapest, H-1111, Hungary
First published on 30th March 2016
Abstract
Understanding of the effect of the morphology and crystal phase on photocatalytic efficiency and their precise control are still a great challenge in photocatalysis. In this paper, we use WO3 as an example to study how to control the morphology through understanding the effect of solution pH, EtOH and polymeric surface modulator on the morphology, crystalline phase, band gap and the photocatalytic efficiency of WO3 nanostructures. The photocatalytic efficiency of nano WO3 is a compromise of the band gap, crystal phase, morphology, and the oxidation state. Cuboid-shaped m-WO3 with Eg = 2.7 eV and nanoneedle h-WO3 with Eg = 3.1 eV give high photocatalytic efficiency, while nanowire h-WO3 with Eg = 2.9 eV gives the lowest photocatalytic efficiency. Detailed control of the morphology and crystal phase of nanoscale WO3 were also presented in this paper. pH 1.05 was found to be a transition point for the crystalline phase, crystal size and band gap. pH values lower than 1.05 preferred monoclinic, whereas pH values higher than 1.05 favoured hexagonal WO3 formation. At pH 1.05, the crystal shape changed from cuboid to a fine nanoneedle shape, which was followed by a sudden size decline and an exponential increase in the aspect ratio. At the transition pH, the band gap reached a peak.
1. Introduction
Semiconductor nanostructures are technologically important materials due to their unique electrical and optical properties. These materials are widely recognised across many fields of application, such as photovoltaics,1 plasmonic light-harvesting devices,2 Li-batteries,3,4 energy saving displays,5 memory devices,6,7 drug delivery vectors, medical lasers,8 diagnostic platforms,9 (photo) catalysts,10 nanofibrous membranes11 and pollution monitoring systems.12The striking features of such nanoscale materials are particularly determined by their size and shape. In the mid 1980's quantum dots were shown to exhibit a strong relationship between their size and the longest absorbed wavelength, which was of particular interest for fine-tuning the optical properties of nanostructures by simple size-control.13 Later, 1D nanomaterials were recognised to have enhanced charge carrier transport properties owing to their beneficial shape, which attains less interfacial interaction with grain boundaries and therefore produces longer-lived charges.14,15
Although many applications of nanomaterials are determined by the size- and shape-dependent properties, it is still a great challenge to synthesise these materials by precise control over their microstructure. WO3 is an n-type semiconductor oxide which has gained widespread interest due to its attractive properties for enhancing visible photoactivity of wide band gap semiconductors such as TiO2. It is also widely used for the fabrication of electrochromic devices, cost-effective displays, smart windows, optical switches or gas sensors.6,16 Similarly to other materials, WO3 is popularly synthesised by hydrothermal processes owing to its facile arrangement, cost effective nature and the possibility of versatile product formation.17,18 As the shape of nanodimensional materials prepared by wet-chemical processes is mainly driven by nucleation and growth kinetics, many factors were shown to be decisive for the final morphology.17,19
A great variety of structure directing agents were found to modulate the crystal growth including inorganic salts, organic acids, polymers and surfactants.20–23 Adhikari et al. used fluoroboric acid to obtain nanocuboid WO3 and optimized the product morphology by varying the acid concentration, the reaction time and the temperature.24 Other factors such as the processing temperature, the time, the precursor concentration and the pH were also shown to affect the nanostructures. Bai et al. concluded that the temperature and the time of the hydrothermal synthesis influenced strongly the diameter of the obtained WO3 nanorods.25 Peng et al. showed that the increasing concentration of the capping agent notably changed the morphology of WO3.4 In addition to these, Sonia et al. revealed that hexagonal superstructure and twin octahedral WO3 can be formed at pH 1 and pH 5.25, respectively.26
Although substantial experimental work has been devoted to interpreting the relationship between process parameters and microstructure in nanomaterial synthesis, theories and the current understanding are still limited to explaining the crystal growth mechanism and limited to fabricating designed nanostructures due to the lack of sufficient and comparable experimental data.5,27,28 The classical nucleation theory proposed by LaMer and Dinegar has been widely used to explain the crystal growth mechanism. However it cannot be generally applied to explain the effect of process parameters on the microstructure, and experimental results were found to contradict the theory.28–30
In this study we focused on WO3 polymorphs to study the effect of hydrothermal synthesis conditions, such as solution pH, the chain length of polymeric surface modulator and mixed solvent medium, on the crystal growth, on the morphology and on the photocatalytic efficiency. We investigated what is the drive of the morphology evolution beyond the influence of supersaturation. In addition to this, we intended to study the correlation between the optical property and the crystal phase and size of the nanostructures by calculating the band gap energies. The prepared WO3 nanostructures were fully characterised by XRD, SEM, TEM, BET, XPS and solid phase diffuse reflectance and tested for photocatalytic application.
2. Materials and method
Sodium tungstate dihydrate (Na2WO4·2H2O, 99+%, ACS reagent) and ammonium nitrate (NH4NO3, 99+%, ACS reagent) were purchased from Acros Organics. Hydrochloric acid (HCl, 37%, ACS reagent), poly(ethylene glycol) (PEG, average Mn 3350 g mol−1) powder, poly(ethylene glycol) (PEG, average Mn 20![[thin space (1/6-em)]](https://www.rsc.org/images/entities/char_2009.gif) 000 g mol−1) flakes and poly(ethylene oxide) (PEG, average Mn 200000 g mol−1) powder and methyl orange (MO, Reag. Ph. Eur) were purchased from Sigma-Aldrich.
000 g mol−1) flakes and poly(ethylene oxide) (PEG, average Mn 200000 g mol−1) powder and methyl orange (MO, Reag. Ph. Eur) were purchased from Sigma-Aldrich.
WO3 nanostructures were prepared via a hydrothermal process which was inspired by an earlier publication.31 In a typical synthesis, 2.0 g of Na2WO4·2H2O was dissolved in 45 mL water, then 30 mL of 0.03 g mL−1 and 0.05 g mL−1 poly(ethylene glycol) (PEG) and NH4NO3 solutions were added to the transparent Na2WO4 solution, respectively. The pH was adjusted by 6 M HCl. All chemicals were analytical grade reagents. For the ethanol/water based system the ratio of EtOH/H2O was set to 1:3 in volume. All the as-prepared solutions were aged at room temperature for an additional 1.5 hours and then transferred to a 150 mL Teflon-lined autoclave. The as-prepared mixtures were treated at 200 °C for 24 hours in a furnace, then left to cool down naturally. The solid precipitates were collected by centrifugation and then washed with distilled water and ethanol for several times. Finally the as-prepared powders were dried at 100 °C for 12 hours.
The catalysts presented in this paper are named as follows. For catalysts of W-0.10, W-0.51, W-1.05, W-1.52, W-2.01, the digital number indicates the solution pH. For example, W-0.51 means that the WO3 was synthesised at pH 0.51. For W-0.1-P3350 and W-1.5-P200E nomenclature, the first number refers to the pH level and the second part to the carbon chain length of the PEG. W-EtOH stands for the sample obtained from the EtOH/H2O precursor solution. The synthesis conditions can be viewed in Table 1.
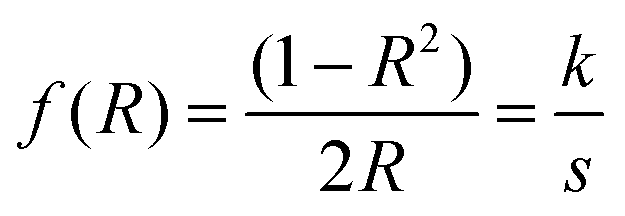
| Catalyst | pH | Crystal phase | Morphology | Colour | E g [eV] [±0.03] | Specific surface area (m2 g−1) |
|---|---|---|---|---|---|---|
| W-0.10 | 0.10 | m-WO3 | Cuboidal nanoplates | Yellow | 2.70 | 7.8 |
| W-0.51 | 0.51 | m-WO3 + o-WO3·0.33H2O | Nanorods | Yellow | 2.70 | 6.6 |
| W-1.05 | 1.05 | m-WO3 + h-WO3 + o-WO3·0.33H2O | Nanorods + nanoneedles | Yellow | 3.25 | 19.2 |
| W-1.52 | 1.52 | h-WO3 + o-WO3·0.33H2O | Nanoneedles | Yellow | 3.10 | 32.3 |
| W-2.01 | 2.01 | h-WO3 | Nanowires | Blue + yellow | 2.93 | 43.8 |
| W-0.1-P3350 | 0.10 | m-WO3 | Cuboidal nanoplates | Yellow | ||
| W-0.1-P200E | 0.10 | m-WO3 | Cuboidal nanoplates | Yellow | ||
| W-1.5-P3350 | 1.48 | h-WO3 + o-WO3·0.33H2O | Nanoneedles | Yellow | 2.91 | |
| W-1.5-P200E | 1.45 | h-WO3 + o-WO3·0.33H2O | Nanoneedles | Yellow | 2.87 | |
| W-EtOH | 1.68 | h-WO3 | Nanoneedles | Blue | 3.13 |
The morphology and the crystal phase of the as-prepared WO3 nanomaterials were characterised by scanning and transmission electron microscopy (SEM, TEM) and X-ray powder diffraction (XRD), and XPS respectively. The BET specific areas of catalysts were measured using NOVA 2000 gas sorption analyser (Quantachrome Corporation) under N2 gas. The band gap energies were calculated from the solid-phase UV-visible diffuse reflectance spectra. The electron microscope images were taken by a LEO 1540XB type RÖNTEC Quantax field emission scanning electron microscope and a Philips/FEI CM120 Biotwin transmission electron microscope. The XRD powder diffraction patterns were taken by a Bruker D2 PHASER diffractometer using the Cu Kα radiation wavelength (λ = 1.542 Å). The solid-state UV-visible diffuse reflectance spectra were recorded by a JASCO V-670 spectrophotometer equipped with an integration sphere in the spectral range of 200–850 nm using KBr as a white reference.
The liquid-phase photocatalysis were conducted in a batch-type jacketed quartz reactor equipped with an air bubbling system. The temperature was maintained by circulating cooling water in the jacket of the reactor. Methyl orange (MO) was used as a model compound for the photo-degradation. After the removal of catalyst by centrifugation, an Analytic Jena Specord 250 UV-vis spectrophotometer was employed to follow the dye concentration at the maximum peak wavelength (465 nm). Prior to the tests each catalyst was allowed to reach adsorption–desorption equilibrium by stirring the catalyst–dye suspension in darkness for an hour. The initial concentration of the dye and the catalyst loading was set to 20 mg L−1 and 50 mg, respectively. The UV/visible light was provided by a PLS-SXE300 xenon arc lamp equipped with a PE300BF type light bulb (total vis light output between 390 nm and 770 nm: 5000 lumen, total UV output for λ < 390 nm: 2.6 Watts). The light was positioned 6 cm far from the liquid level. From specification the estimated light intensity at 6 cm distance from the light window is ca. 5.5 W cm−2.
3. Results and discussion
3.1 Effect of pH on WO3 morphology and crystal shapes
WO3 nanostructures are prepared typically between pH 1 and pH 3. Relatively few studies applied strong acidic conditions (pH < 1) and even less studies revealed successful preparation of WO3 at a pH above 3.26 To investigate the effect of the solution pH on WO3 hydrothermal products, experiments were conducted at pH of 0.10, 0.51, 1.05, 1.52 and 2.01, while other parameters, such as the processing temperature, reaction time and the amount of the precursor materials, remained unchanged. The experimental results indicate that the solution pH significantly affects both the morphology and the crystalline phase of nanostructured WO3. When the solution pH increased from 0.10 to 2.01, the morphology of cuboid-shaped WO3 changed firstly to nanorod, then to nanoneedle and finally to nanowire shape. The increase in solution pH resulted in a significant increase in the ratio of length to thickness of the crystals. The change in crystalline phase was also observed, at low pH levels up to pH 1.05 mainly monoclinic (m-) WO3 was formed, but further increase in the pH resulted in crystal phase transition to hexagonal (h-) WO3. At the intermediate pH levels orthorhombic (o-) phase was detected as co-existing phase. The summary of the experimental conditions can be viewed in Table 1.The morphological evaluation of the prepared samples was based on SEM images as shown in Fig. 1. At pH 0.10, cuboidal nanoplates (Fig. 1a) were formed with an average thickness of 30–50 nm and a length of a couple of hundreds nm. Increasing the pH to 0.51 yielded nanorod-like structures with a size range of 50–100 nm in thickness and several hundred nm in length as it can be seen on Fig. 1b. At pH 1.05, mixed morphology was observed in which nanorod structures with the thickness of 50–100 nm and the length of 800–1000 nm co-existed with a much finer nanoneedle phase shown in Fig. 1c. The nanoneedles had the characteristic dimension of 10–15 nm in thickness. At pH 1.52, uniform nanoneedles possessing 10 nm in thickness and 200–300 nm in length were observed (Fig. 1d). Further increase in the pH to 2.01 led to the formation of similarly thin but significantly longer nanowires. A lower magnification SEM image (scale bar 1000 nm) (Fig. 1e) is provided for W-2.01 to show the length of the nanowires.
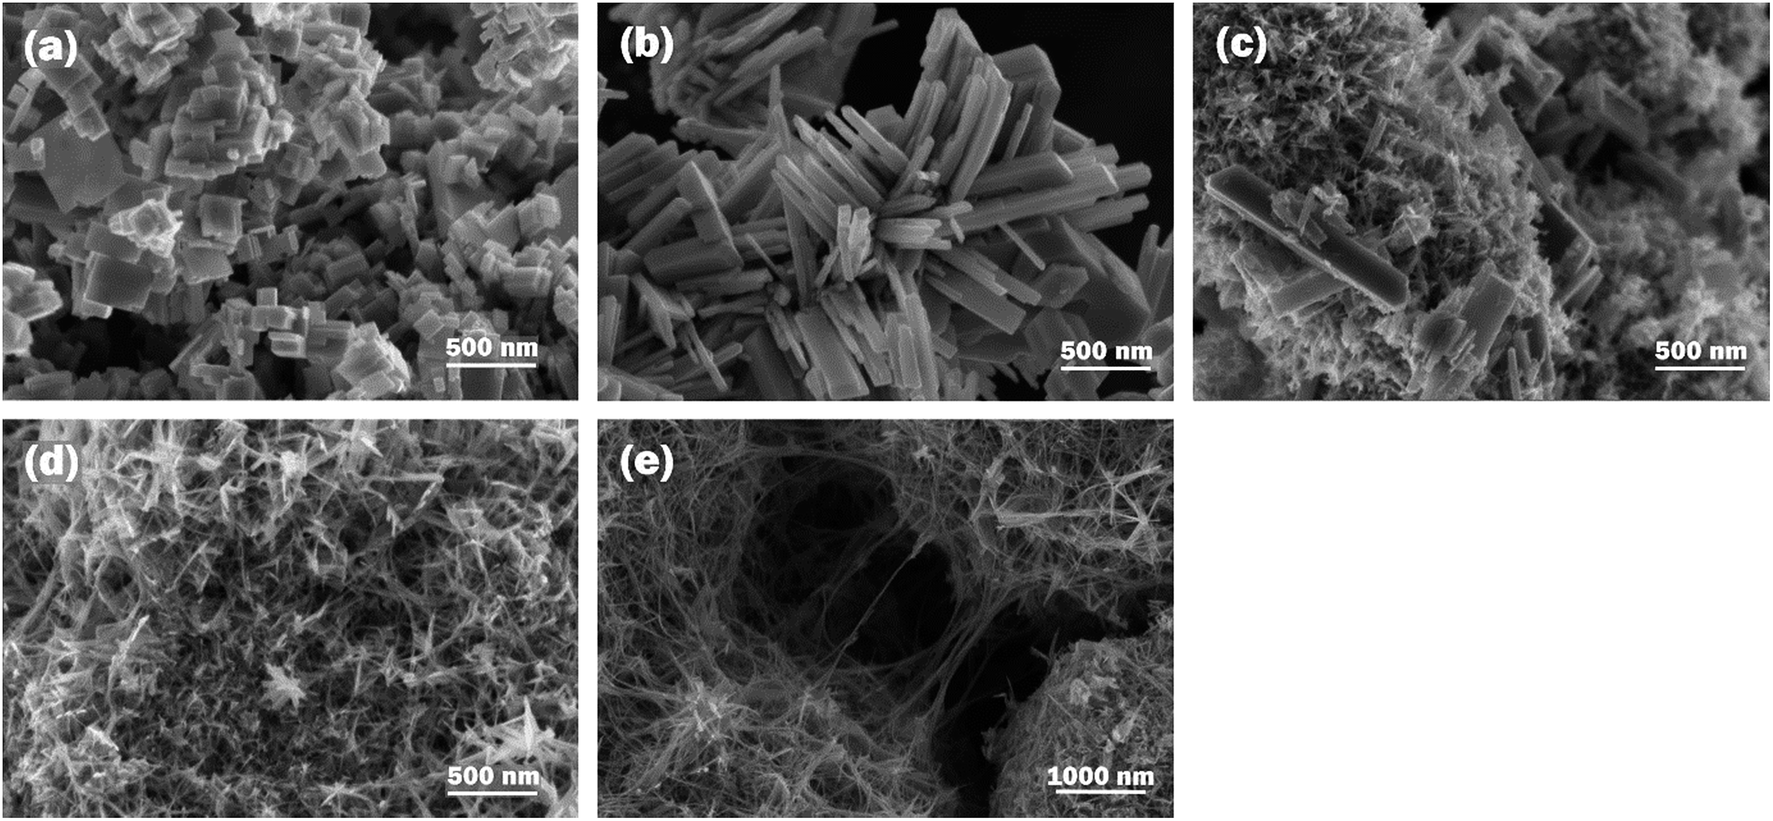 | ||
| Fig. 1 SEM images of (a) W-0.10, (b) W-0.51, (c) W-1.05, (d) W-1.52, (e) W-2.01. | ||
The aspect ratio of the nanostructures followed an exponential trend over the applied pH range from 0.10 to 2.01. When the pH was between 0.10 and 0.51, the WO3 nanostructures took regular cuboid crystal shapes, and the aspect ratio of the cuboid crystals increased up to ca. 10 with solution pH. The pH 1.05 was recognised as a transition point, at which the crystal morphology started to change from regular cuboid to hair-like nanoneedle shape. At the solution pH of 2.01, the length of the hair-like WO3 nanostructure further increased and reached as high as 100 aspect ratio, which means an order of magnitude increase over the applied pH range (see on Fig. 2).
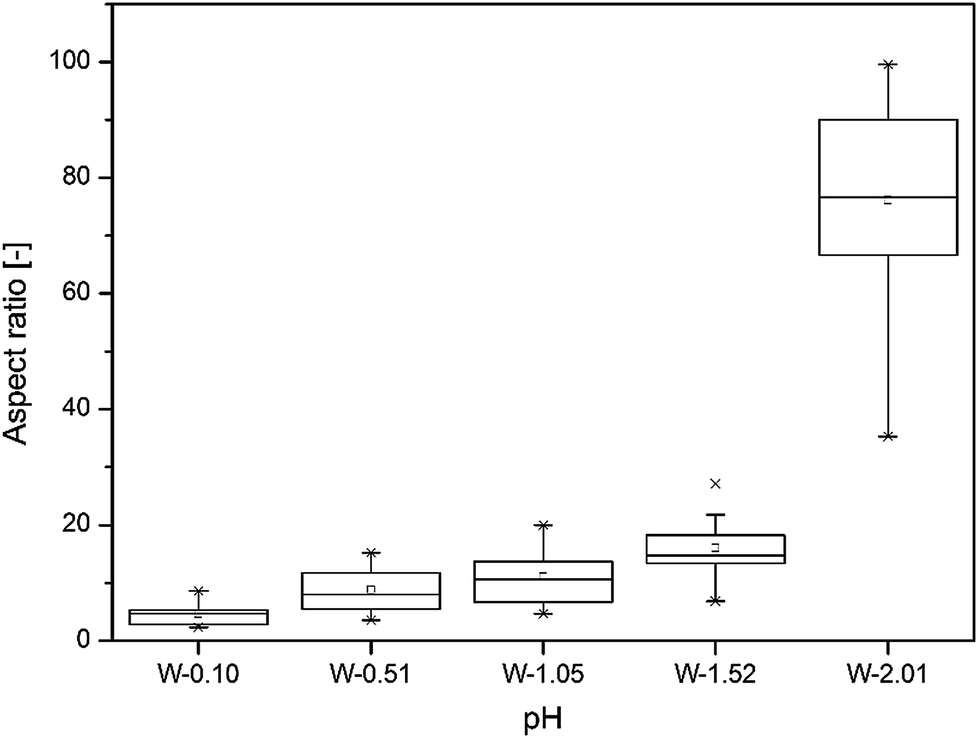 | ||
| Fig. 2 Box plot of the aspect ratio of the WO3 nanostructures as the function of the solution pH. | ||
The solution pH not only affected the size and shape of the WO3 nanomaterials, but also their crystalline phases significantly. Fig. 3a–e presents the XRD patterns of all samples discussed above. The reflections of all the samples were sharp and intensive, which suggests that the samples were well-crystalline. For W-0.10 the diffraction peaks were assigned to pure m-WO3 (JCPDS no. 43-1035). For the samples of W-0.51 and W-1.05, the m-WO3 co-existed with o-WO3·0.33H2O (JCPDS card no. 35-0270). No other crystalline species could be unambiguously detected in the diffraction pattern. For W-1.52 the presence of some o-WO3·0.33H2O was still detectable but the aforementioned W-1.52 and W-2.01 samples were indexed to h-WO3 with some indication of NH3 incorporated into the crystal lattice in the form of ((NH4)0.33−xWO3−z) (JCPDS card no. 58-0151). For simplicity, we refer to this phase by h-WO3.
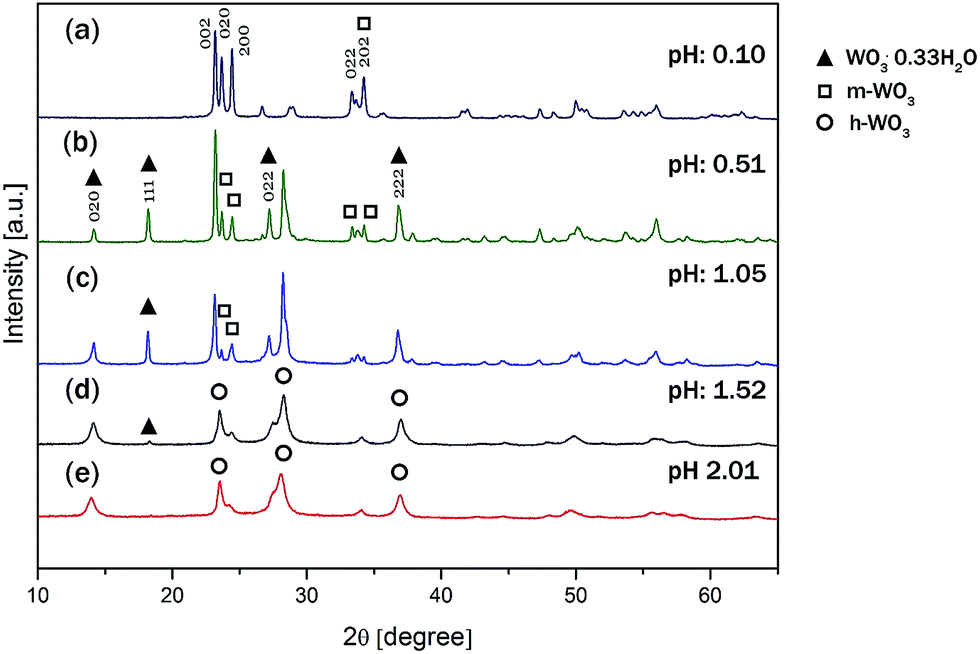 | ||
| Fig. 3 XRD pattern of (a) W-0.10, (b) W-0.51, (c) W-1.05, (d) W-1.52, (e) W-2.01. | ||
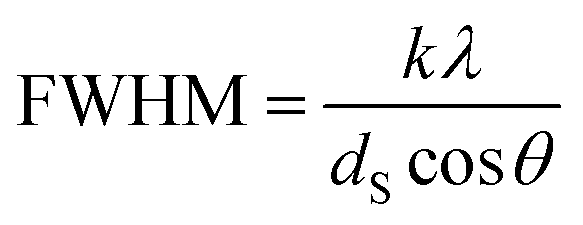
The crystallite sizes of the nanomaterials were estimated from the Bragg reflections by using the Scherrer formula (k = 1, λ = 1.542 Å) as can be seen in eqn (1), where FWHM is the full width of the peak at half maximum, k is the shape factor, λ is the wavelength, dS is the Scherrer diameter, θ is the diffraction angle.
 | (1) |
The measured peak broadening was corrected to instrumental function and the contribution of microstrains was assumed to be negligible during the calculation. The shape factor k = 1 allowed us to predict the variation of the crystallite sizes over the pH range as the relative trend of predicting crystallite sizes by using different k values between 0.8 and 1.1 showed good correlation to each other as shown in Fig. 4.
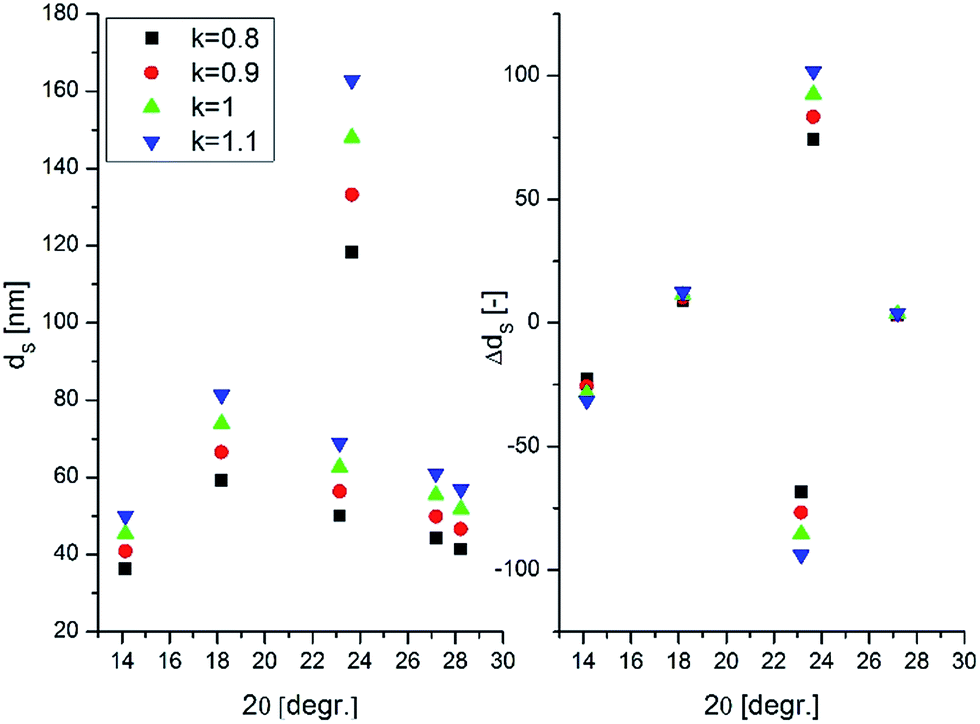 | ||
| Fig. 4 Variation of predicted crystallite dimensions of W-1.05 with the shape factor k. | ||
The calculated Scherrer dimensions for individual Bragg reflections confirmed the anisotropic crystal growth of the samples and helped to identify the crystal phases at each pH level. For example in the XRD pattern of W-0.51, the (020) (hkl) plane was more exposed to crystal growth relative to (200) which was indicated by the estimated crystallite sizes of 98 nm and 68 nm, respectively. As a result of the pH change from 0.10 to 1.05, the crystallite sizes calculated for the (020) facet of m-WO3 increased significantly from 80 nm to 156 nm, which could imply the trend of growing nanostructures. This is in good agreement with the SEM images. However at pH 1.05, the crystallite sizes of both m-WO3 and o-WO3·0.33H2O was greater than 60 nm, therefore none of the reflections could explain the ca. 10 nm thick nanoneedle phase. Potentially two reasons can be accounted for this discrepancy. The calculation based on the assumptions might not predict the Scherrer sizes accurately or another crystal phase is possibly present in the mixture. The underlying fact, that h-WO3 was formed with similar nanoneedle or nanowire morphology at higher pH values of pH 1.52 and 2.01, makes us believe that the nanoneedle phase at pH 1.05 is probably h-WO3. The peaks of h-WO3 cannot be unambiguously detected in the XRD pattern because all the characteristic reflections coincide with peaks of the two other crystal phases. Additionally, the peaks of h-WO3 are expectedly less intense and more broadened, therefore the peaks could be easily hidden in the diffractogram.
The mechanism of crystal formation is usually explained by the nucleation theory proposed by LaMer and Dinegar.20,22,32,33 However it is, sometimes, insufficient to explain experimental observations.22 Our findings could not be satisfactorily interpreted by the aforementioned theory, therefore we further investigated the potential reasons.
As shown in eqn (2) and (3), the formation of WO3 nanoparticles is pH-dependent, the number of initially generated nuclei is therefore correlated to the degree of acidity.22
| WO42− + 2H+ → H2WO4 | (2) |
| H2WO4 → WO3 + H2O | (3) |
The rate of the two main steps, the crystal nuclei formation and the crystal growth, depends on the level of supersaturation of the system. In a highly acidic medium, many crystal nuclei are formed rapidly due to the high level of supersaturation and therefore the subsequent crystal growth is the rate-determining step. Under less acidic condition, however the opposite is true. Hence, in highly supersaturated systems more but smaller crystals are expected to be formed whereas in less supersaturated systems fewer but bigger structures could be expected.
Our experimental results showed that the increase in pH from 0.1 to 0.52 resulted in a considerable size growth which is in agreement with this theory; however this trend did not continue when the solution pH was greater than 1.05. The appearance of the fine nanoneedle phase at pH 1.05 could not be interpreted from the viewpoint of supersaturation anymore.
In order to explain the mechanism of the crystal growth in our system we carefully studied the affecting factors over the pH range. It was found that the aforementioned mechanism fails to explain the experimental results at the transition point of pH 1.05, where monoclinic and hexagonal phases with different morphologies co-existed. At this point, not only the preferred crystalline phase was changed, but the morphology was drastically affected as well. For nanoscale materials, the stability, which depends greatly on the morphology, is a highly relevant question, especially for metastable crystalline phases such as the hexagonal WO3.24,34 Therefore, the interaction of the morphology and the crystalline phase may be one of the important factors leading to the unexpected morphology evolution. The crystalline phases could prefer certain morphologies, whereas the morphology, in return, could affect the stability of the nanomaterial. This is supported by the fact that h-WO3 can be commonly synthesised in 1D shape, which suggests that this spatial arrangement is beneficial for stabilizing the metastable hexagonal channel structure.4,34–39 By contrast, m-WO3 was rarely reported in 1D shape and most of the reports employed a seed-aided substrate to direct the 1D crystal growth.31,40,41 In a recent review, Zheng et al. also stated that the crystal phase and morphology are closely related, and “the morphology of the nanostructures can have a significant effect on obtaining stable phases”.16 Therefore, the crystallization mechanism at the transition point of pH 1.05 could be due to the interaction between the crystal phase and the morphology, i.e. the crystal phase stability could drive the morphology of the nanostructures and sometimes surpass the effect of supersaturation.
The sudden decline in the size of WO3 nanostructures under strong acidic condition (pH 0.2–0.7) was reported by Iwu et al. who studied a urea-assisted system in acetic acid medium and observed a significant size drop of WO3 as a response to a solution pH decrease from pH 0.7 to 0.2.42
3.2 The effect of PEG
PEG has been often used as surface modulator in hydrothermal processes to promote anisotropic crystal growth of semiconductor oxides such as ZnO43 or WO3.31 PEG is believed to be able to control the crystal growth through effective coordination and interaction with WO3 at the early stage of crystallisation when adsorbing onto crystal surfaces.44 In order to confirm the effect of PEG on the crystal growth kinetics and on the morphology of WO3 in comparison with other factors PEG 3350, PEG 20 000 and PEG 200 000 have been used as capping agent at two different pH levels; at pH 0.10 ± 0.04 and pH 1.50 ± 0.04.The results showed that the typical cuboid and nanoneedle morphology at pH 0.1 and 1.5 was preserved for all polymeric surface modulators. Similarly, at pH 0.1 the crystal phase was pure monoclinic WO3 whereas at pH 1.5 the dominant phase was hexagonal with co-existing o-WO3·0.33H2O. Although the peak intensity of peak positioned at ca. 18° decreased slightly relative to the peak at ca. 14° in the case of W-1.5-20E compared to W-1.5-3350 and W-1.5-200E, the variation of the chain length of PEG did not show significant effect on the crystalline structure or on the morphology of the nanomaterials.
At pH 0.1 all the samples made with different PEG exhibited similar nanoplate morphology with the characteristic dimension of couple of hundred nm in length and 30–50 nm in thickness (Fig. 5). The XRD pattern confirmed that all the samples could be assigned to pure m-WO3. Similarly, at pH 1.5 all the nanostructures consisted of 5–15 nm thick and ca. a hundred nm long nanoneedles. The thin nanoneedles preferred to form a star-shape assembly which was characteristic of all three samples.45 No clear distinction was observed between samples prepared at pH 1.5 with different PEGs. The XRD reflections of samples prepared at pH 1.5 is shown on Fig. 5. All the samples were interpreted as a mixture of h-WO3 and o-WO3·0.33H2O; although the intensity of peak at ca. 18° decreased in the XRD pattern of W-1.5-P20E compared to W-1.5-P3350 and -P200E samples.
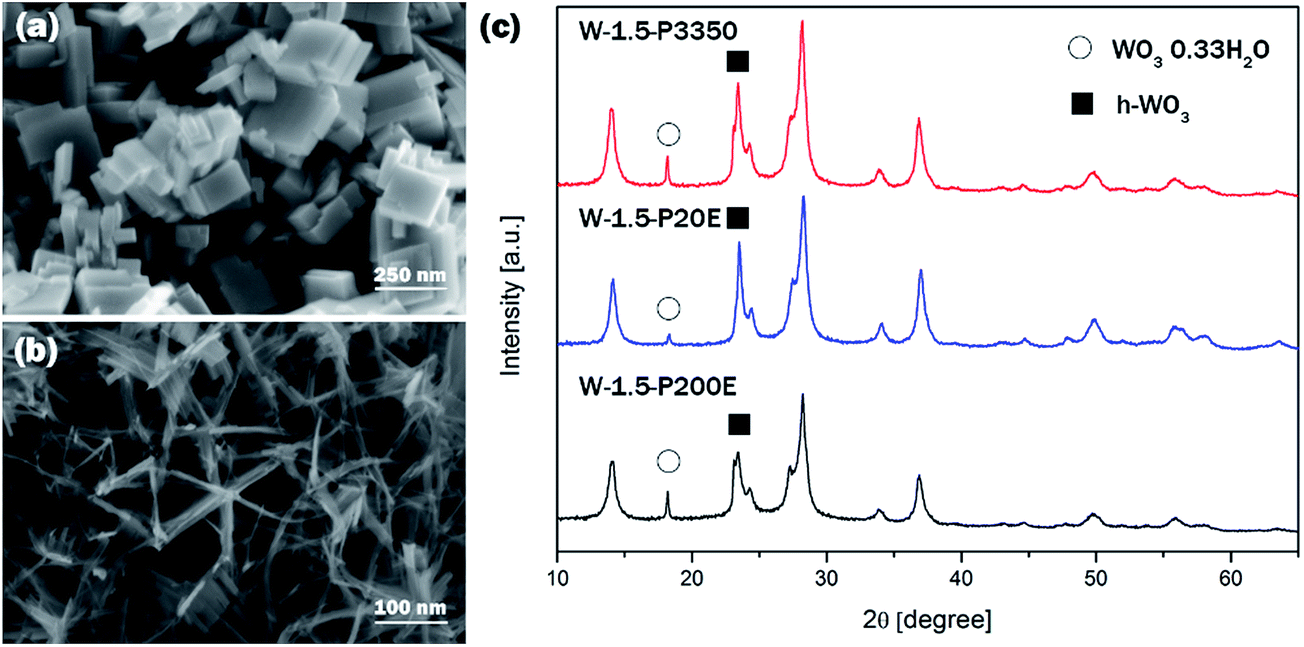 | ||
| Fig. 5 Typical SEM images of (a) samples prepared at pH 0.1, (b) samples prepared at pH 1.5, (c) XRD pattern of the samples prepared at pH 1.5. | ||
PEG with various carbon lengths did not show significant effect on the crystal growth or on the morphology of the WO3 nanomaterials.
3.3 The effect of EtOH in the precursor solution
The affinity of PEG as surface modulator towards the crystal nuclei could be influenced by the employed medium.43 Therefore, the effect of EtOH/H2O mixed solvent medium was studied on the morphology, crystal phase and optical properties of WO3 nanostructures at pH 1.68.SEM and TEM images of W-EtOH are presented in Fig. 6a and b. Comparing Fig. 6 with 1d, it can be seen that the h-WO3 with nanoneedle morphology synthesised at pH 1.68 with the addition of EtOH was similar to the EtOH-free samples at pH 1.52. The 1D nanostructures measured up to 15 nm in thickness and ca. a hundred of nanometer in length. The XRD pattern confirmed that h-WO3 was formed (see Fig. 6).
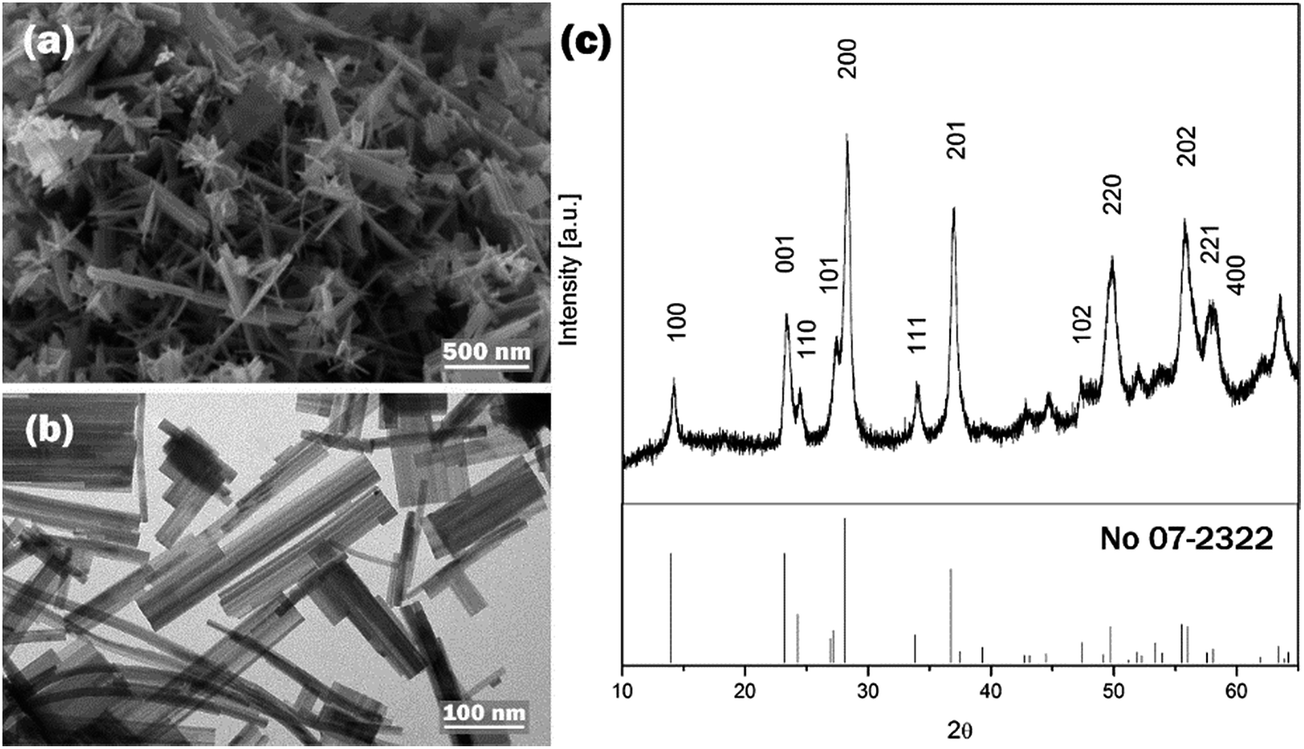 | ||
| Fig. 6 (a) SEM, (b) TEM and (c) XRD pattern of W-EtOH. | ||
Although the introduction of EtOH in the precursor solution did not affect significantly the crystal phase or the morphology of the final product but the colour of the solid sample turned into greyish blue from the expected pale yellow as was found in the case of all ethanol-free samples, except W-2.01 (see on Fig. 8). The colorization of WO3 from light yellow into blue is a well-known phenomenon and attracted many researchers' interest due to potential application as smart windows and potential energy saving displays.3 Electrochromism and gasochromism are the most common ways to achieve colour change in WO3. In the former case the application of electrical voltage and ion insertion22 whereas in the latter case the introduction of reducing gas atmosphere leads to colorization.46,47 Occasionally, other conditions could also result in blue WO3. Kurumada et al. for example demonstrated that very fine WO3 particles (characteristic diameter below 10 nm) exhibited blue colour.48 To the best of our knowledge no other report has associated colour change with the use of EtOH yet. To further understand the change in WO3 colour, XPS tests was conducted in NEXUS centre at Newcastle to analyse the binding energy of O and W on the surfaces of the blue WO3 and light yellow WO3 samples. The results (Fig. 7) indicate that the binding energy for O and W on blue WO3 surface is very different from that on light-yellow WO3. For example, the peak for W 4d5/2 binding energy at 244 eV is much weaker than that on the light yellow WO3, and W 4d3/2 is shifted from 253 eV (light-yellow WO3) to 257 eV (blue WO3). W 4f binding energy for light yellow sample gives 3 peaks, rather than 2 peaks on the blue sample surface. The additional peak is W 4f7/2 at around 30 eV. These indicate that, even though their crystal phases are the same, the surface chemistry of the two samples is very different and complex. The colour difference may be due to the different surface chemistry or adsorptions.
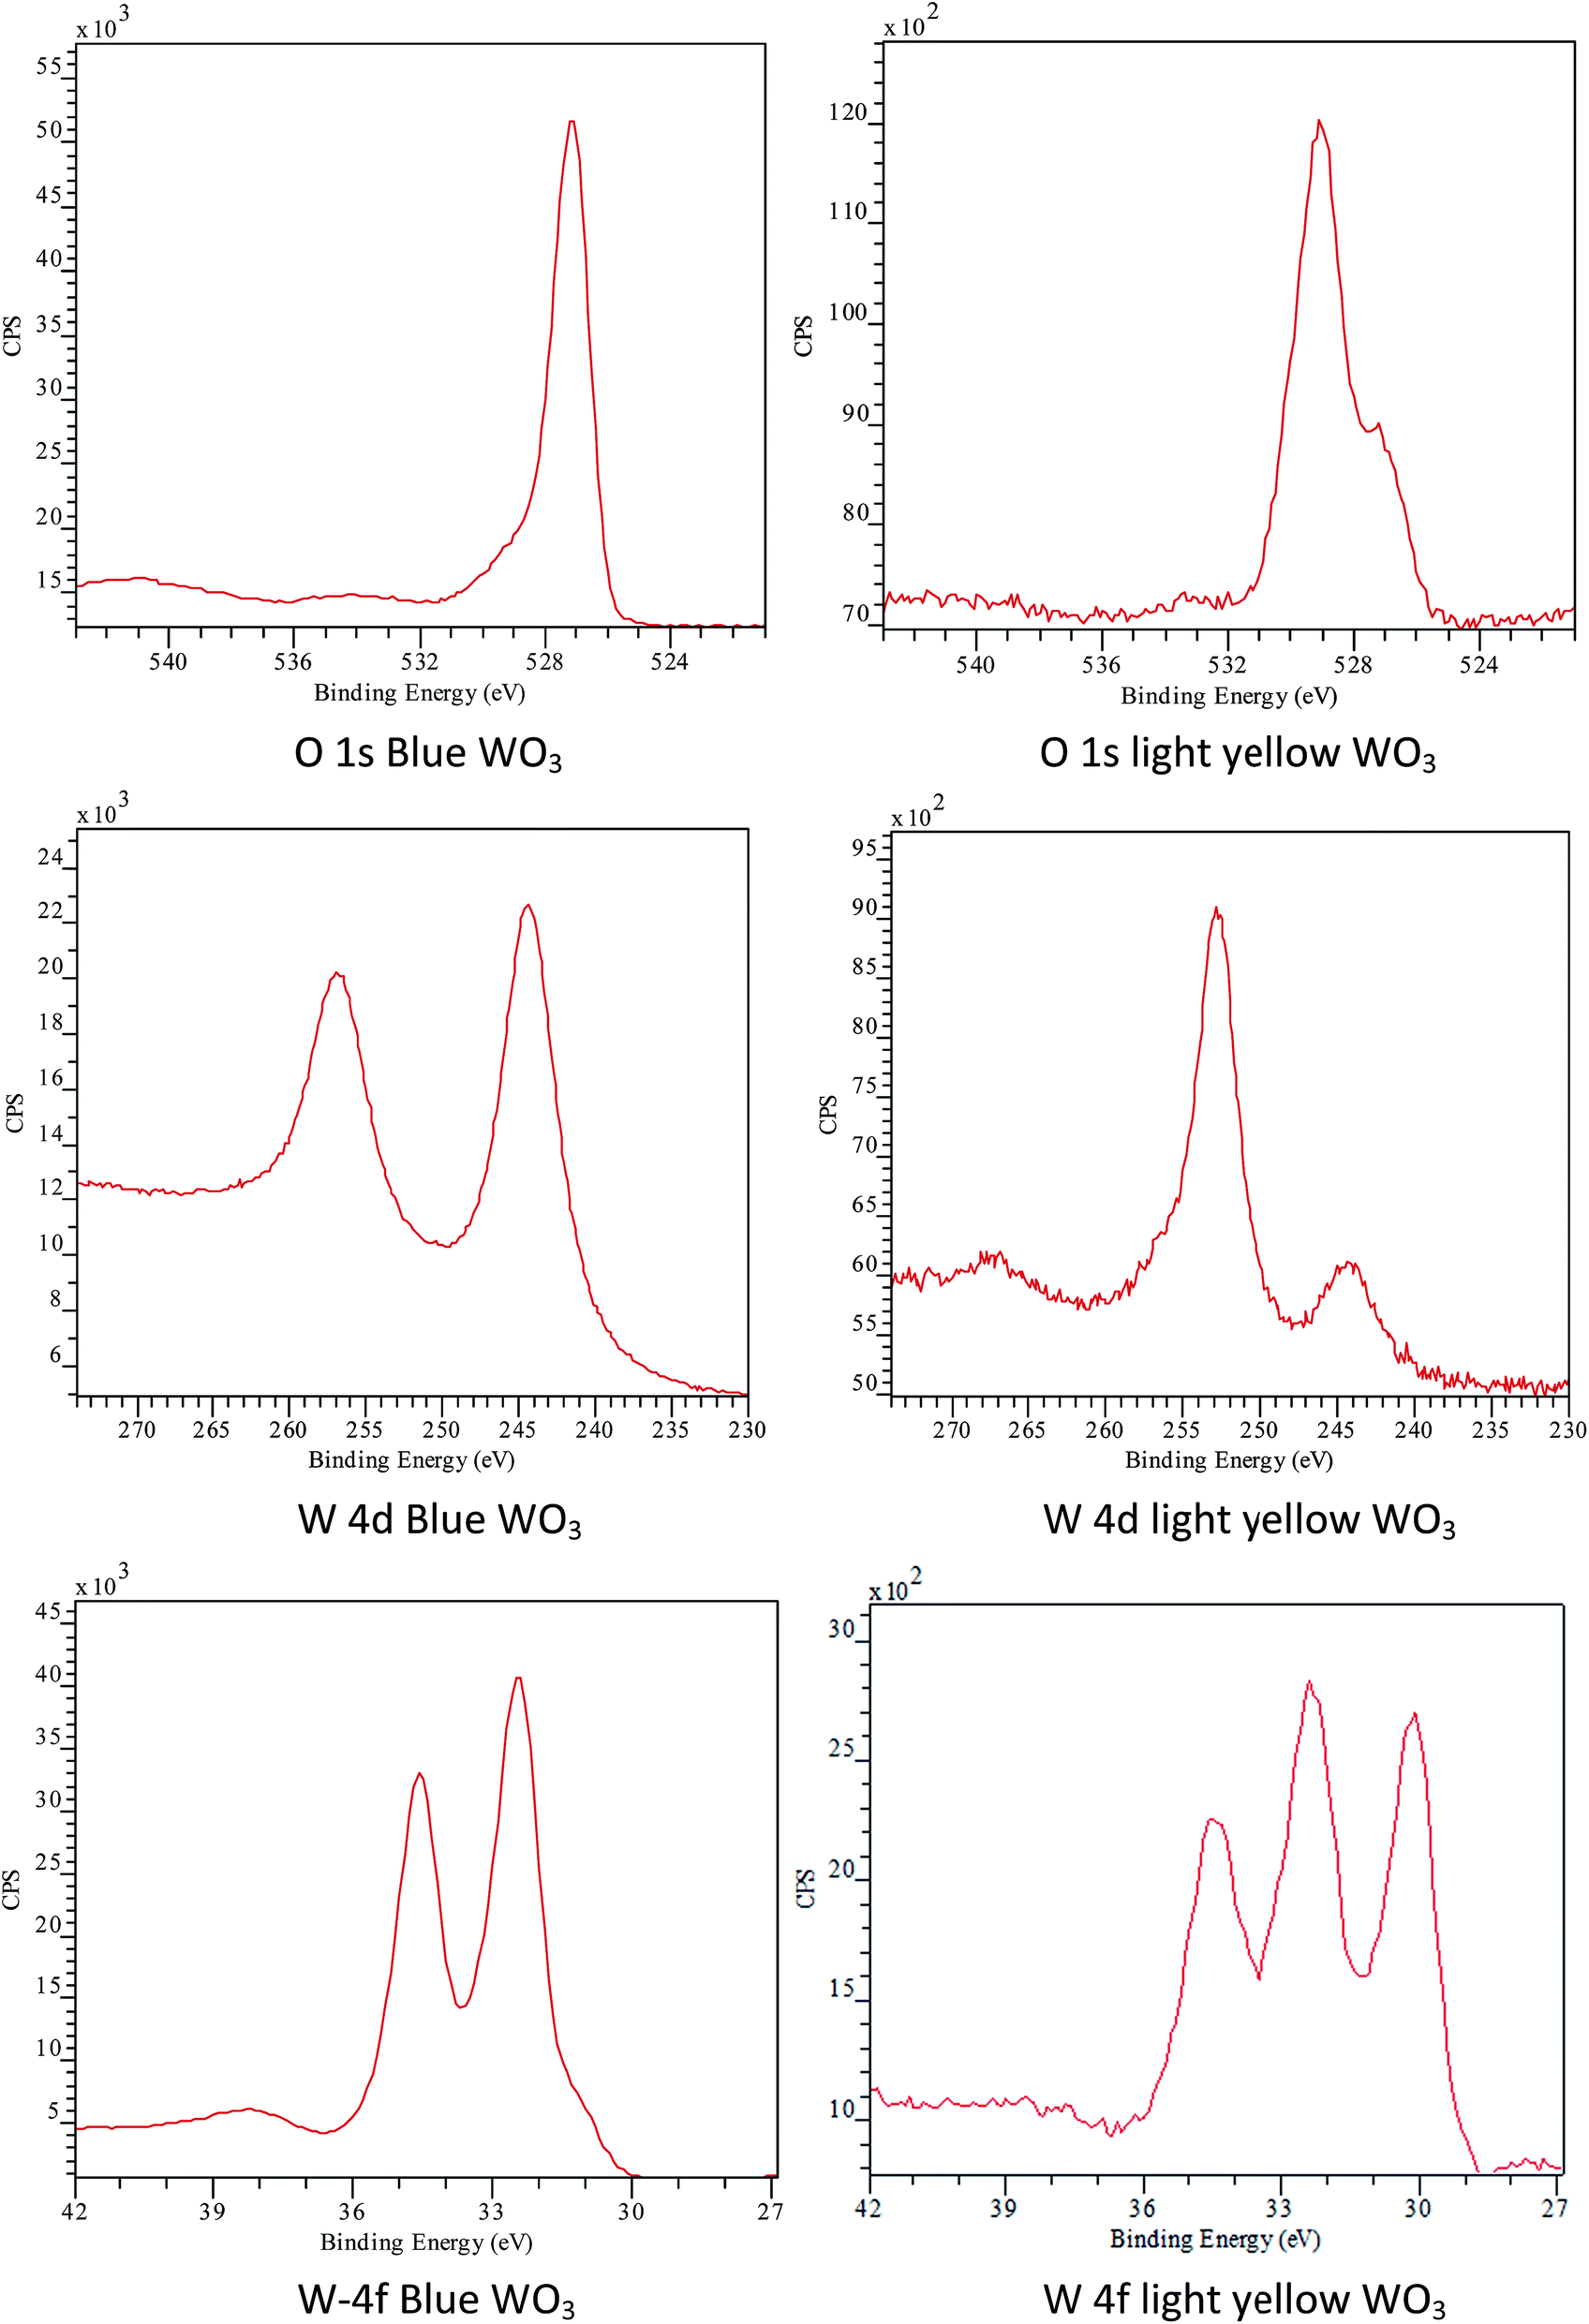 | ||
| Fig. 7 XPS results for blue WO3 and yellow-white WO3. | ||
In order to investigate further the effect of blue colour, the optical properties of blue WO3 was studied by solid state UV-vis diffuse reflectance. The blue WO3 had different absorption profile relative to yellow WO3 samples in general, as the light absorption for W-EtOH did not tail off after a sharp drop but started to rise again in the further red region of the visible spectrum. This indicates absorption in the far visible/near infrared region which could explain the blue colour of the sample. The transmission window in the intermediate visible region is a good indication that in-gap localized energy states have been formed. The apparent band gap of W-EtOH was calculated to be 3.13 ± 0.03 eV which is a much higher value than the reported band gap for bulk WO3 (Eg: 2.62 eV) due to quantum confinement effect.16 Previously, Szilágyi et al. reported that after preparing WO3 nanoparticles under reducing atmosphere the oxidation state of surface W atoms partially changed from W6+ to W5+.47 Xu et al. revealed that newly localized in-gap-state defect band was created through the coloration process by the presence of oxygen vacancies.6 It was reported in the literature that the oxidation states of the W atoms also affects the d-spacing values of the nanostructures.49 It was found that the yellow WO3 sample showed smaller d-spacing values for the (200) and (202) planes, while bigger value was reported for the (002) crystal plane, corresponding to partially reduced blue WO3. Our blue W-EtOH sample and the yellow W-1.52 showed similar trend. The d-spacing values corresponding to (200) and (202) of W-EtOH were found to be 0.3167 nm and 0.2444 nm, respectively; whereas 0.3156 nm and 0.2432 nm were determined for the yellow W-1.52 sample. For the (002) plane, 0.3847 nm and 0.3784 nm was found for the W-EtOH and W-1.52 samples, respectively. These trends agree well with the findings reported in the literature. The blue colour and the optical properties indicated partially reduced structure of the blue W-EtOH sample.
3.4 Optical properties, UV-vis diffuse reflectance
In order to examine the correlation between solution pH and the corresponding band gap energies (Eg), the optical properties of the as-prepared samples have been explored by solid-state UV-vis diffuse reflectance. Smaller Eg values (2.70 eV) were found for m-WO3 samples (W-0.10, W-0.52) whereas bigger Eg energies (2.93–3.10 eV) were determined for h-WO3 samples (W-1.52, W-2.01). This observed trend can be explained by the different crystalline structure and quantum confinement effect (QC). The absorption profiles of W-2.01 and W-EtOH were different from the rest of the samples as the light absorption started to rise again in the far visible region after the apparent band edge.It is known that the absorption of the incident photons close in energy to the band gap follows an exponential trend which is often referred as Urbach tail.50 Above this critical energy, which is a consequence of electrons excited over the band gap, the behaviour of the optical absorption of indirect type transitions starts to obey the power law written as follows.12
| hνα = C(hν − Eg)2 | (4) |
The band gap energies (Eg) can be evaluated using the absorption coefficients (α) and the photon energies (hν) based on eqn (4) where C is a general constant.51 The graphical representation of this law is called Tauc plot. The optical band gap energies can be determined from the graphs by drawing a tangent line to the inflexion point in the high absorption region of the curve and extrapolating a tangent line to α(hν) = 0 (see on Fig. 8).
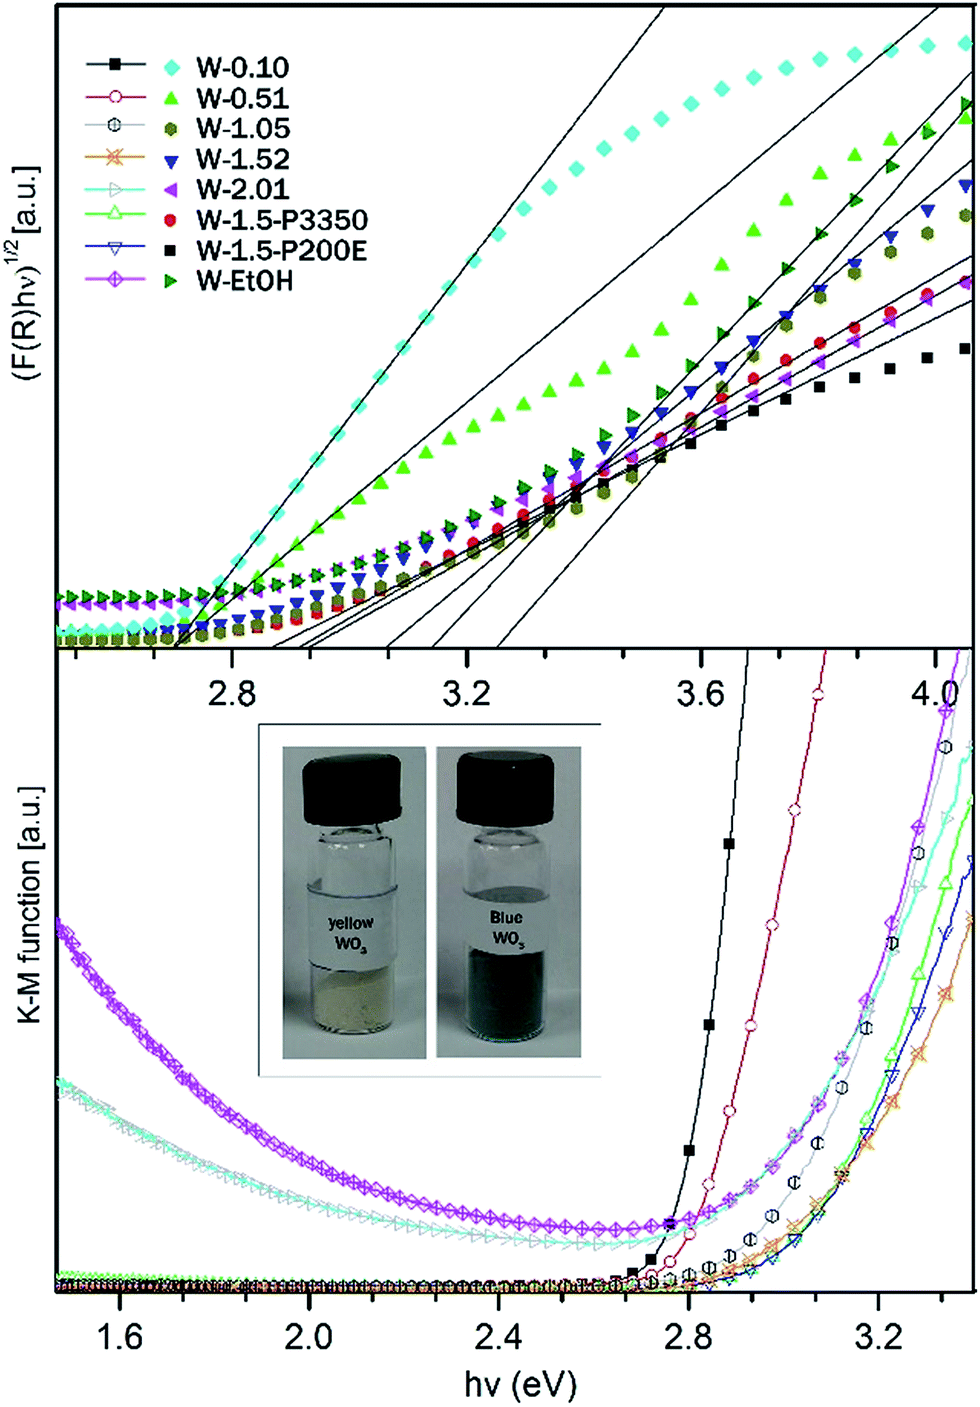 | ||
| Fig. 8 Determination of Eg from diffuse reflectance spectra (a) Tauc plot, (b) K–M function versus photon energy. | ||
In addition to the Tauc plot, the Kubelka–Munk (K–M) function was also calculated in order to study the light absorption behaviour of the samples. eqn (5) shows the K–M function, where R is the absolute reflectance, k is molar absorption coefficient, s is the scattering coefficient.
 | (5) |
For the WO3 samples prepared in this study, the calculated band gap energies ranged from 2.7 ± 0.03 eV to 3.25 ± 0.03 eV (see in Table 1), which is in agreement with the values for WO3 nanostructures reported in literature.42,52,53 The W-0.10 and W-0.52 samples possessed the smallest band gap (Eg = 2.70 eV) among the prepared nanostructures. Whereas an obvious blue shift towards higher band gap energies (Eg = 2.93–3.25 eV) was observed in the absorption threshold of W-1.05, W-1.52 and W-2.01 samples relative to W-0.10 and W-0.52. Theoretical and experimental results suggested that the distortion of WO6 octahedra in the crystal structure of WO3 can increase the band gap.54–56 It was also shown, that typically the band gap takes smaller values for m-WO3 and bigger values for h-WO3 owing to structural differences.57 In agreement with the literature, we found that W-0.10 and W-0.52 m-WO3 samples possessed the lowest band gap energies among the samples. Whereas the h-WO3 samples (W-1.52 and W-2.01) showed broader band gap.
In addition to the effect of the crystal phase, the size of the nanostructures also play a dominant role in the optical properties. As shown earlier, nanostructures smaller than 100 nm exhibit a weak quantum confinement effect (W-QC), and give a broaden band gap.57 The QC effect gets stronger once the size of the nanomaterials approaches the Bohr radius which is 3 nm for WO3.16,58 In view of this, the apparent blue shift in the Eg for the fine nanoneedle h-WO3 phases (W-1.52, W-2.01) can be further explained by the substantial size difference compared to the bigger nanoplates and nanorods of m-WO3 samples (W-0.10, W-0.51).
The K–M function confirmed that all of the samples absorbed the light up to a certain threshold which was approximated by the calculated band gap energies. However for W-2.01 and W-EtOH it was found that beyond the apparent band gap energies, the absorption started to rise again. Both samples had a bluish appearance in contrast to the typical yellow colour of the rest of the samples. The transmission window, which remained in the intermediate visible region between the apparent band edge and the re-increasing absorption in the red region, could be an indicator of in-gap localized energy states caused by reduced W atoms.47 WO3 nanomaterials are sensitive to the oxidation state of W atom and could turn to blue if the system reaches a level of reduced state. For W-EtOH sample the reduced state could be due to the excess amount of surface OH groups. For testing the hypothesis, W-EtOH was annealed in order to remove some of the excess OH groups from the surface. After thermal treatment at 250 °C for 12 h under air, as expected the blue colour faded away to off-white colour indicating that the system was re-oxidized. For W-2.01, the reduced structure could be attributed to the increased number of NH4+ in the hexagonal channel structure which was evidenced from the XRD pattern.
The relationship between the band gap and the pH is presented on Fig. 9. The calculated absorption edges reached a peak at pH 1.05. When the solution pH was lower or greater than this point, the band gap decreased significantly. This pH corresponds to the monoclinic/hexagonal phase transition where all the three crystal phases with different morphologies and sizes were present. Interestingly, among the hexagonal phase WO3 samples, the long h-WO3 nanowires at pH 2.01 had the smallest band gap (Eg = 2.93 ± 0.03 eV). This could be ascribed to the accommodation of excess amount of foreign cations (NH4+) into the crystal lattice as it was indicated in the XRD pattern. These cations could cause the band gap to be narrowed to some extent.
 | ||
| Fig. 9 Correlation between the solution pH and the Eg energies. | ||
3.5 Photocatalytic performance
The as-prepared WO3 nanostructures were tested for photocatalytic application. The decomposition of methyl orange (MO) as an organic dye was used as the indicator of the photoactivity. The proposed decomposition mechanism of the dye can be seen in eqn (6)–(8).| WO3 + hν → WO3 + eCB− + hVB+ | (6) |
| hVB+ + H2O → ˙OH + H+ | (7) |
| ˙OH + methyl orange → degradation products | (8) |
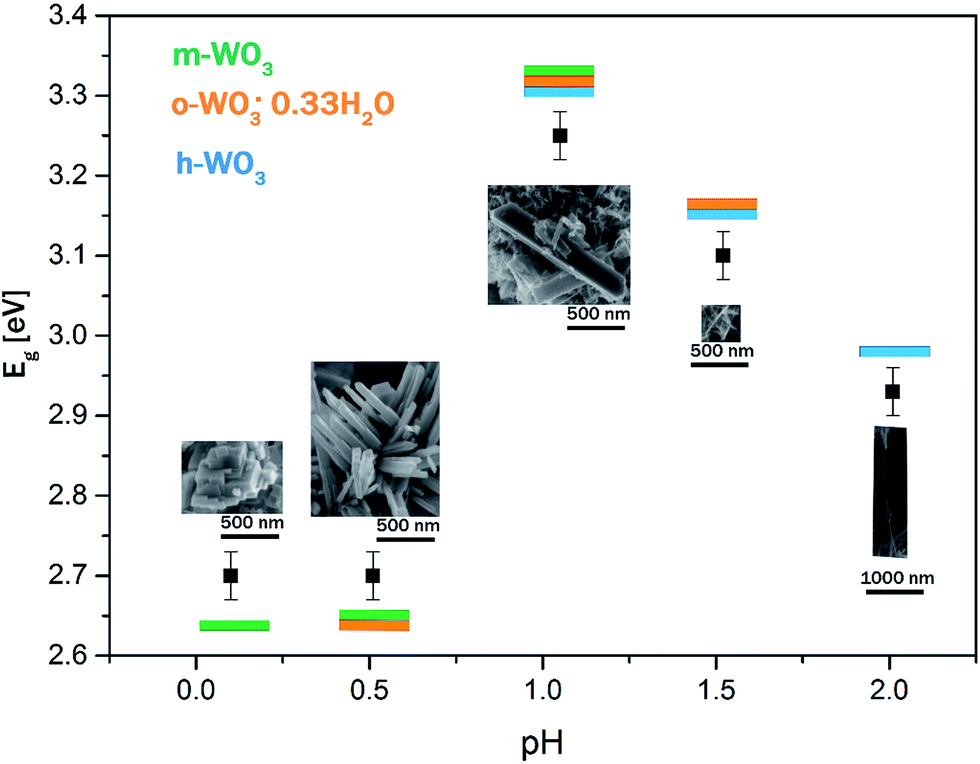
It was found that the crystal phase, the morphology and the composition of the nanostructures greatly influence the overall photo-efficiency (Fig. 10). The W-1.52 sample gave the best photocatalytic efficiency in this study and bleached 67% of the dye in 4 hours. It exhibited more than five times higher photocatalytic activity than the least efficient W-2.01 (photo-bleached 12%). The excellent performance of W-1.52 is attributed to the fine nanoneedle morphology and to the more oxidized composition. The blue samples (W-EtOH and W-2.01) exhibited generally less photoactivity due to the in-gap states created in the band gap which can act as recombination centres of the photo-induced charges.
 | ||
| Fig. 10 Photocatalytic performance of the as-prepared WO3 nanostructures. | ||
The photocatalytic efficiency of nano WO3 is a compromise of the band gap, crystal phase, morphology, and the oxidation state. The best catalyst W-1.52 has a band gap of ca. 3.2 eV which is higher than that of the least efficient catalyst W-2.01 (ca. 2.93 eV). W-1.52 was 10–15 nm thick nano-needles of h-WO3 with minor impurity phase of o-WO3·0.33H2O, while W-2.01 was high aspect ratio (ca. 100) ca. 10–15 nm thick nanowires of pure h-WO3. Their colours and optical behaviour was also notably different. The W-1.52 catalyst had yellow, whereas W-2.01 had blue colour which indicated the partially reduced oxidation state of the WO3 as evidenced from the diffuse-reflectance spectra. As the reduced oxidation states in W-2.01 form new in-gap energy levels in the forbidden band gap which can act as recombination centres, the remarkable improvement in the photo-efficiency of W-1.52 is likely to arise from the more oxidized composition of the W-1.52 catalyst. The role of the chemical composition of WO3 (considering the level of oxidation) was shown to play an important role in photocatalysis in the literature.47 Although the high aspect ratio nanowires (W-2.01) would be expected to enhance the photo-efficiency of the catalyst by providing less grain boundaries for the charge carriers to migrate to the surface of the catalyst,59 the majority of the charge carriers must be trapped by the defect states before reaching the surface which dramatically reduced the overall efficiency. After comparing the specific surface areas in Table 1 with the bad gap of the catalysts and their photocatalytic efficiency, it can be seen that there is no a clear relationship between specific surface areas and the photocatalytic efficiency.
The W-0.10 (ca. 2.7 eV) and W-1.05 (ca. 3.2 eV) samples had the best performance after W-1.52, photo-bleaching 59% and 54% of the dye by the end of the test, respectively. W-0.10 was pure monoclinic nanoplates, while W-1.05 was the mixture of the three crystal phases (h-, m-WO3 and o-WO3·0.33H2O) with a mixed morphologies of smaller nanoneedles and bigger nanorods. Both of them had pale yellow colour. W-0.1 had the smallest forbidden band gap (ca. 2.7 eV) among all the samples which means that this catalyst could theoretically absorb most of the irradiated light. By contrast, W-1.05 showed the highest band gap energy (ca. 3.2 eV) among the samples, yet exhibited similar efficiency to W-0.10 (ca. 2.7 eV). This shows that beyond the light absorption, the different morphology and the mixture of crystal structures in W-1.05 plays an important role. The presence of smaller nanoneedle phase in W-1.05 could enhance the photo-efficiency. And additionally, the contact of various crystal phases could beneficially affect the overall performance as it was shown for other nanostructures e.g. the mixture of anatase and rutile TiO2.60 These factors could counter-balance the effect of the wider band gap of W-1.05 and therefore result in a similar overall photoactivity than that of the smallest band gap catalyst, W-0.1.
The W-EtOH sample decomposed 36% of the initial MO which is a three times better performance than that of the other blue sample (W-2.01) but ca. half as good as the yellow W-1.52 sample with which the W-EtOH sample shares similar morphologies and crystal phase. It can be noted that the light utilization and charge migration was more efficient compared to the other blue W-2.01 sample but it still had a negative effect on the photoactivity as compared to W-1.52.
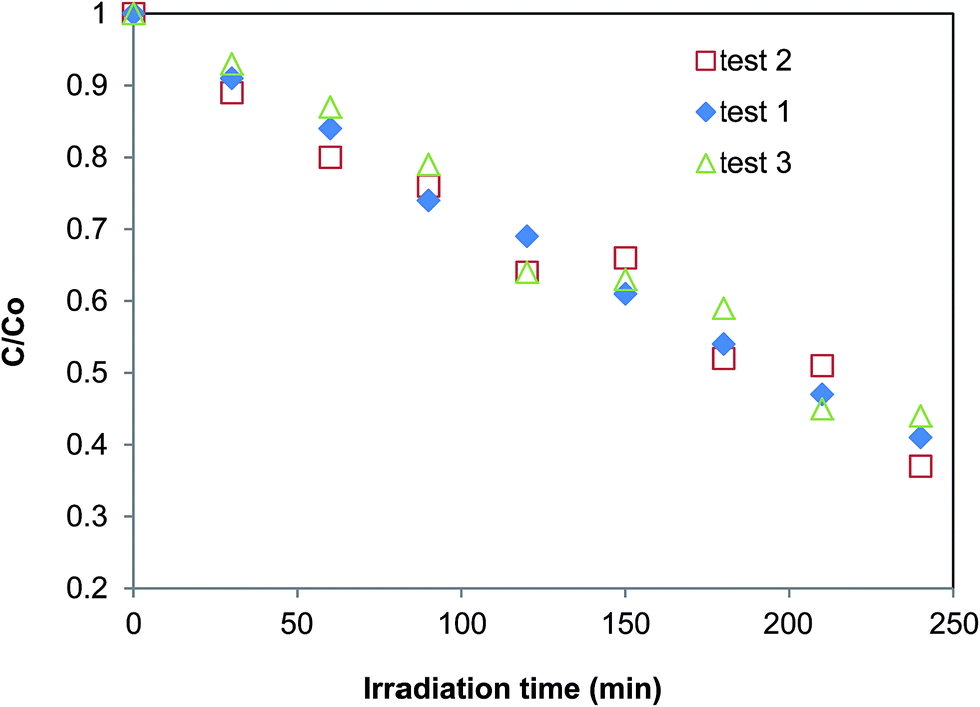
Fig. 11 presents the recycling tests for WO3 photocatalytic performance. W-0.10 catalyst was used as a sample. During the tests, the W-0.1 sample was separated from the MO solution by centrifugation after each experiment, and then washed by deionized water for 3 times to remove MO that was possibly entrained in the samples. The washed W-0.1 catalyst was then used for the next recycling test. The results show that the photocatalytic performance of W-0.1 was repeatable. During the 3 recycling tests, the photocatalytic performance did not show an apparent change. This agreed with the reports in literature: WO3 and its related structures have excellent stability61–63
 | ||
| Fig. 11 Recycling tests of W-0.1 photocatalytic performance. | ||
4. Conclusions
WO3 nanostructures synthesised by a facile hydrothermal method can be nanoplate, nanorod, nanoneedle and nanowire. The crystalline phase and the morphology of the hydrothermal products were determined by the solution pH in the first place. The pH 1.05 was a transition point for the monoclinic/hexagonal phase, crystal size and for the band gap. m-WO3 was preferentially prepared in a lower pH range of 0.10 and 1.05 whereas h-WO3 was favoured at a pH above 1.05. The aspect ratio of WO3 nanostructures increased significantly with the pH and reached as high as 100 at pH 2.01 where good quality nanowires were formed.The morphological evolution of the WO3 nanostructures could not be fully explained by the nucleation theory of LaMer and Dinegar. The appearance of fine nanoneedle phase at pH 1.05 could not be interpreted from the viewpoint of supersaturation and crystal nucleation. Considering the metastable nature of h-WO3 and the potential impact of morphology on the stability of the nanostructure, the crystalline phase may also play an important role in the determination of the morphology.
The band gap energies of synthesised WO3 nanostructures were ranged from 2.70 ± 0.03 eV to 3.25 ± 0.03 eV. The highest band gap was observed at pH 1.05, which was the transition point of crystal phases and morphology. The higher band gap energies of h-WO3 nanostructures in comparison to m-WO3 can be explained by the effect of QC and the crystal structure.
W-EtOH and W-2.01 samples exhibited blue colour while the rest of the samples were pale yellow. The absorption spectra of the blue samples revealed that the light absorption further increased beyond the apparent band gap energy in the far red region of the visible spectrum. The optical behaviour implied that in-gap states were formed due to reduced W atoms. Additionally, for the W-2.01 the accommodation of NH4+ ions into the crystal lattice resulted in a slight band gap narrowing.
The photocatalytic tests showed that the photocatalytic efficiency of nano WO3 is a compromise of the band gap, crystal phase, morphology, and the oxidation state. The best catalyst was W-1.52 (ca. 3.2 eV) which decomposed 67% of the dye by 4 hours light irradiation. The W-0.10 (ca. 2.7 eV) and W-1.05 (ca. 3.2 eV) samples decomposed 59% and 54% of the dye, respectively in spite of the fact that these samples had the lowest and highest calculated band gap energies, respectively. The blue samples (W-2.01 and W-EtOH) typically exhibited reduced photoactivity. Although the high aspect ratio nanowires (W-2.01) could expectedly enhance the photoactivity of the catalyst but the blue colour of the samples forecasted the presence of defect in-gap states in the band gap which acted as recombination centres for the photo-generated charges resulting in a dramatically lowered overall efficiency (12%).
Acknowledgements
D. Nagy and X. Fan greatly acknowledge the Principal Career Development Scholarship awarded by the University of Edinburgh and the support from the Royal Society of Edinburgh. The authors thanks to professor Neil Robertson for the solid state UV-Vis diffuse reflectance facility, to István Endre Lukács for the SEM measurements, to Stephen Mitchel for the TEM image, to Gary Nichol for the XRD facility, and finally to NEXUS for the XPS measurements, particularly to Dr Jose Portoles.References
- M. Hosenuzzaman, N. A. Rahim, J. Selvaraj, M. Hasanuzzaman, A. B. M. A. Malek and A. Nahar, Renewable Sustainable Energy Rev., 2015, 41, 284–297 CrossRef.
- A. Aubry, D. Y. Lei, A. I. Fernández-Domínguez, Y. Sonnefraud, S. A. Maier and J. B. Pendry, Nano Lett., 2010, 10, 2574–2579 CrossRef CAS PubMed.
- C. Y. Ng, K. Abdul Razak and Z. Lockman, J. Alloys Compd., 2014, 588, 585–591 CrossRef CAS.
- T. Peng, D. Ke, J. Xiao, L. Wang, J. Hu and L. Zan, J. Solid State Chem., 2012, 194, 250–256 CrossRef CAS.
- X. Wang, X. Meng, M. Zhong, F. Wu and J. Li, Appl. Surf. Sci., 2013, 282, 826–831 CrossRef CAS.
- J. Y. Luo, S. Z. Deng, Y. T. Tao, F. L. Zhao, L. F. Zhu, L. Gong, J. Chen and N. S. Xu, J. Phys. Chem. C, 2009, 113, 15877–15881 CAS.
- H. Ruda, J. Polanyi, J. Yang, Z. Wu, U. Philipose, T. Xu, S. Yang, K. Kavanagh, J. Liu, L. Yang, Y. Wang, K. Robbie, J. Yang, K. Kaminska, D. Cooke, F. Hegmann, A. Budz and H. Haugen, Nanoscale Res. Lett., 2006, 1, 99–119 CrossRef.
- E. Hulicius and V. Kubeček, in Lasers for Medical Applications, ed. H. Jelínková, Woodhead Publishing, 2013, pp. 222–250, DOI:10.1533/9780857097545.2.222.
- V. Endris, R. Penzel, A. Warth, A. Muckenhuber, P. Schirmacher, A. Stenzinger and W. Weichert, J. Mol. Diagn., 2013, 15, 765–775 CrossRef CAS PubMed.
- S. Singh, H. Mahalingam and P. K. Singh, Appl. Catal., A, 2013, 462–463, 178–195 CrossRef CAS.
- D. B. Hernandez-Uresti, D. Sánchez-Martínez, A. Martínez-de la Cruz, S. Sepúlveda-Guzmán and L. M. Torres-Martínez, Ceram. Int., 2014, 40, 4767–4775 CrossRef CAS.
- R. S. Vemuri, M. H. Engelhard and C. V. Ramana, ACS Appl. Mater. Interfaces, 2012, 4, 1371–1377 CAS.
- L. E. Brus, J. Chem. Phys., 1984, 80, 4403–4409 CrossRef CAS.
- A. Govindaraj and C. N. R. Rao, in The Chemistry of Nanomaterials, Wiley-VCH Verlag GmbH & Co. KGaA, 2005, pp. 208–284, DOI:10.1002/352760247x.ch8.
- H. Dong, Z. Wu, F. Lu, Y. Gao, A. El-Shafei, B. Jiao, S. Ning and X. Hou, Nano Energy, 2014, 10, 181–191 CrossRef CAS.
- H. Zheng, J. Z. Ou, M. S. Strano, R. B. Kaner, A. Mitchell and K. Kalantar-zadeh, Adv. Funct. Mater., 2011, 21, 2175–2196 CrossRef CAS.
- T.-D. Nguyen, Nanoscale, 2013, 5, 9455–9482 RSC.
- K. Byrappa and T. Adschiri, Prog. Cryst. Growth Charact. Mater., 2007, 53, 117–166 CrossRef CAS.
- L. Liu and Y. Yang, Superlattices Microstruct., 2013, 54, 26–38 CrossRef CAS.
- F. Zheng, M. Zhang and M. Guo, Thin Solid Films, 2013, 534, 45–53 CrossRef CAS.
- V. B. Patil, P. V. Adhyapak, S. S. Suryavanshi and I. S. Mulla, J. Alloys Compd., 2014, 590, 283–288 CrossRef CAS.
- J. M. Wang, E. Khoo, P. S. Lee and J. Ma, J. Phys. Chem. C, 2009, 113, 9655–9658 CAS.
- J. Huang, X. Xu, C. Gu, G. Fu, W. Wang and J. Liu, Mater. Res. Bull., 2012, 47, 3224–3232 CrossRef CAS.
- S. Adhikari and D. Sarkar, RSC Adv., 2014, 4, 20145–20153 RSC.
- S. Bai, K. Zhang, R. Luo, D. Li, A. Chen and C. C. Liu, J. Mater. Chem., 2012, 22, 12643–12650 RSC.
- A. Sonia, Y. Djaoued, B. Subramanian, R. Jacques, M. Eric, B. Ralf and B. Achour, Mater. Chem. Phys., 2012, 136, 80–89 CrossRef CAS.
- J. Zhang, X. L. Wang, X. H. Xia, C. D. Gu and J. P. Tu, Sol. Energy Mater. Sol. Cells, 2011, 95, 2107–2112 CrossRef CAS.
- E. E. Finney and R. G. Finke, J. Colloid Interface Sci., 2008, 317, 351–374 CrossRef CAS PubMed.
- T. Sugimoto, J. Colloid Interface Sci., 2007, 309, 106–118 CrossRef CAS PubMed.
- G. Salas, R. Costo and M. d. P. Morales, in Frontiers of Nanoscience, ed. M. d. l. F. Jesus and V. Grazu, Elsevier, 2012, vol. 4, pp. 35–79 Search PubMed.
- D. J. Ham, A. Phuruangrat, S. Thongtem and J. S. Lee, Chem. Eng. J., 2010, 165, 365–369 CrossRef CAS.
- I. Szilágyi, E. Santala, M. Heikkilä, M. Kemell, T. Nikitin, L. Khriachtchev, M. Räsänen, M. Ritala and M. Leskelä, J. Therm. Anal. Calorim., 2011, 105, 73–81 CrossRef.
- X. He, C. Hu, Q. Yi, X. Wang, H. Hua and X. Li, Catal. Lett., 2012, 142, 637–645 CrossRef CAS.
- J.-H. Ha, P. Muralidharan and D. K. Kim, J. Alloys Compd., 2009, 475, 446–451 CrossRef CAS.
- J. Wang, E. Khoo, P. S. Lee and J. Ma, J. Phys. Chem. C, 2008, 112, 14306–14312 CAS.
- P. Van Tong, N. D. Hoa, V. Van Quang, N. Van Duy and N. Van Hieu, Sens. Actuators, B, 2013, 183, 372–380 CrossRef.
- Z. Gu, H. Li, T. Zhai, W. Yang, Y. Xia, Y. Ma and J. Yao, J. Solid State Chem., 2007, 180, 98–105 CrossRef CAS.
- Z. Gu, T. Zhai, B. Gao, X. Sheng, Y. Wang, H. Fu, Y. Ma and J. Yao, J. Phys. Chem. B, 2006, 110, 23829–23836 CrossRef CAS PubMed.
- S. Salmaoui, F. Sediri, N. Gharbi, C. Perruchot, S. Aeiyach, I. A. Rutkowska, P. J. Kulesza and M. Jouini, Appl. Surf. Sci., 2011, 257, 8223–8229 CrossRef CAS.
- J. Y. Zheng, G. Song, C. W. Kim and Y. S. Kang, Nanoscale, 2013, 5, 5279–5282 RSC.
- C. Y. Ng, K. A. Razak, A. A. Aziz and Z. Lockman, J. Exp. Nanosci., 2013, 9, 9–16 CrossRef.
- K. O. Iwu, A. Galeckas, P. Rauwel, A. Y. Kuznetsov and T. Norby, J. Solid State Chem., 2012, 185, 245–252 CrossRef CAS.
- Z. Q. Li, Y. J. Xiong and Y. Xie, Inorg. Chem., 2003, 42, 8105–8109 CrossRef CAS PubMed.
- A. Wolcott, T. R. Kuykendall, W. Chen, S. Chen and J. Z. Zhang, J. Phys. Chem. B, 2006, 110, 25288–25296 CrossRef CAS PubMed.
- C. Balázsi, K. Sedlácková, J. Pfeifer, A. Tóth, E. Zayim, I. Szilágyi, L. Wang, K. Kalyanasundaram and P.-I. Gouma, in Sensors for Environment, Health and Security, ed. M.-I. Baraton, Springer, Netherlands, 2009, ch. 5, pp. 77–91, DOI:10.1007/978-1-4020-9009-7_5.
- A. Gupta, P. Ifeacho, C. Schulz and H. Wiggers, Proc. Combust. Inst., 2011, 33, 1883–1890 CrossRef CAS.
- I. M. Szilágyi, B. Fórizs, O. Rosseler, Á. Szegedi, P. Németh, P. Király, G. Tárkányi, B. Vajna, K. Varga-Josepovits, K. László, A. L. Tóth, P. Baranyai and M. Leskelä, J. Catal., 2012, 294, 119–127 CrossRef.
- M. Kurumada, O. Kido, T. Sato, H. Suzuki, Y. Kimura, K. Kamitsuji, Y. Saito and C. Kaito, J. Cryst. Growth, 2005, 275, e1673–e1678 CrossRef CAS.
- I. Szilágyi, I. Sajó, P. Király, G. Tárkányi, A. Tóth, A. Szabó, K. Varga-Josepovits, J. Madarász and G. Pokol, J. Therm. Anal. Calorim., 2009, 98, 707–716 CrossRef.
- C. G. Granqvist, in Handbook of Inorganic Electrochromic Materials, ed. C. G. Granqvist, Elsevier Science B.V, Amsterdam, 1995, pp. 139–146, DOI:10.1016/b978-044489930-9/50008-8.
- C. Li, B. Wang, H. Cui, J. Zhai and Q. Li, J. Mater. Sci. Technol., 2013, 29, 835–840 CAS.
- K. Huang, Q. Zhang, F. Yang and D. Y. He, Nano Res., 2010, 3, 281–287 CrossRef CAS.
- J. Yu, L. Qi, B. Cheng and X. Zhao, J. Hazard. Mater., 2008, 160, 621–628 CrossRef CAS PubMed.
- M. Gillet, K. Aguir, C. Lemire, E. Gillet and K. Schierbaum, Thin Solid Films, 2004, 467, 239–246 CrossRef CAS.
- G. A. d. Wijs, P. K. d. Boer, R. A. d. Groot and G. Kresse, Phys. Rev. B: Condens. Matter Mater. Phys., 1999, 59, 2684–2693 CrossRef.
- S. K. Deb, Sol. Energy Mater. Sol. Cells, 2008, 92, 245–258 CrossRef CAS.
- J. Su, X. Feng, J. D. Sloppy, L. Guo and C. A. Grimes, Nano Lett., 2010, 11, 203–208 CrossRef PubMed.
- S. K. Gullapalli, R. S. Vemuri and C. V. Ramana, Appl. Phys. Lett., 2010, 96, 171903 CrossRef.
- Q. Zhang, Y. Rui and L. Zhang, in Nanostructure Science and Technology, ed. B. Ding and J. Yu, Springer, Berlin Heidelberg, 2014, ch. 5, pp. 111–139, DOI:10.1007/978-3-642-54160-5_5.
- C. Yu, W. Zhou, J. C. Yu, H. Liu and L. Wei, Chin. J. Catal., 2014, 35, 1609–1618 CrossRef CAS.
- J. Yu and L. Qi, J. Hazard. Mater., 2009, 169, 221–227 CrossRef CAS PubMed.
- M. Qamar, Z. H. Yamani, M. A. Gondal and K. Alhooshani, Solid State Sci., 2011, 13, 1748–1754 CrossRef CAS.
- J. Liu, S. Han, J. Li and J. Lin, RSC Adv., 2014, 4, 37556–37562 RSC.
| This journal is © The Royal Society of Chemistry 2016 |