
 Open Access Article
 This Open Access Article is licensed under a Creative Commons Attribution-Non Commercial 3.0 Unported Licence
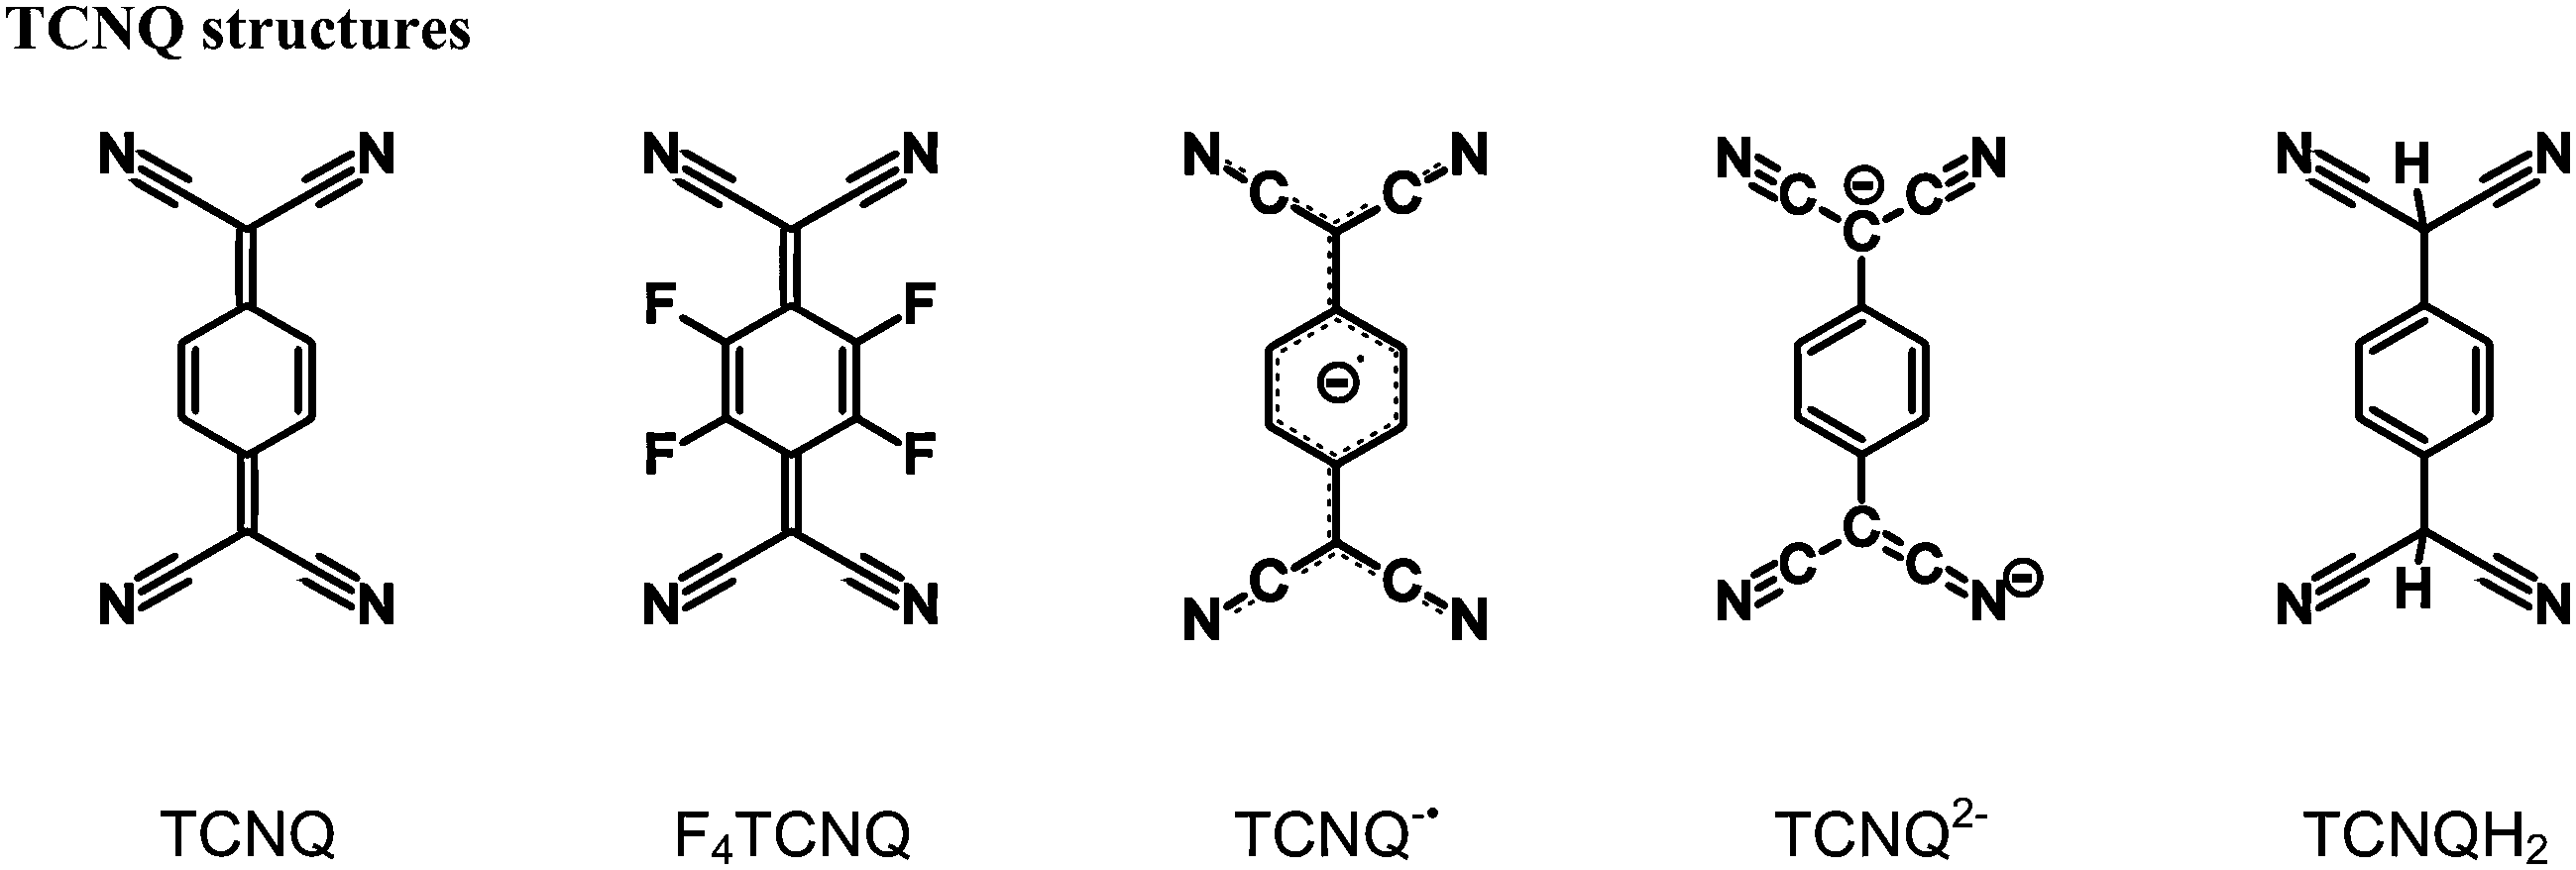
Structural and optical investigations of charge transfer complexes involving the radical anions of TCNQ and F4TCNQ†
Ashley L.
Sutton
a,
Brendan F.
Abrahams
 *a,
Deanna M.
D'Alessandro
b,
Timothy A.
Hudson
a,
Richard
Robson
*a and
Pavel M.
Usov
b
*a,
Deanna M.
D'Alessandro
b,
Timothy A.
Hudson
a,
Richard
Robson
*a and
Pavel M.
Usov
b
aSchool of Chemistry, University of Melbourne, Victoria 3010, Australia. E-mail: bfa@unimelb.edu.au; r.robson@unimelb.edu.au; Fax: +61 3 9347 5180
bSchool of Chemistry, University of Sydney, NSW 2006, Australia
First published on 9th November 2016
Abstract
The structures and optical band gaps of twelve radical anionic 7,7,8,8-tetracyanoquinodimethane (TCNQ) and 7,7,8,8-tetracyano-2,3,4,5-tetrafluoroquinodimethane (F4TCNQ) based charge-transfer complexes are reported. The compounds described have been categorised into three general types based upon solid-state arrangements of the donor and acceptor molecules. Crystallographic, EPR and IR spectroscopic investigations indicated that both TCNQ and F4TCNQ in each of the compounds described exist in the radical monoanion form. Visible-NIR absorption measurements indicate optical band gaps in the range of 0.79 to 1.08 eV. Whilst the packing arrangements in CT complexes are known to affect the band gap, in the cases considered here no clear relationship between the packing arrangement and the optical band gap is apparent. The results suggest that in the absence of mixed valency the packing arrangement does not impact significantly upon the magnitude of the optical band gap.
Introduction
Organic materials with interesting electronic properties such as conductivity have been the focus of considerable research for over half a century.1 7,7,8,8-Tetracyanoquinodimethane (TCNQ) has had a prominent role in the development of the field of ‘organic conductors’, most notably as part of the complex TCNQ–TTF (TTF = tetrathiafulvalene), which was the first reported purely organic material to exhibit a level of conductivity on a par with metals.2,3 Semi-conducting and conducting materials based upon TCNQ have since been reported.4,5The widespread interest in TCNQ as a component of charge-transfer (CT) systems is linked to its ability to exist in multiple, stable oxidation states. The neutral quinonoid form is a good π-acceptor6 that can undergo a one electron reduction to form the stable radical monoanion, TCNQ˙−, which in turn can serve as a π-donor anion. A further one electron reduction, gives the dianion of TCNQ, TCNQ2−, which acts as a strong π-donor.7
The high electrical conductivity of TTF–TCNQ is attributed to its mixed-valence state in which the TTF and TCNQ units exhibit charges of +0.59 and −0.59 respectively.8 The non-integer values for the charges reflect a similarity in the electron affinity of TTF+ and TCNQ. Thus the TTF–TCNQ system may be considered to be intermediate between the formal representations: TTF–TCNQ and TTF+–TCNQ−. Another factor that impacts upon the electrical conductivity of CT systems is the solid-state arrangement of the donor and acceptor units. This is neatly illustrated by the black and red polymorphs of TCNQ–TMTSF (TMTSF = tetramethyltetraselenafulvalene); the black crystals are very good electrical conductors whereas the red crystals are poorer conductors. Structural studies reveal that the red semi-conducting crystals are composed of infinite stacks of alternating donor and acceptor molecules. The black crystals have donor TMTSF molecules arranged in infinite parallel stacks carrying an overall positive charge, whilst the acceptor molecules are arranged in neighbouring infinite stacks possessing an overall negative charge.4,5 The segregated cationic and anionic stacks in the black crystals resemble those found in TTF–TCNQ.9 It is believed that high conductivity in such systems relies upon segregation of the stacks.10 An understanding of the factors that govern the packing arrangements of the cations and anions in such materials is clearly important in the generation of materials that possess specific and technologically useful electronic properties.
As indicated above, the dianionic form, TCNQ2−, is able to act as a π-donor, however it was reported to be susceptible to aerial oxidation11 and as a consequence has received only minor attention in comparison to the neutral and radical forms. Recent investigations have demonstrated that the acid form of the dianion, TCNQH2 (and F4TCNQH2) is both a stable and convenient precursor to TCNQ2− (and F4TCNQ2−) coordination polymers.12–19 Anionic coordination polymers (in which the π-donor is part of an infinite network) are of special interest because they offer the prospect of forming CT complexes, with appropriate π-acceptor countercations. The nature of the countercation is particularly important because it affects not only the magnitude of the CT interaction but also the structure of the anionic network.15 Accordingly, we have explored the use of a wide variety of countercations that could potentially serve as π-acceptors. Whilst the main thrust of our investigations has been on coordination networks, the scope of the work has been expanded to include CT complexes involving uncoordinated TCNQ2− and F4TCNQ2− anions in order to assess the extent and nature of the CT interactions in the absence of metal centres.7,20 This work has provided a clear indication that the choice of cation has a significant impact upon both the packing arrangement and the optical band gap.
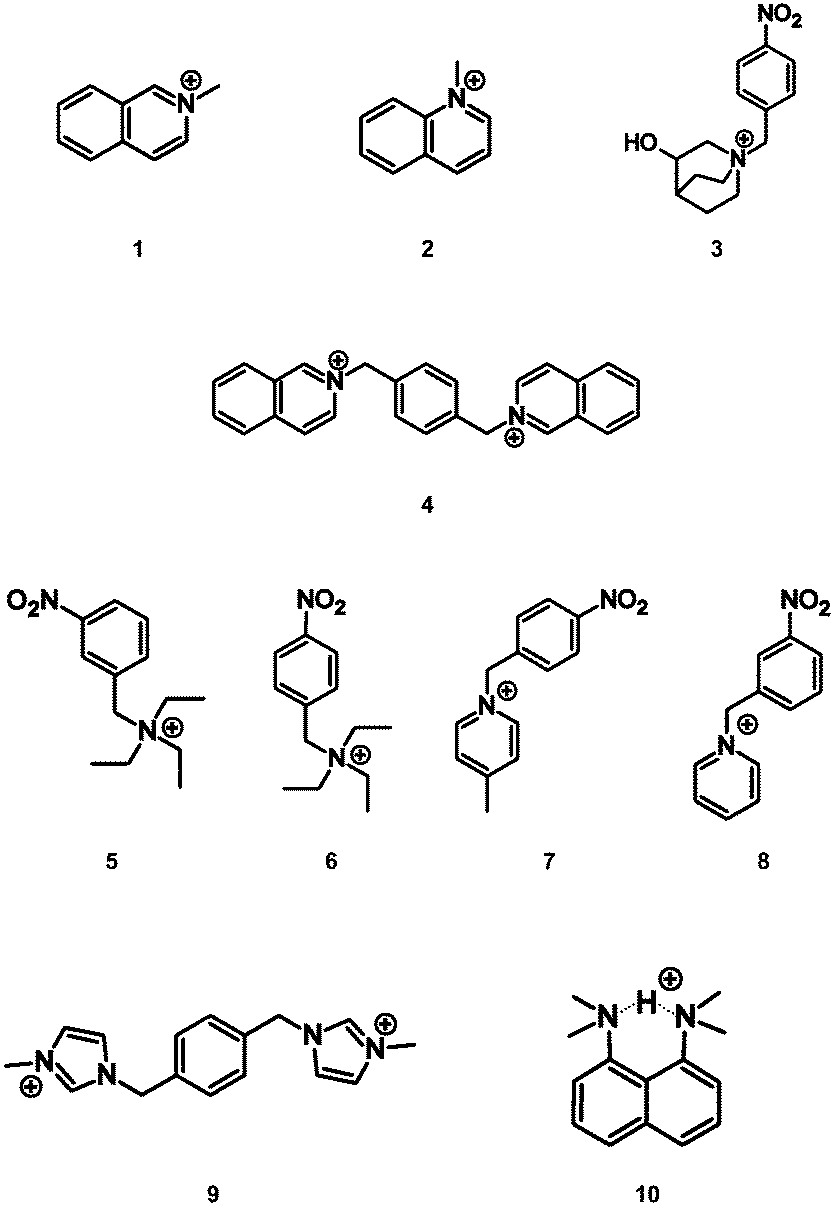
In the attempted synthesis of some TCNQ2− and F4TCNQ2− salts, aerial oxidation resulted in the formation of ionic solids involving the radical anions, TCNQ˙− and F4TCNQ˙−. Here we report salts of either TCNQ˙− or F4TCNQ˙− with cations 1 to 10. Interestingly, it was found that the direct combination of the monoanionic form (TCNQ˙− or F4TCNQ˙−) with the aromatic cations (1–10) yielded a homogenous product, however the highest quality single crystals were obtained from the solutions in which the dianionic form (TCNQ2− or F4TCNQ2−) underwent slow oxidation. In this current work the syntheses, structural characterisation and spectroscopic analyses of twelve novel radical anionic TCNQ˙− and F4TCNQ˙− CT complexes, with the acceptor cations 1–10, are described. It is hoped that this investigation will provide insight into how packing arrangements between the TCNQ˙− (and F4TCNQ˙−) anions and a variety of cations may impact upon the observed optical band gaps.
Results and discussion
Structural analyses of the complexes reveal a variety of packing arrangements of the donor anions and acceptor cations. Schematic representations of the packing types are shown in Scheme 1. The type I motifs (Ia and Ib) consist of parallel stacks incorporating both donors (TCNQ˙−/F4TCNQ˙−, black rectangles) and acceptors (cations, white rectangles). In the type II structures (IIa, IIb and IIc) the donors and acceptors are in separate stacks and in type III there are no discernible stacks. It should be noted that the structural types indicated in Scheme 1 are idealised representations and that the mean planes of the cations and anions within the stacks are commonly inclined to the stacking direction. | ||
| Scheme 1 Schematic representations of structural types I–III. The black and white rectangles represent the radical anions (TCNQ˙− or F4TCNQ˙−) and the cations respectively. | ||
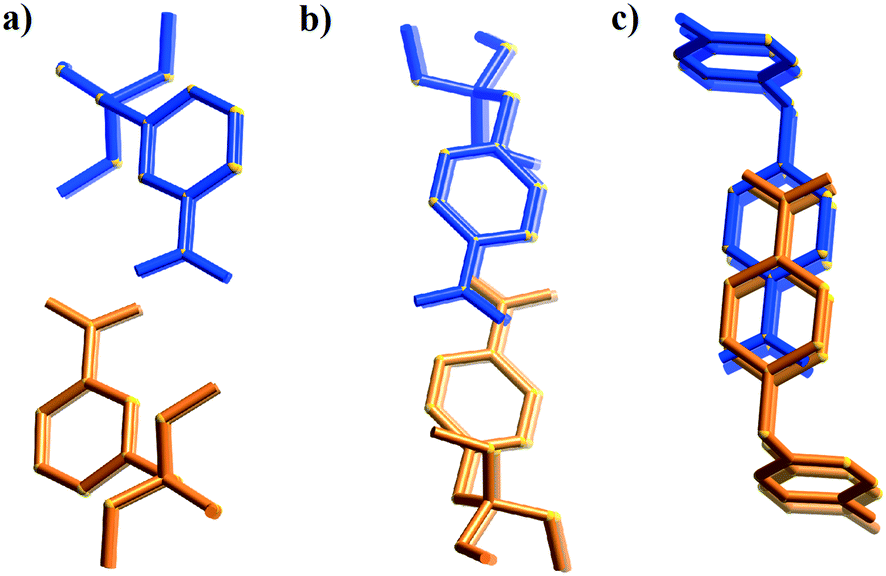
The first packing type, type Ia, consists of infinite stacks of alternating pairs of cations and pairs of TCNQ˙− (π-dimers) and is adopted by complexes (1–3)TCNQ and (2)F4TCNQ. An illustration of a representative structure, (1)(TCNQ), is presented in Fig. 1, which shows (TCNQ˙−)2 dimers separated by N-methylisoquinolinium (1) cations within infinite stacks. This arrangement results in each TCNQ˙− monoanion participating in a single face-to-face π–π interaction with a cation. Within the (TCNQ˙−)2 π-dimer, atomic separations as close as 3.1 Å exist between the opposing monoanions. The use of the structurally related N-methylquinolinium cation, 2, in place of 1, results in a significant structural difference associated with the location of the cation relative to the TCNQ˙− anion. In the case of (1)(TCNQ), the aromatic system of the cation lies directly above (or below) the 6-membered ring of the radical TCNQ˙− anion whereas for (2)(TCNQ) the cation is more closely associated with the C(CN)2 units. As is apparent upon a comparison of Fig. 1a with 1b, this arrangement appears to favour a more pronounced “stepping” within the cation–anion stack. A similar “stepped” arrangement has been observed in F4TCNQ2− CT complexes.20
 | ||
| Fig. 1 Representations of a) (1)(TCNQ) and b) (2)(TCNQ) viewed almost normal to the stacking direction. The cation is indicated in red and the TCNQ˙− in blue. | ||
There are two electron deficient sites within cation 3, the cationic quinuclidinol unit and the aromatic nitrobenzyl group. It is apparent under these circumstances that the (TCNQ˙−)2 units favour a close association with the aromatic group rather than the quaternary ammonium centre (Fig. 2). The adopted arrangement presumably allows for a more effective charge-transfer interaction between the TCNQ˙− anion and the cation.
 | ||
| Fig. 2 A representation of (3)(TCNQ) showing the donor TCNQ˙− units preferred association with the aromatic nitrobenzyl group rather than the quinuclidinol moiety. | ||
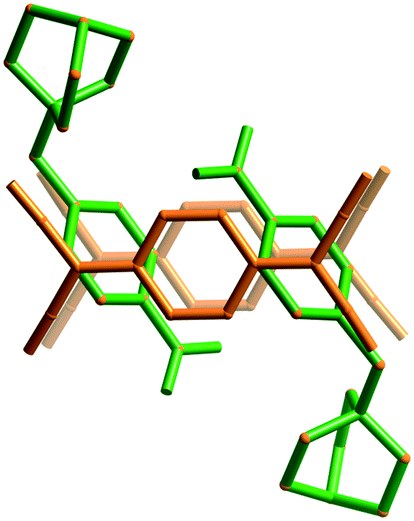
The compound, (4)(TCNQ)2 contains the dication 4, which results in only half as many cations per formula unit compared with (1–3)(TCNQ). As a result, pairs of TCNQ˙− are now separated by a single cation rather than a pair of cations, as shown in Fig. 3. Structure Ib (Scheme 1) provides a schematic representation of the structure based upon the location of the central ring of the dication. Inspection of Fig. 3 also reveals that the mean plane of the TCNQ˙− anion is approximately parallel with the central aromatic ring of the cation with which it makes close contact; in contrast the isoquinolinium units participate in edge-to-face interactions with the anions. Face-to-face interactions involving neighbouring isoquinolinium cations are also present which leads to alignment of neighbouring stacks to form a sheet structure, part of which is represented in Fig. 3.
 | ||
| Fig. 3 A representation of the sheet structure of (4)(TCNQ)2 showing three parallel vertical stacks of alternating dications and TCNQ˙− dimers. | ||
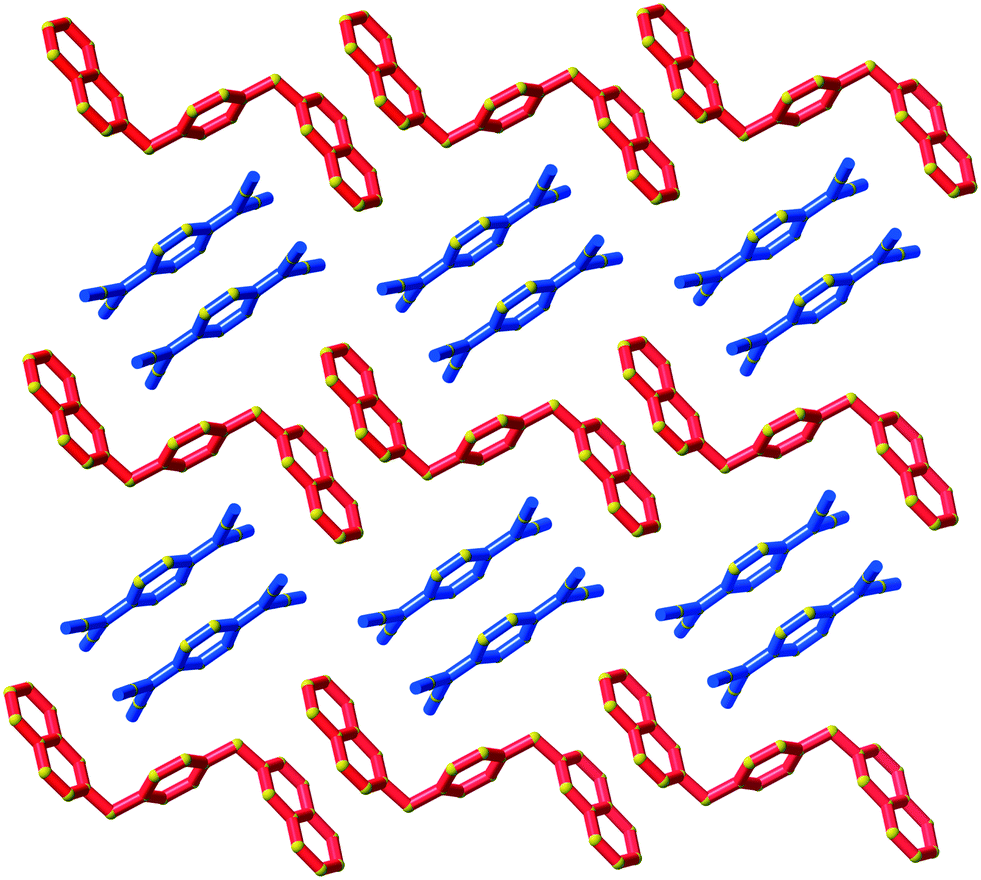
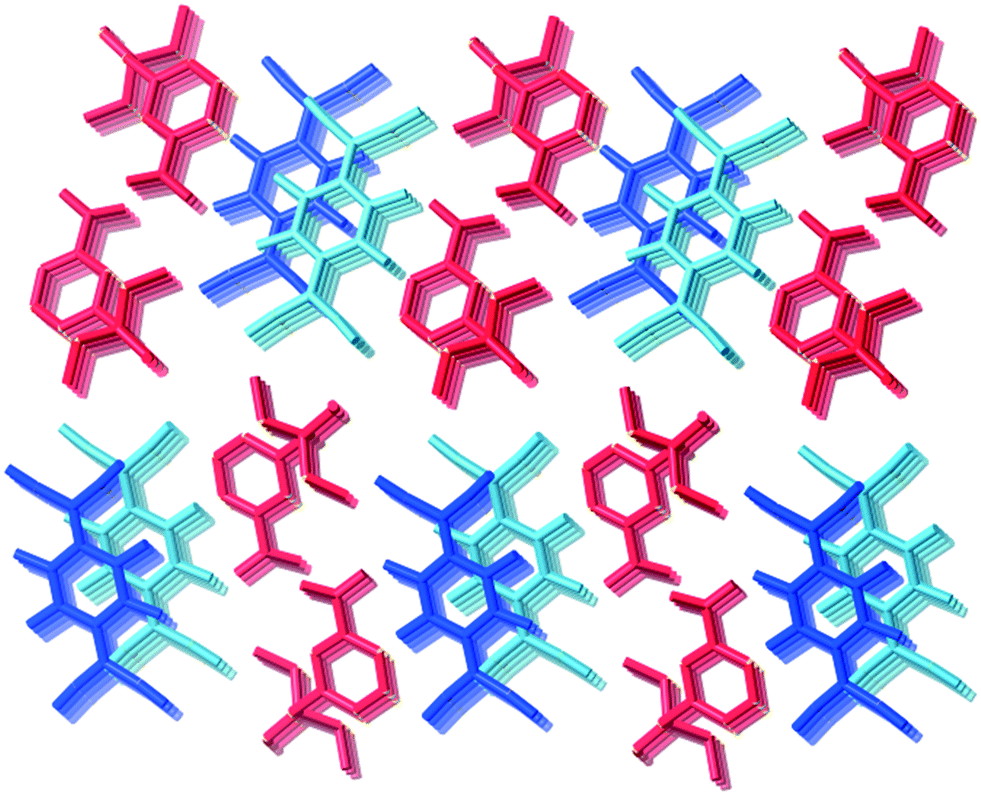
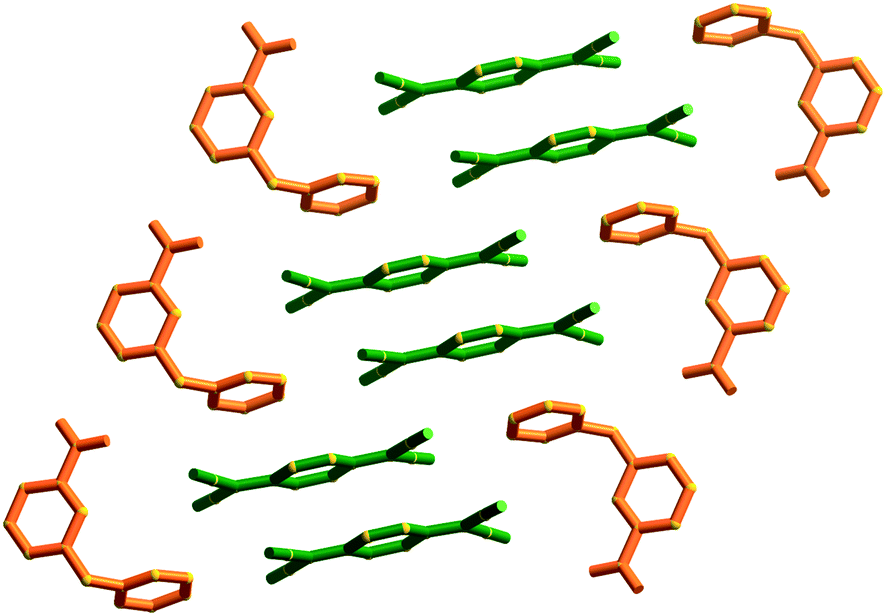
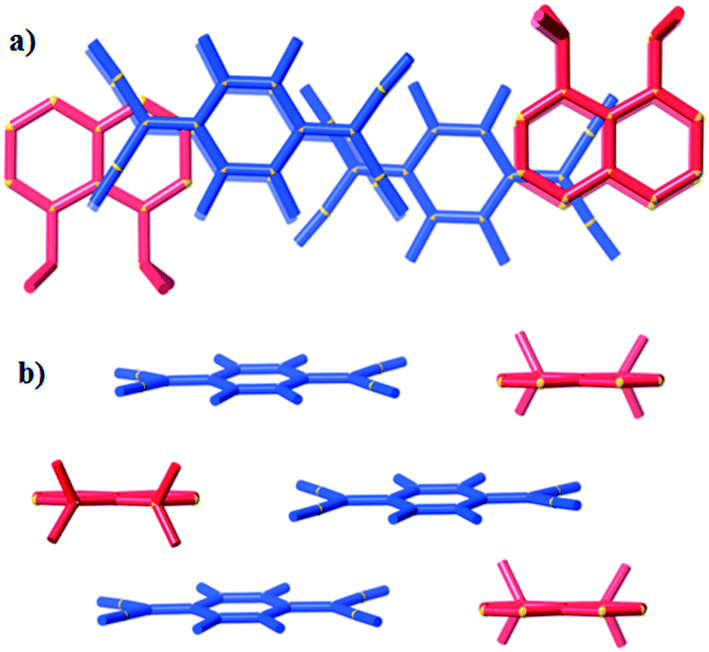
Type II packing is characterised by segregated stacks of (TCNQ˙−)2 dimers and cations. Variants in the type II structures are presented in Scheme 1. The compound (5)(F4TCNQ) exhibits a type IIa structure with stacks of cations and anions extending parallel to the a-axis (see Fig. 4). The relatively bulky cations are separated by the a cell length of 7.1083(2) Å whilst the TCNQ˙− anions appear at twice the cation frequency along a direction parallel to the a axis. Charge neutrality is achieved by having twice as many cation columns as anion columns. Cation 6 is chemically similar to cation 5 but with the substitution occurring at the 1,4 positions of the aromatic ring rather than the 1,3 positions. A similar packing arrangement is found in both (6)(TCNQ) and (5)(TCNQ) although there is some overlap between cations belonging to different stacks in (6)(TCNQ). The structure of (7)(TCNQ) is similar to (6)(TCNQ) but with an even greater degree of overlap between the cations. The structure of (7)(TCNQ) is best represented by IIb whilst the structure of (6)TCNQ may be considered to be intermediate between IIa and IIb. The extent of overlap of the cations in (5)(TCNQ), (6)(TCNQ) and (7)(TCNQ) is shown in Fig. 5. The structure of (8)(TCNQ) is difficult to classify as a consequence of the TCNQ˙− dimers being significantly displaced from each other within a loosely defined stack (Fig. 6). In this arrangement the pyridinium group of the cation is able to form a face-to-face interaction with a TCNQ˙− anion. The nitrophenyl groups do not participate in face-to-face interactions with the TCNQ˙− anions lying parallel with the stacking direction. If the TCNQ˙− dimers are considered as a stack and the cations are considered as two separate stacks (depicted in Fig. 6) then the structure may be classified as type IIa although it may be best to consider the combination of the TCNQ˙− anions flanked by columns of cations as a single broad stack. Nitrophenyl groups from adjacent, parallel broad stacks form self-complementary face-to-face interactions to give a sheet-like structure.
 | ||
| Fig. 4 The structure (5)(TCNQ) showing the segregated stacks of cations (red) and TCNQ˙− (blue and light blue) viewed along the stacking direction. | ||
 | ||
| Fig. 5 Representation of the cations (orange and blue) from complexes; a) (5)(TCNQ), b) (6)(TCNQ), and c) (7)(TCNQ) showing the increasing overlap with decreasing steric bulk. | ||
 | ||
| Fig. 6 A representation of (8)(TCNQ) showing stacks of TCNQ˙− dimers (green) and cations (orange). | ||
The compound (9)(TCNQ)2 involves a doubly-charged cation which sits in separate stacks to (TCNQ˙−)2 dimers, an arrangement which is depicted schematically in Scheme 1 as structure IIc. There are two crystallographically distinct stacks of (TCNQ˙−)2 dimers as indicated in Fig. 7.
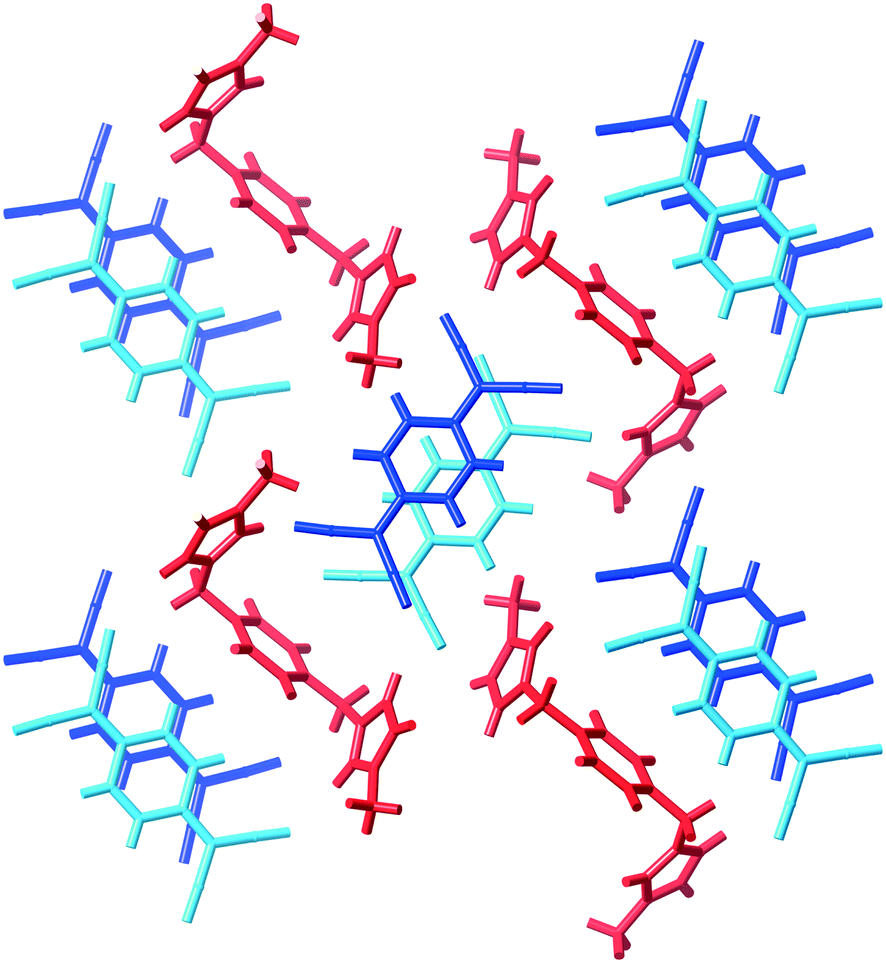 | ||
| Fig. 7 A representation of (9)(TCNQ) showing the separated stacks of TCNQ˙− anions (blue) and dications (red). | ||
It is worth noting that the type II packing arrangement is similar to that in the conductive TTF–TCNQ complex.9 However, the TCNQ molecules within TTF–TCNQ are equally spaced under ambient conditions with no distinct dimers observed.
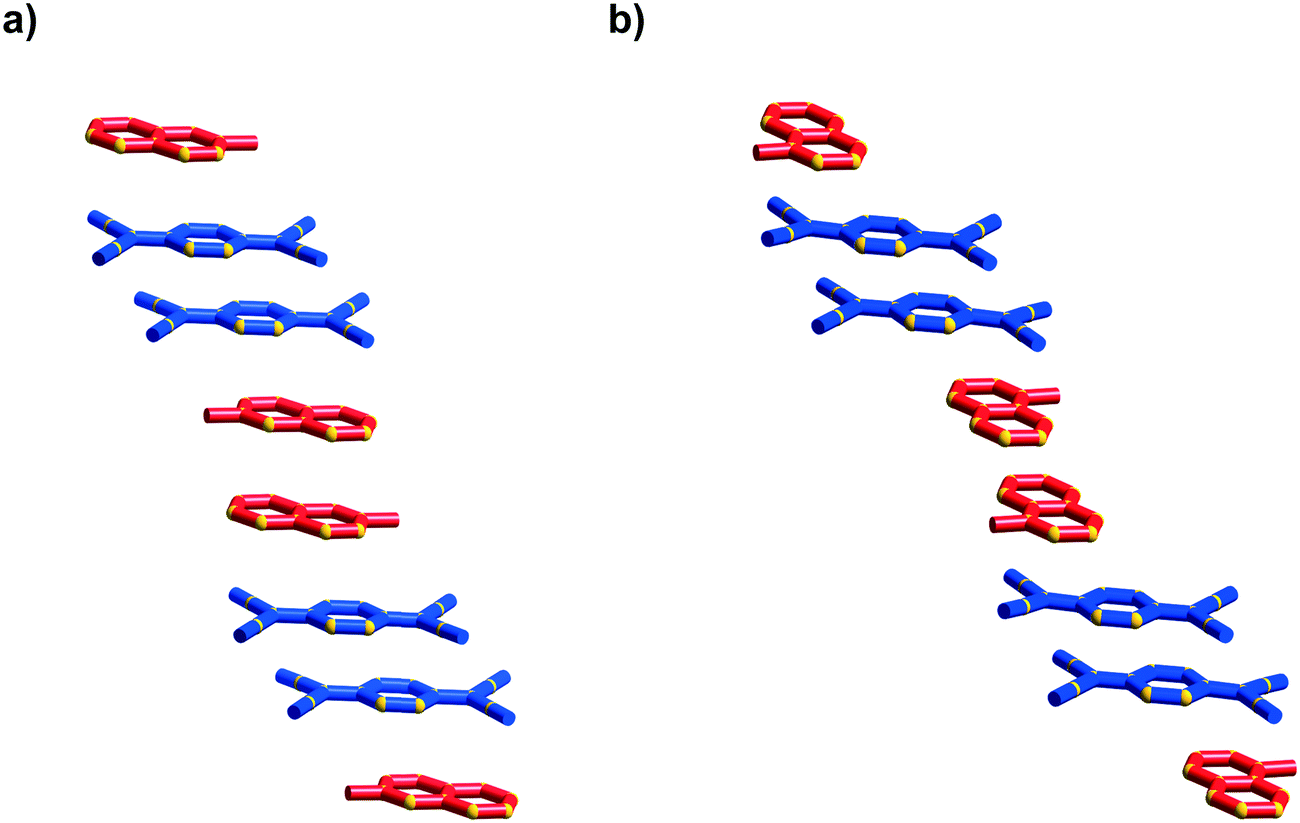
In packing types I and II there is a clear, strong association between the anions in the (TCNQ˙−)2/(F4TCNQ˙−)2 dimers. Within a single pair the mean planes of the individual anions are 3.0–3.2 Å apart and longitudinal offsets are in the range of 0.1–2.1 Å (ESI,† Table S2.1). In contrast, only a relatively loose association exists between anions in (10)(TCNQ) and (10)(F4TCNQ). In the case of (10)(F4TCNQ) the separation between the mean planes of neighbouring parallel F4TCNQ˙− alternates between 3.4 and 3.6 Å whereas in the case of (10)(TCNQ) the anions are more evenly spaced with an approximate separation of 3.5 Å. In both cases there is a significant longitudinal offset of approximately 6 Å (see ESI†). The extended packing arrangement has been assigned as type III. The structure of (10)(TCNQ), which is very similar to the structure of (10)(F4TCNQ), is presented in Fig. 8.
 | ||
| Fig. 8 Representations of (10)(F4TCNQ) viewed along a) the stacking direction and b) normal to the stacking direction. | ||
The charge on the TCNQ molecule within complexes can be estimated by the use of the Kistenmacher relationship.5 The relationship is an empirical formula based upon certain bond lengths within the TCNQ and represented as:
| q = A[c/(b + d)] + B |
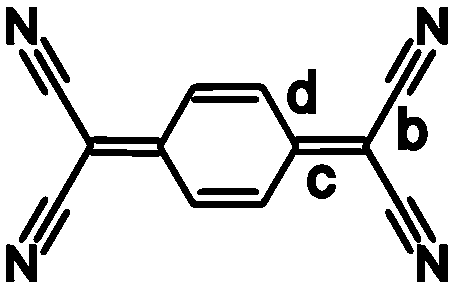 | ||
| Scheme 2 | ||
The estimated charge (q) (Table 1) on the TCNQ units suggests that all complexes considered in this present work are formally radical anionic TCNQ˙− salts. This is in agreement with the νCN stretching frequencies (ESI,† Table S2.1), which further support the −1 charge assignment for the TCNQ component. For neutral and monoanionic forms of TCNQ, typical νCN values are in the region of 222521 and 2187, 2158 cm−1![[thin space (1/6-em)]](https://www.rsc.org/images/entities/char_2009.gif) 22 respectively whilst the dianion νCN stretching frequencies are commonly ∼2152, 2104 cm−1.7 The neutral, radical and dianionic species of F4TCNQ possess slightly higher energy νCN stretching frequencies (neutral 2227 cm−1;23 radical 2197, 2178 cm−1;24,25 and dianion 2167, 2133 cm−120). The EPR spectra of all complexes (see ESI†), each consist of a single peak with a g-value in the range of 2.0034–2.0040 which is consistent with the presence of an organic radical.
22 respectively whilst the dianion νCN stretching frequencies are commonly ∼2152, 2104 cm−1.7 The neutral, radical and dianionic species of F4TCNQ possess slightly higher energy νCN stretching frequencies (neutral 2227 cm−1;23 radical 2197, 2178 cm−1;24,25 and dianion 2167, 2133 cm−120). The EPR spectra of all complexes (see ESI†), each consist of a single peak with a g-value in the range of 2.0034–2.0040 which is consistent with the presence of an organic radical.
| Packing type | Compound | Coloura | ν CN (cm−1) | c/(b + d) | Estimated chargeb | Optical band gap (eV) | EPR (g) |
|---|---|---|---|---|---|---|---|
| a All compounds possess a metallic sheen when the crystals are observed with reflected light. b The charge, q, is estimated using the Kistenmacher relationship q = A[c/(b + d)] + B. For F4TCNQ A = −45.756 and B = 21.846; for TCNQ A = −41.667 and B = 19.818; b, c and d refer to the lengths of bonds indicated in Scheme 2. | |||||||
| I | (1)(TCNQ) | Purple | 2184, 2172 | 0.497 | −0.90 (6) | 0.79 | 2.0040 |
| (2)(TCNQ) | Purple | 2182, 2169 | 0.497 | −0.91 (9) | 0.79 | 2.0034 | |
| (2)(F4TCNQ) | Dark purple | 2196, 2177 | 0.497 | −0.89 (10) | 1.03 | 2.0040 | |
| (3)(TCNQ) | Dark purple | 2182, 2153 | 0.497 | −0.89 (15) | 1.02 | 2.0037 | |
| (4)(TCNQ)2 | Dark purple | 2177, 2155 | 0.496 | −0.86 (6) | 1.08 | 2.0036 | |
| II | (5)(F4TCNQ) | Dark blue | 2193, 2176 | 0.497 | −0.90 (5) | 1.04 | 2.0039 |
| (6)(TCNQ) | Dark purple | 2188, 2174 | 0.497 | −0.91 (6) | 0.80 | 2.0038 | |
| (7)(TCNQ) | Dark purple | 2173, 2131 | 0.497 | −0.89 (5) | 0.86 | 2.0036 | |
| (8)(TCNQ) | Dark purple | 2185, 2170 | 0.498 | −0.92 (6) | 0.79 | 2.0034 | |
| (9)(TCNQ)2 | Dark purple | 2187, 2174 | 0.497 | −0.88 (5) | 0.80 | 2.0037 | |
| 0.499 | −0.97 (5) | ||||||
| III | (10)(TCNQ) | Dark purple | 2178, 2152 | 0.502 | −1.08 (6) | 0.83 | 2.0035 |
| (10)(F4TCNQ) | Dark purple | 2191, 2169 | 0.495 | −0.81 (16) | 0.89 | 2.0034 | |
All compounds are dark purple/blue and possess a metallic sheen when the crystals are observed with reflected light. Vis-NIR spectral studies provide useful insights into the charge-transfer properties of the complexes characterised by single crystal X-ray diffraction. Specifically, the generation of Tauc plots from such measurements allows for the determination of the optical band gap for the material.26 The solid-state diffuse reflectance spectrum is shown for (7)(TCNQ) in Fig. 9a and the corresponding Tauc plot is shown in Fig. 9b. The Vis-NIR spectra and resultant Tauc plots for the remaining complexes are available in the ESI.† The optical band gaps for all the complexes fall within a range typical of semiconductors (0.79–1.08 eV).
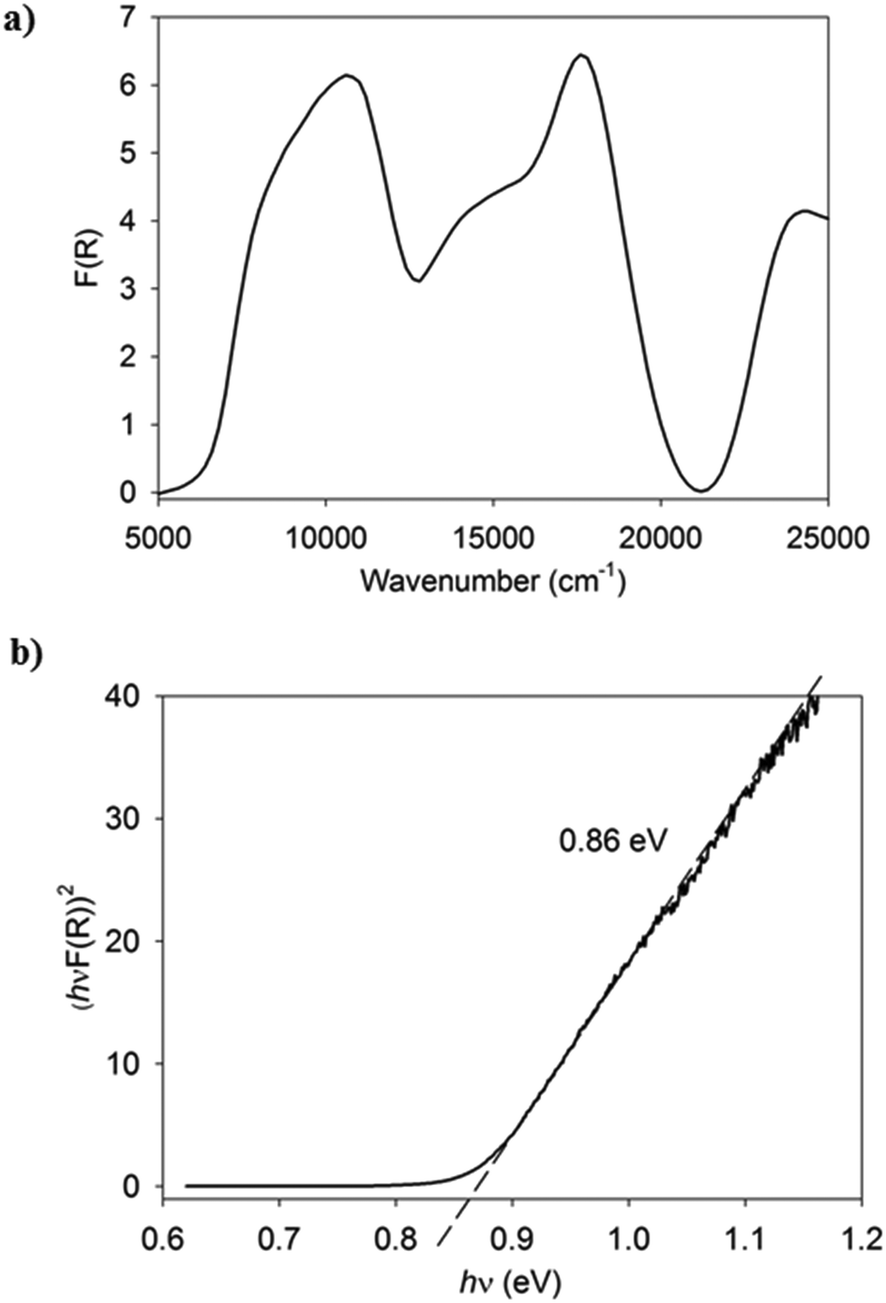 | ||
| Fig. 9 a) The Vis-NIR solid-state diffuse reflectance spectrum of (7)(TCNQ). b) The Tauc plot derived from the spectrum indicating the estimation of the optical band gap. | ||
Crystal packing is known to be a significant factor in the conductivity of organic charge-transfer systems, however the compounds reported in this current work exhibit no marked correlation between packing arrangements and optical band gap values. In one-dimensional conductors, such as TTF–TCNQ, it is recognised that mixed valency is important for metal-like conductivity.8 As discussed in the introduction, the system may be thought to exist somewhere between the two formal representations: TCNQ–TTF and TCNQ˙−–TTF+. The metal-like conductivity arises because the electron affinity of both TCNQ and TTF+ are closely matched, allowing the system to exist in the mixed-valence regime. If there was a significant mismatch in the electron affinity of the two components (TCNQ and TTF+) then either the neutral form (TCNQ–TTF) or the ionic form (TCNQ˙−–TTF+) would be dominant and the system would lie outside the mixed-valence regime.8 It is important to recognise that the relative electron affinities of the two components is not the only factor governing the extent of the mixed valency. Factors such as lattice energy, which would be expected to favour an ionic structure over one in which the components were neutral, are also expected to play a crucial role.
Given the clear relationship between electron affinity and reduction potential, an electrochemical investigation was undertaken to compare the reduction potentials of the cations employed in this study with those of TCNQ and F4TCNQ. Cyclic voltammetry studies reveal that cations 1–10 undergo reduction in the approximate range −1.2 to −1.5 V, (vs. Fc0/Fc+) (see ESI†). These potentials are significantly lower than the first reduction potentials of TCNQ and F4TCNQ of −0.25 and +0.16 V (vs. Fc0/Fc+) respectively.27 With such a large difference between the reduction potentials of the cations and the TCNQ/F4TCNQ units, mixed valency is not anticipated. This result is consistent with the Kistenmacher estimations and νCN stretching frequencies which indicate that TCNQ and F4TCNQ exist as singly charged anions in the compounds described in this investigation. It would appear that in the absence of mixed valency, i.e. with cations and anions clearly exhibiting integer charges, no clear relationship exists between the optical band gap and the reduction potential of the cation.
Conclusion
In summary, we report the solid-state structural elucidation and optical characterisation of twelve new TCNQ˙−/F4TCNQ˙− CT complexes. The complexes are categorised as one of three distinct types on the basis of their solid-sate geometrical arrangement. The type I motif consists of infinite columns of alternating radical dimers (TCNQ˙−)2 and cations with face-to-face π–π interactions. Also common within this study is the type II arrangement that involves segregated parallel stacks of cations and TCNQ˙− dimers, similar to the solid-state arrangement observed in the conductive TTF–TCNQ complex.9 The type III arrangement, which arises from a large shift in dimer longitudinal offsets and an increase in dimer separation, is only observed with the use of 10 as the cation. The optical band gaps for all complexes fall within the range of 0.79 to 1.02 eV. With the reduction potentials of the TCNQ/F4TCNQ and the cations being well separated, no clear relationship between the packing arrangement and optical band gap is apparent. In particular, for the compounds considered in this present work the optical band gaps appear to be similar for the structures consisting of segregated and non-segregated stacks. Furthermore, there appears to be no correlation between the longitudinal and transverse offsets of the TCNQ/F4TCNQ units, within the π-dimers (see ESI†), and the magnitude of the optical band gap. The absence of a clear relationship between packing arrangements and the optical band gap provides a stark contrast with the example of the black and red polymorphs of TCNQ–TMTSF described in the introduction. It would appear that the packing arrangement plays a much more significant role with respect to the electronic properties when the reduction potentials of TCNQ/F4TCNQ and the cations are closely matched leading to the prospect of mixed valency.Experimental
Synthesis
Bulk products of the compounds were obtained by combination of LiTCNQ or LiF4TCNQ with the salt of the cation in a methanol solution. In most cases, the crystals used for the structure determination were obtained by slow aerial oxidation of TCNQH2 or F4TCNQH2 in methanol in the presence of the cation and a weak base. The syntheses of the compounds are described in detail in the ESI.†Single crystal X-ray diffraction
Data were collected for all complexes on an Oxford Diffraction Supernova diffractometer using CuKα radiation, except for (1)(TCNQ) which was collected on an Oxford Diffraction Xcalibur Sapphire3 diffractometer using CuKα radiation. In general, crystals were transferred directly from the mother liquor to a protective oil before being mounted on the diffractometer in a stream of nitrogen at 130 K. Structures were solved by direct methods and refined using a full matrix least-squares procedure based on F2 (SHELX2014).28 The crystallographic analyses were performed using the WinGX system of programs.29 Crystal data and refinement details are presented in Table 2.| Compound | (1)(TCNQ) | (2)(TCNQ) | (2)(F4TCNQ) | (3)(TCNQ) | (4)(TCNQ)2 | (5)(F4TCNQ) | (6)(TCNQ) | (7)(TCNQ) | (8)(TCNQ) | (9)(TCNQ)2 | (10)(TCNQ) | (10)(F4TCNQ) |
|---|---|---|---|---|---|---|---|---|---|---|---|---|
| Formula | C22H14N5 | C22H14N5 | C22H10F4N5 | C26H23N6O3 | C50H30N10 | C25H21F4N6O2 | C25H25N6O2 | C25H17N6O2 | C24H15N6O2 | C40H28N12 | C26H23N6 | C26H19F4N6 |
| Molecular weight | 348.38 | 348.38 | 420.35 | 467.5 | 770.84 | 513.48 | 441.51 | 433.45 | 419.42 | 676.74 | 419.5 | 491.47 |
| Temperature (K) | 130 | 130 | 130 | 130 | 130 | 130 | 130 | 130 | 130 | 130 | 130 | 130 |
| Crystal system | Monoclinic | Triclinic | Monoclinic | Triclinic | Triclinic | Monoclinic | Triclinic | Triclinic | Monoclinic | Triclinic | Monoclinic | Triclinic |
| Space group | P21/c |
P![[1 with combining macron]](https://www.rsc.org/images/entities/char_0031_0304.gif) |
P21/c |
P |
P |
P21/n |
P |
P |
P21/a |
P |
P21/m |
P |
| a (Å) | 8.3571(3) | 7.5189(7) | 11.9675(3) | 7.8219(4) | 7.7053(5) | 7.1083(2) | 7.3694(3) | 7.0880(3) | 7.3613(2) | 6.6808(2) | 9.6649(3) | 7.1455(4) |
| b (Å) | 15.9841(5) | 8.8078(7) | 10.4959(3) | 12.4540(5) | 10.2744(7) | 25.3703(5) | 11.4503(5) | 12.1413(6) | 37.7897(7) | 13.9762(5) | 7.0560(2) | 9.8840(7) |
| c (Å) | 12.6113(5) | 13.1350(10) | 14.5659(3) | 13.5137(6) | 12.1391(9) | 12.9159(3) | 14.4977(8) | 13.3964(7) | 7.9918(2) | 18.9142(7) | 16.1763(6) | 16.2700(9) |
| α (°) | 90 | 87.752(6) | 90 | 117.204(4) | 90.196(6) | 90 | 66.999(4) | 110.968(5) | 90 | 96.805(3) | 90 | 82.795(5) |
| β (°) | 93.225(3) | 89.740(7) | 92.307(2) | 90.126(4) | 97.753(6) | 100.474(2) | 82.796(4) | 93.792(4) | 115.710(4) | 100.163(3) | 96.103(3) | 89.046(5) |
| γ (°) | 90 | 80.065(7) | 90 | 104.916(5) | 97.100(6) | 90 | 88.216(3) | 103.933(4) | 90 | 95.734(3) | 90 | 82.020(6) |
| Cell volume (Å3) | 1681.96(10) | 856.16(12) | 1828.14(8) | 1120.29(9) | 944.74(11) | 2290.44(9) | 1116.98(9) | 1029.99(9) | 2003.08(8) | 1712.86(10) | 1096.90(6) | 1128.97(12) |
| Z | 4 | 2 | 4 | 2 | 1 | 4 | 2 | 2 | 4 | 2 | 2 | 2 |
| Reflections collected | 11463 |
5644 | 6589 | 7635 | 6227 | 9341 | 10359 |
6745 | 7538 | 10746 |
7220 | 7692 |
| Independent reflections | 3287 | 3211 | 3295 | 4407 | 3568 | 4535 | 4749 | 4009 | 3964 | 6146 | 2362 | 4442 |
| R 1 [I > 2σ(I)] | 0.0403 | 0.0619 | 0.0646 | 0.0547 | 0.046 | 0.0338 | 0.0497 | 0.0444 | 0.0382 | 0.0344 | 0.0563 | 0.0781 |
| wR2 (all data) | 0.1174 | 0.1793 | 0.1891 | 0.1457 | 0.1313 | 0.0902 | 0.1572 | 0.1263 | 0.1004 | 0.0964 | 0.1568 | 0.3038 |
Powder diffraction
Powder diffraction patterns were recorded on either the powder diffraction beamline at the Australian Synchrotron using radiation of wavelength 0.8262 Å or on an Oxford SuperNova diffractometer using CuKα radiation, λ = 1.5418 Å. The diffraction pattern of the bulk product matched the calculated diffraction pattern obtained from the single crystal structure determination for all compounds.Infrared spectra
Infrared spectra were collected on a Bruker Tensor 27 FT-IR using a ground sample in a pressed KBr disc.Solid state Vis-NIR spectroscopy
Vis-NIR diffuse reflectance spectroscopy was used to analyse powdered samples. Spectra were collected on a CARY 5000 UV-Vis-NIR spectrophotometer with a Harrick Omni Diff Probe attachment using Varian WinUV software V3.0. The data was recorded from 5000 to 25000 cm−1 with a scan rate of 6000 cm−1 min−1. Samples were supported on high density filter paper which was also used to provide the background reference.
Electron paramagnetic resonance
EPR spectra were collected on a Bruker Elexsys E-500 as a polycrystalline sample at room temperature.Electrochemistry
Cyclic voltammetry (CV) was performed using an eDAQ potentiostat and e-corder unit. Measurements were conducted using a conventional three-electrode cell with a glassy-carbon working electrode, a Pt-wire counter electrode, and an Ag/Ag+ quasi-reference electrode. A 0.1 M n-Bu4NPF6/CH3CN electrolyte purged under N2 was employed. Potentials were referenced to the Fc0/Fc+ couple.Elemental analysis
Elemental microanalyses were performed by the Campbell Microanalytical Laboratory Dunedin, New Zealand.Acknowledgements
We gratefully acknowledge the financial support of the Australian Research Council. Part of the research reported was undertaken at the powder diffraction beamline at the Australian Synchrotron, Victoria, Australia.References
- R. McNeill, R. Siudak, J. H. Wardlaw and D. E. Weiss, Aust. J. Chem., 1963, 16, 1056 CrossRef CAS.
- J. Ferraris, V. Walatka, J. H. Perlstein and D. O. Cowan, J. Am. Chem. Soc., 1973, 95, 948 CrossRef CAS.
- M. J. Cohen, L. B. Coleman, A. F. Garito and A. J. Heeger, Phys. Rev. B: Solid State, 1974, 10, 1298 CrossRef CAS.
- K. Bechgaard, T. J. Kistenmacher, A. N. Bloch and D. O. Cowan, Acta Crystallogr., Sect. B: Struct. Crystallogr. Cryst. Chem., 1977, 33, 417 CrossRef.
- T. J. Kistenmacher, T. J. Emge, A. N. Bloch and D. O. Cowan, Acta Crystallogr., Sect. B: Struct. Crystallogr. Cryst. Chem., 1982, 38, 1193 CrossRef.
- L. R. Melby, R. J. Harder, W. R. Hertler, W. Mahler, R. E. Benson and W. E. Mochel, J. Am. Chem. Soc., 1962, 84, 3374 CrossRef CAS.
- T. A. Hudson and R. Robson, Cryst. Growth Des., 2009, 9, 1658 CAS.
- G. Saito and T. Murata, Philos. Trans. R. Soc., A, 2008, 366, 139 CrossRef CAS PubMed.
- T. J. Kistenmacher, T. E. Phillips and D. O. Cowan, Acta Crystallogr., Sect. B: Struct. Crystallogr. Cryst. Chem., 1974, 30, 763 CrossRef CAS.
- J. B. Torrance, Acc. Chem. Res., 1979, 12, 79 CrossRef CAS.
- M. R. Suchanski and R. P. Van Duyne, J. Am. Chem. Soc., 1976, 98, 250 CrossRef CAS.
- B. F. Abrahams, T. A. Hudson and R. Robson, Cryst. Growth Des., 2008, 8, 1123 CAS.
- B. F. Abrahams, R. W. Elliott, T. A. Hudson and R. Robson, Cryst. Growth Des., 2010, 10, 2860 CAS.
- B. F. Abrahams, R. W. Elliott, T. A. Hudson and R. Robson, CrystEngComm, 2012, 14, 351 RSC.
- B. F. Abrahams, R. W. Elliott, T. A. Hudson and R. Robson, Cryst. Growth Des., 2013, 13, 3018 CAS.
- B. F. Abrahams, R. W. Elliott and R. Robson, Aust. J. Chem., 2014, 67, 1871 CrossRef CAS.
- T. H. Le, A. Nafady, N. T. Vo, R. W. Elliott, T. A. Hudson, R. Robson, B. F. Abrahams, L. L. Martin and A. M. Bond, Inorg. Chem., 2014, 53, 3230 CrossRef CAS PubMed.
- B. F. Abrahams, R. W. Elliott, T. A. Hudson, R. Robson and A. L. Sutton, Cryst. Growth Des., 2015, 15, 2437 CAS.
- M. R. Saber, A. V. Prosvirin, B. F. Abrahams, R. W. Elliott, R. Robson and K. R. Dunbar, Chem. – Eur. J., 2014, 20, 7593 CrossRef CAS PubMed.
- A. L. Sutton, B. F. Abrahams, D. M. D'Alessandro, R. W. Elliott, T. A. Hudson, R. Robson and P. M. Usov, CrystEngComm, 2014, 16, 5234 RSC.
- T. Takenaka, Bull. Inst. Chem. Res., Kyoto Univ., 1969, 47, 387 CAS.
- R. Bozio, I. Zanon, A. Girlando and C. Pecile, J. Chem. Soc., Faraday Trans. 2, 1978, 74, 235 RSC.
- T. J. Emge, M. Maxfield, D. O. Cowan and T. J. Kistenmacher, Mol. Cryst. Liq. Cryst., 1981, 65, 161 CrossRef CAS.
- S. A. O'Kane, R. Clérac, H. Zhao, X. Ouyang, J. R. Galán-Mascarós, R. Heintz and K. R. Dunbar, J. Solid State Chem., 2000, 152, 159 CrossRef.
- M. Meneghetti and C. Pecile, J. Chem. Phys., 1986, 84, 4149 CrossRef CAS.
- J. Tauc, Mater. Res. Bull., 1968, 3, 37 CrossRef CAS.
- M. Kivala, C. Boudon, J. P. Gisselbrecht, B. Enko, P. Seiler, I. B. Muller, N. Langer, P. D. Jarowski, G. Gescheidt and F. Diederich, Chem. – Eur. J., 2009, 15, 4111 CrossRef CAS PubMed.
- G. M. Sheldrick, Acta Crystallogr., Sect. A: Found. Crystallogr., 2008, 64, 112 CrossRef CAS PubMed.
- L. J. Farrugia, J. Appl. Crystallogr., 2012, 45, 849 CrossRef CAS.
Footnote |
| † Electronic supplementary information (ESI) available: Full synthetic details, supplementary electrochemical and structural information, supplementary figures including powder diffraction patterns, EPR spectra, Vis-NIR spectra, Tauc plots and molecular structures. CCDC reference numbers: 1503299–1503310. For ESI and crystallographic data in CIF or other electronic format see DOI: 10.1039/c6ce02015a |
| This journal is © The Royal Society of Chemistry 2016 |