 Open Access Article
Creative Commons Attribution 3.0 Unported Licence
Quantitative analysis of modeled ATP hydrolysis in water by a colorimetric sensor array†
Tsuyoshi
Minami‡
ab,
Fereshteh
Emami‡
a,
Ryuhei
Nishiyabu
c,
Yuji
Kubo
*c and
Pavel
Anzenbacher
Jr.
*a
aDepartment of Chemistry and Center for Photochemical Sciences, Bowling Green State University, Bowling Green, Ohio 43403, USA. E-mail: pavel@bgsu.edu
bInstitute of Industrial Science, The University of Tokyo, 4-6-1 Komaba, Meguro-ku, Tokyo 153-8505, Japan
cDepartment of Applied Chemistry, Graduate School of Urban Environmental Sciences, Tokyo Metropolitan University, 1-1 Minami-ohsawa, Hachioji, Tokyo 192-0397, Japan. E-mail: yujik@tmu.ac.jp
First published on 16th May 2016
Abstract
Self-assembled colorimetric sensors have been prepared from ZnII–DPA-attached phenylboronic acid (1·Zn) and catechol-type dyes. The 1·Zn–dye sensors display selectivity towards oligophosphate over monophosphates. The colorimetric sensor assay (1·Zn–dye) is utilized to monitor a model of a metabolic reaction where ATP is hydrolyzed to pyrophosphate (PPi) and AMP.
Phosphates are ubiquitous in living matter where they play a number of important roles including energy transfer and transfer of genetic information, etc.1 Simple rapid assays for phosphates in water could lead to a greater understanding of phosphate metabolism and satisfy the need for real-time phosphate monitoring methods.2 The currently used Luciferin-luciferase reaction, a common method for detection and quantification of (oligo)phosphates suffers from a relatively low stability of luciferase albeit a significant effort for improvement.3 Also for this reason, significant attention has been devoted to developing phosphate chemosensors.4 Despite of recent progress, the sensing of phosphates by molecular sensors in water still remains a challenge because of strong hydration, complicated geometry and multiple protonation equilibria.5 High-throughput sensor arrays are powerful methods for the detection of various analytes.6 This is particularly true, when the analyte-induced changes in color or fluorescence are evaluated using pattern recognition methods.7 This was the motivation for us to develop an array-based high-throughput assay for phosphates.
ZnII–dipicolylamine (DPA) receptors display affinity for anions as well as anionic dyes, a feature utilized in some anion sensors.8 On the other hand, phenylboronic acids in combination with catechol-type dyes have been used to detect anions9 and saccharides.10 We synthesized ZnII–DPA attached to phenylboronic acid 1·Zn (Fig. 1) which forms an ensemble with alizarin red S (ARS).11 This ensemble allows for a turn-on fluorescence detection for oligophosphates in aqueous solution. An interesting binding mode was discovered: in the absence of phosphate, the ARS anion ARS2− (pKa2 = 5.5)12 binds preferentially to the ZnII–DPA moiety (Fig. 1, form A) compared to boronic acid (Fig. 1, form B). However, the addition of pyrophosphate (PPi) induces reorganization of the original complex to a different boronate ester ensemble (Fig. 1, 1·Zn–ARS–PPi), which results in an intramolecular transfer of the ARS anion from the ZnII–DPA moiety to boronic acid. This process results in a fluorescence enhancement. The 1·Zn receptor may bind a variety of organic and inorganic phosphates, thereby giving rise to certain cross-reactivity.13
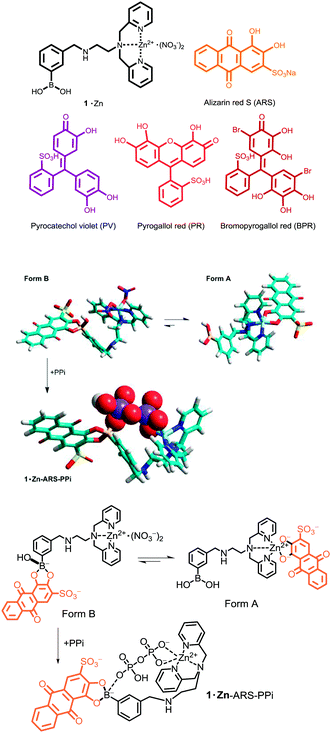 | ||
| Fig. 1 Top: Structures of PV, PR, BPR, ARS and 1·Zn. Bottom: Plausible models and chemical structures of 1·Zn–ARS and 1·Zn–ARS–PPi complexes. The models were calculated by MM. | ||
Here, the observed cross-reactivity of the 1·Zn receptor inspired us to develop a new cross-reactive microarray for biologically relevant phosphate anions in water. Thus, we selected four different dyes, pyrocatechol violet (PV, pKa2 = 7.8),14 pyrogallol red (PR, pKa2 = 6.3),15 bromopyrogallol red (BPR, pKa2 = 4.4)16 and ARS (Fig. 1), all of which display a deprotonated hydroxyl-group at pH 7.5 and are therefore able to coordinate the 1·Zn receptor. In the presence of various phosphate anions these 1·Zn–dye colorimetric sensors display an anion specific change in color.
Herein we report colorimetric detection of biologically important phosphates such as ATP, AMP and PPi in water. Furthermore, quantitative regression analysis of phosphate mixtures comprised of ATP, AMP and PPi is performed using the data from the colorimetric 1·Zn–dye array.
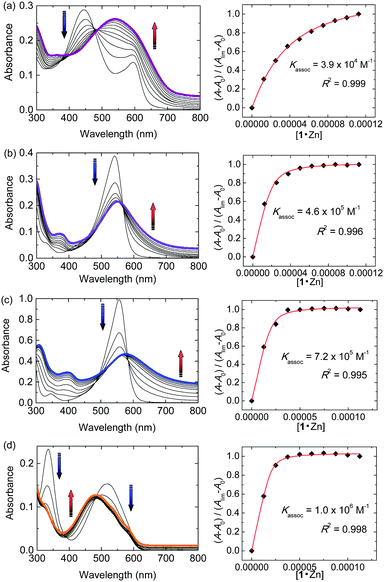
First, the complexes generated from 1·Zn and chromophores were investigated in a 10 mM HEPES (2-[4-(2-hydroxyethyl)-1-piperazinyl]ethanesulfonic acid) buffer solution containing 10 mM sodium chloride at pH 7.5. Fig. 2a shows changes in the UV-vis absorption when 1·Zn was stepwise added into the aqueous solution of PV. While the absorbance at 445 nm decreases, the absorbance at 540 nm increases, which results in a color change of the solution from yellow to violet. The shift of UV-vis spectra suggests that PV binds to the zinc ion in 1·Zn.17 The formation of the proposed 1·Zn–PV complex was supported by matrix-assisted laser desorption/ionization time-of-flight (MALDI-TOF) mass spectrometry. The isotopic distribution of the peak ([1·Zn–2NO3 + PV–2H]+ = 824.38) (Fig. 3a) is in good agreement with the calculated pattern (C40H37BN4O9SZn+m/z = 824.17) (Fig. 3b). The binding constant (K) was calculated as 3.9 × 10⁴ M−1. The 1·Zn stepwise addition into the solutions of PV (Fig. 2a), PR (Fig. 2b), BPR (Fig. 2c) and ARS (Fig. 2d) was carried out. The 1·Zn binding constant of each dye is as follows; PR: 4.6 × 10⁵ M−1, BPR: 7.2 × 10⁵ M−1, ARS: 1.0 × 10⁶ M−1.
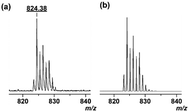 | ||
| Fig. 3 (a) MALDI-TOF mass (positive mode) spectra of 1·Zn and PV. (b) Calculated isotope pattern for C40H37BN4O9SZn+. | ||
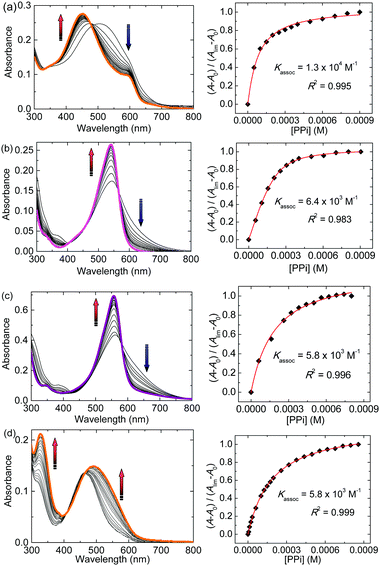
Secondly, to obtain insight into the binding and response to ATP, PPi and AMP, UV-vis titration experiments with phosphates were carried out. The concentrations of 1·Zn and dyes were adjusted to 6.0 × 10⁻⁵ M and 2.0 × 10⁻⁵ M, respectively. Fig. 4a shows changes in the UV-vis absorption when PPi was stepwise added into the aqueous solution of the 1·Zn–PV complex (see ESI† for other titration plots). The addition of PPi to the HEPES buffer solution of the 1·Zn–PV complex resulted in a change of the color from violet to orange, and a corresponding blue-shift of the absorption maximum in the UV-vis absorption spectra. The spectral shift suggests that addition of PPi causes a reorganization of the 1·Zn–PV complex to produce an alternative boronate ester assembly. This hypothesis is supported by MALDI-TOF mass spectrometry, which shows [1·Zn + PV + PPi–2H2O–2NO3 + H + Na]+ at 987.41 (calcd 988.07). Fig. 4b–d also show UV-vis spectral shifts upon addition of PPi into the 1·Zn–PR, BPR and ARS solutions. The vivid colorimetric-response is observable by the naked eye (Fig. 5). The limits of detection for PPi, ATP and AMP were estimated to be 4.5 × 10⁻⁵ M, 8.2 × 10⁻⁵ M and 1.3 × 10⁻⁴ M, respectively. The apparent binding constants for ATP, PPi and AMP are summarized in Table 1. The apparent Ks indicate that the binding affinity for PPi and ATP is higher than that for AMP. The difference in the binding affinity corresponds to guest-dependent color changes, i.e. providing various response-patterns, which is important for the design of assays for a quantitative determination of phosphates in complex mixtures.
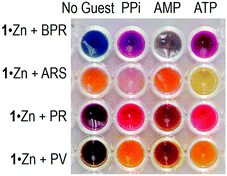 | ||
| Fig. 5 Colorimetric response of the 1·Zn–dye sensor assemblies to the presence of PPi, AMP and ATP in HEPES buffer (10 mM) with sodium chloride (10 mM) at 7.5 at 22 °C. | ||
A variety of spectral shifts and color changes observed upon addition of phosphates to the sensor assemblies (1·Zn–dye) encouraged us to develop a high-throughput assay for conditions that resemble ATP metabolism, i.e. hydrolysis of ATP to AMP and pyrophosphate (PPi): ATP → AMP + PPi. Towards this end, we generated ternary mixtures of ATP, PPi and AMP. Here, the concentration of ATP was adjusted to slowly decrease while the concentration of AMP and PPi was slowly increasing relative to ATP. The concentration range of ATP, PPi and AMP was 0–1.0 × 10⁻³ M in a 10 mM HEPES buffer solution with 10 mM sodium chloride at pH 7.5. The concentrations of 1·Zn and dyes were 6.0 × 10⁻⁵ M and 2.0 × 10⁻⁵ M, respectively. UV-vis spectra from 300 nm to 700 nm were recorded in standard 384-well plates using a microplate reader. For the evaluation of the data obtained from the quantitative analysis of the phosphate mixtures we employed an artificial neural network-radial basis function (ANN-RBF) regression method. This method is suitable for modelling complex responses and non-linear behaviour of the data. The ANN-RBF consists of input, hidden and output layers. The input layer does not process the information, and only distributes the input vectors to the hidden layer. The hidden layer of ANN-RBF consists of a number of RBF units.
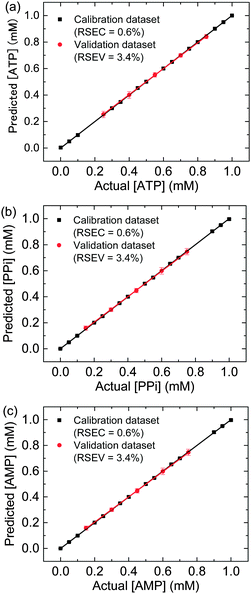
Each neuron on the hidden layer employs a radial basis function as nonlinear transfer function to operate on the input data. The output neurons calculate a linear combination of the basis function.18 Here, fourteen standard ternary mixtures of phosphates were used for the calibration dataset, and another five mixtures were randomly employed for verification of the calibrations (i.e. validation dataset). Before building the ANN models, the spectral data were subjected to a principal component analysis (PCA) as a preprocessing method. The predictive ability of each model for ATP, PPi and AMP was evaluated in terms of relative standard error for determination of concentration in the validation dataset (RSEV%). Two parameters in ANN-RBF are very important to achieve low RSEV%, which are the number of neurons in the hidden layer (hidnod; 12) and the width of the radial basis function (spread; 5.2). To obtain the best regression model for phosphates, we selected the spread and number of hidden nodes at which the RSEV% has a minimum value (Fig. S22, ESI†). In this way the same network was trained for ATP, AMP and PPi. The RSEV% shows a very low error (3.4%). The result of regression analysis is shown in Fig. 6. An evaluation of the model is possible using the visual inspection of the plots of predicted versus actual concentration for ATP, PPi and AMP (Fig. 6) attests to the model prediction power. It is noteworthy that this simple method can simultaneously correctly predict five randomly selected ternary mixtures.
In summary, we have developed self-assembled sensors based on ZnII–DPA-attached to phenylboronic acid 1·Zn. These sensors form brightly colored ensembles with catechol-type dyes (1·Zn–dye). In the presence of phosphates such as ATP, PPi and AMP these sensors display analyte specific color changes that enable quantitative measurement of the phosphate concentrations. In general, the titration experiments in HEPES buffer indicate that the 1·Zn–dye sensors display a higher binding affinity for oligophosphate compared to monophosphate. The colorimetric sensor array based on the 1·Zn–dye reflects the observed changes in color that enable a simultaneous quantitative analysis of phosphate mixtures in water. To the best of our knowledge, this is the first time simultaneous quantitative analysis of phosphate mixtures in water is achieved by a supramolecular sensor. This method could be used to generate a variety of sensor arrays for monitoring of anion mixtures in the near future. Further studies of the microarray using 1·Zn with catechol-type dyes are in progress.
P. A. acknowledges support from Office of Naval Research (Contract No. W909MY-12-C-0031) and NSF (DMR-1006761, ECCS-1202439); Y. K. acknowledges support from JSPS KAKENHI Grant Number 24350075.
References
- J. M. Berg, J. L. Tymoczko, G. J. Gatto, Jr. and L. Stryer, Biochemistry, W H Freeman, NY, USA, 2015 Search PubMed.
- M. Ronaghi, S. Karamohamed, B. Pettersson, M. Uhlén and P. Nyrén, Anal. Biochem., 1996, 242, 84 CrossRef CAS PubMed.
- A. R. Ribeiro, R. M. Santos, L. M. Rosário and M. H. Gil, J. Biolumin. Chemilumin., 1998, 13, 371 CrossRef CAS PubMed.
- (a) A. E. Hargrove, S. Nieto, T. Zhang, J. L. Sessler and E. V. Anslyn, Chem. Rev., 2011, 111, 6603 CrossRef CAS PubMed; (b) S. Lee, K. K. Y. Yuen, K. A. Jolliffe and J. Yoon, Chem. Soc. Rev., 2015, 44, 1749 RSC.
- (a) J. L. Sessler, P. A. Gale and W.-S. Cho, Anion Receptor Chemistry, Monographs in Supramolecular Chemistry, Royal Society of Chemistry, Cambridge, UK, 2006 Search PubMed; (b) N. Busschaert, C. Caltagirone, W. Van Rossom and P. A. Gale, Chem. Rev., 2015, 115, 8038 CrossRef CAS PubMed; (c) M. J. Langton, C. J. Serpell and P. D. Beer, Angew. Chem., Int. Ed., 2016, 55, 1974 CrossRef CAS PubMed.
- (a) K. J. Albert, N. S. Lewis, C. L. Schauer, G. A. Sotzing, S. E. Stitzel, T. P. Vaid and D. R. Walt, Chem. Rev., 2000, 100, 2595 CrossRef CAS PubMed; (b) P. Anzenbacher, Jr., P. Lubal, P. Bucek, M. A. Palacios and M. E. Kozelkova, Chem. Soc. Rev., 2010, 39, 3954 RSC.
- (a) N. A. Rakow and K. S. Suslick, Nature, 2000, 406, 710 CrossRef CAS PubMed; (b) R. Paolesse, D. Monti, F. Dini and C. Di Natale, Top. Curr. Chem., 2011, 300, 139 CrossRef CAS PubMed; (c) L. You, D. Zha and E. V. Anslyn, Chem. Rev., 2015, 115, 7840 CrossRef CAS PubMed; (d) J. Wu, B. Kwon, W. Liu, E. V. Anslyn, P. Wang and J. S. Kim, Chem. Rev., 2015, 115, 7893 CrossRef CAS PubMed.
- (a) E. J. O'Neil and B. D. Smith, Coord. Chem. Rev., 2006, 250, 3068 CrossRef; (b) S. K. Kim, D. H. Lee, J. Hong and J. Yoon, Acc. Chem. Res., 2009, 42, 23 CrossRef CAS PubMed; (c) H. T. Ngo, X. Liu and K. A. Jolliffe, Chem. Soc. Rev., 2012, 41, 4928 RSC; (d) R. Kubota and I. Hamachi, Chem. Soc. Rev., 2015, 44, 4454 RSC.
- (a) E. Galbraith and T. D. James, Chem. Soc. Rev., 2010, 39, 3831 RSC; (b) R. Nishiyabu, Y. Kubo, T. D. James and J. S. Fossey, Chem. Commun., 2011, 47, 1106 RSC.
- X. Sun and T. D. James, Chem. Rev., 2015, 115, 8001 CrossRef CAS PubMed.
- (a) A. Nonaka, S. Horie, T. D. James and Y. Kubo, Org. Biomol. Chem., 2008, 6, 3621 RSC; (b) S. Horie and Y. Kubo, Chem. Lett., 2009, 38, 616 CrossRef CAS.
- J. W. Tomsho and S. J. Benkovic, J. Org. Chem., 2012, 77, 2098 CrossRef CAS PubMed.
- M. Kitamura, S. H. Shabbir and E. V. Anslyn, J. Org. Chem., 2009, 74, 4479 CrossRef CAS PubMed.
- CRC Handbook of Organic Analytical Reagents, ed. K. L. Cheng, K. Ueno and T. Imamura, CRC Press, Boca Raton, USA, 1982 Search PubMed.
- T. Korenaga, S. Motomizu and K. Tôei, Talanta, 1980, 27, 33 CrossRef CAS PubMed.
- A. Hulanicki, S. Glab and G. Ackermann, Pure Appl. Chem., 1983, 55, 1137 CrossRef CAS.
- M. S. Han and D. H. Kim, Angew. Chem., Int. Ed., 2002, 41, 3809 CrossRef CAS.
- (a) Y. Dou, H. Mi, L. Zhao, Y. Ren and Y. Ren, Spectrochim. Acta, Part A, 2006, 65, 79 CrossRef PubMed; (b) M. Hasani and F. Emami, Talanta, 2008, 75, 116 CrossRef CAS PubMed.
Footnotes |
| † Electronic supplementary information (ESI) available: General information of experiments, UV-Vis titrations, MALDI-TOF MS analysis and details of regression analysis. See DOI: 10.1039/c6cc02923j |
| ‡ These authors contributed equally. |
| This journal is © The Royal Society of Chemistry 2016 |

![[thin space (1/6-em)]](https://www.rsc.org/images/entities/char_2009.gif) 000
000