 Open Access Article
Regulating signal enhancement with coordination-coupled deprotonation of a hydrazone switch†
Justin T.
Foy
a,
Debdas
Ray
b and
Ivan
Aprahamian
*c
aSAMS Research Group, University of Strasbourg, Institut Charles Sadron, CNRS, 23 rue du Loess, BP84047, 67034, Strasbourg Cedex 2, France
bDepartment of Chemistry, School of Natural Sciences, Shiv Nadar University, Chithera, Tehsil Dadri, Gautam Budh Nagar-203207, Uttar Pradesh, India
cDepartment of Chemistry, Dartmouth College, 6128 Burke Laboratory, Hanover, NH, USA 03755. E-mail: ivan.aprahamian@dartmouth.edu
First published on 25th September 2014
Abstract
Proton relay plays an important role in many biocatalytic pathways. In order to mimic such processes in the context of molecular switches, we developed coordination-coupled deprotonation (CCD) driven signaling and signal enhancement sequences. This was accomplished by using the zinc(II)-initiated CCD of a hydrazone switch to instigate an acid catalyzed imine bond hydrolysis that separates a quencher from a fluorophore thus leading to emission amplification. Because CCD is a reversible process, we were able to show that the catalysis can be regulated and turned “on” and “off” using a metalation/demetalation cycle.
Introduction
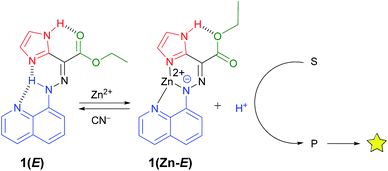
Signal transduction in biological systems relies on receptors that respond to specific inputs in the environment, and then use catalytic reactions to amplify the signal into useful information.1 This complex signaling network is regulated by reversible feedback mechanisms that switch their activity “on” and “off” to maintain homeostasis.2 Recently, there has been interest in designing multicomponent systems3 that use signaling cascades, whereupon one molecule acts as the input to another, as a method towards mimicking the complexity4 of biological processes. Such research is expected to shed light on the origins of life,5 and lead to molecular computing,6 and systems chemistry,7 among other developments. Molecular switches and machines8 have been pursued in this context as enzyme mimics that are capable of controlling through their reversible, stimuli-dependent (mainly light) processes, the active sites of catalysts.9 In doing so, these systems mimic the regulatory activity demonstrated by enzymes.We have recently developed hydrazone-based rotary switches10 that undergo configurational switching (i.e., E/Z isomerization) through a bio-inspired, zinc(II)-initiated coordination-coupled deprotonation (CCD) process.10d We have also demonstrated that CCD can be used in activating two different switches through a sequence of proton relays.10f We reasoned that the CCD induced reversible acid formation could be used to drive a catalytic hydrolysis reaction, similar to what is observed in many biological signaling pathways (e.g. GTPases and phospholipases),1 to yield signal enhancement (Scheme 1).11,12 Herein, we demonstrate how the proton released in CCD can be used in mimicking such processes through the acid catalyzed hydrolysis of anthracen-9-yl-N-(4-nitrophenyl)methanimine13 (ANI). Furthermore, we show that the imine hydrolysis (i.e., catalysis) can be toggled “on” and “off” through metalation/demetalation cycles.
Results and discussion
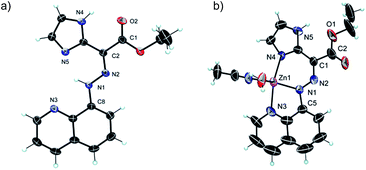
The 1H NMR spectrum of 1(E) (ref. 14) (Fig. 1b) shows the presence of two deshielded resonances at δ = 15.22 and 11.39 ppm, originating from the intramolecularly H-bonded hydrazone and imidazolyl protons, respectively. The crystal structure of 1(E) (Fig. 2a)15 also shows the existence of the intramolecular H-bond between the hydrazone NH proton and quinolinyl (N3) and imidazolyl nitrogens (N5) (H1(N1)⋯N3, 2.35(1) Å, 102.5(1)°, and H1(N1)⋯N5, 1.93(1) Å, 135.8(1)°, respectively). The ester carbonyl oxygen also forms an intramolecular hydrogen bond with the imidazolyl NH proton (H4(N4)⋯O2, 2.21(1) Å, 117.9(1)°). This additional intramolecular H-bond changes the outcome of zinc(II)-initiated CCD in 1(E): instead of an instantaneous E → Z isomerization upon coordination to zinc(II)10d,f the intramolecular H-bond locks the system in its E configuration to form 1(Zn-E). This process was monitored and characterized using 1H NMR spectroscopy (Fig. S5 in ESI†), which shows the disappearance of the hydrazone NH proton, and an up-field shift of the imidazolyl NH signal (δ = 11.93 ppm) upon coordination with zinc(II). Analysis of the crystal structure of 1(Zn-E) (Fig. 2b)16 reveals a shorter intramolecular H-bond between the imidazolyl NH proton and ester oxygen (H5(N5)⋯O1, 2.03(1) Å, 123.9(1)°). The binding of zinc(II) with 1(E) was also studied using UV/Vis spectroscopy (Fig. S25–S27 in ESI†). A Job's plot analysis showed a 1![[thin space (1/6-em)]](https://www.rsc.org/images/entities/char_2009.gif) :
:![[thin space (1/6-em)]](https://www.rsc.org/images/entities/char_2009.gif) 1 binding stoichiometry between 1(E) and zinc(II), with a binding constant of Ka = 1.6 × 10⁴ M−1.
1 binding stoichiometry between 1(E) and zinc(II), with a binding constant of Ka = 1.6 × 10⁴ M−1.
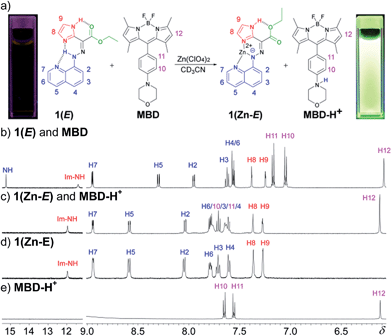
During the titration of 1(E) with zinc(II) (Fig. S8 in ESI†) we observed that CCD was accompanied by the protonation of non-coordinated 1(E). In order to put the released proton to better use (and simplify the characterization process), the CCD initiated process was coupled with a newly developed pH-responsive fluorophore17 (morpholinyl-containing BODIPY (MBD)), which resulted in the turn “on” of its fluorescence emission (Fig. 1a).181H NMR spectroscopy analysis showed that the addition of 1 equiv. of zinc(II) to a 1![[thin space (1/6-em)]](https://www.rsc.org/images/entities/char_2009.gif) :
:![[thin space (1/6-em)]](https://www.rsc.org/images/entities/char_2009.gif) 1 mixture of 1(E) and MBD (Fig. 1b) yields 1(Zn-E) and the protonated MBD compound (MBD-H+) (Fig. 1c). The formation of the former was confirmed by comparing the spectrum obtained via CCD to the one obtained by the dissolution of crystals used in the X-ray crystallographic analysis of 1(Zn-E) (Fig. 1d). The formation of MBD-H+, on the other hand, was confirmed by protonating MBD separately with TFA (Fig. 1e). As can be seen in Fig. 1c protonation causes a downfield shift of the phenyl signals of MBD; from δ = 7.17 (H11) and 7.05 (H10) ppm in the neutral form, to δ = 7.63 (H11) and 7.78 (H10) ppm in the protonated one. No such shifts are observed when zinc(II) is added to MBD (Fig. S32 in ESI†) confirming that protonation results from CCD.
1 mixture of 1(E) and MBD (Fig. 1b) yields 1(Zn-E) and the protonated MBD compound (MBD-H+) (Fig. 1c). The formation of the former was confirmed by comparing the spectrum obtained via CCD to the one obtained by the dissolution of crystals used in the X-ray crystallographic analysis of 1(Zn-E) (Fig. 1d). The formation of MBD-H+, on the other hand, was confirmed by protonating MBD separately with TFA (Fig. 1e). As can be seen in Fig. 1c protonation causes a downfield shift of the phenyl signals of MBD; from δ = 7.17 (H11) and 7.05 (H10) ppm in the neutral form, to δ = 7.63 (H11) and 7.78 (H10) ppm in the protonated one. No such shifts are observed when zinc(II) is added to MBD (Fig. S32 in ESI†) confirming that protonation results from CCD.
This intermolecular proton relay was also probed using fluorescence spectroscopy (Fig. 3). Initially, the fluorescence is quenched most likely because of twisted intramolecular charge transfer.17 Upon titration of zinc(II) into a 1![[thin space (1/6-em)]](https://www.rsc.org/images/entities/char_2009.gif) :
:![[thin space (1/6-em)]](https://www.rsc.org/images/entities/char_2009.gif) 1 mixture of MBD and 1(E), a steady ratiometric increase in fluorescence intensity (λ = 522 nm) was observed as a result of the protonation of MBD. The effect reached saturation when 1 equiv. of zinc(II) was added to the solution (Fig. 3, inset), resulting in a 1000-fold increase in emission intensity.19 A limit of detection (LOD) of 3.9 μM was determined using this CCD initiated signaling mechanism (Fig. S28 in ESI†).20
1 mixture of MBD and 1(E), a steady ratiometric increase in fluorescence intensity (λ = 522 nm) was observed as a result of the protonation of MBD. The effect reached saturation when 1 equiv. of zinc(II) was added to the solution (Fig. 3, inset), resulting in a 1000-fold increase in emission intensity.19 A limit of detection (LOD) of 3.9 μM was determined using this CCD initiated signaling mechanism (Fig. S28 in ESI†).20
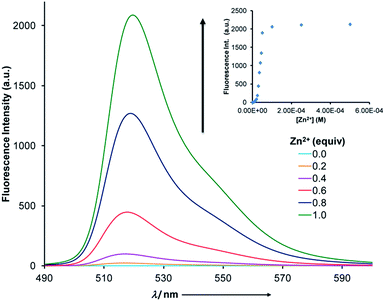 | ||
Fig. 3 Fluorescence spectra (5 × 10⁻⁵ M, CH3CN) of a 1![[thin space (1/6-em)]](https://www.rsc.org/images/entities/char_2009.gif) : :![[thin space (1/6-em)]](https://www.rsc.org/images/entities/char_2009.gif) 1 mixture of 1(E) and MBD as a function of zinc(II) equivalents. The inset shows the 1000-fold increase in emission intensity. 1 mixture of 1(E) and MBD as a function of zinc(II) equivalents. The inset shows the 1000-fold increase in emission intensity. | ||
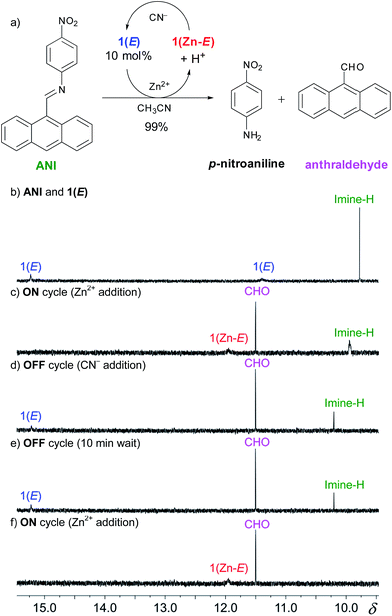
pH-Responsive fluorophores17 have been extensively used in sensing and molecular logic applications, and hence, the above mentioned results are not unexpected.6 However, in most cases the signaling event in such processes relies on one input leading to one output, which is not suitable for designing multicomponent signaling networks.3 In order to expand the scope of our system (i.e., using a single input in generating multiple outputs) and show its ability to reversibly control a catalytic process we explored the potential of coupling the CCD initiated signaling event with an amplification mechanism. We hypothesized that the acid catalyzed hydrolysis of an imine bond could be used to detach a quencher group from a fluorophore. For this purpose, we chose the weakly fluorescent dye ANI, which we speculated will undergo catalytic hydrolysis that will detach the p-nitrophenyl quencher21 and yield the more fluorescent anthraldehyde emitter (Fig. 4a).
This catalytic process was studied using 1H NMR spectroscopy (Fig. S22 in ESI†) with 10 mol% of 1(E). Upon adding 10 mol% of zinc(II) a catalytic amount of acid is produced through CCD that results in complete hydrolysis of ANI within 20 minutes. The maximum turnover number under these conditions is 10, which means that at best each proton is now leading to 10 outputs! This signal enhancement process was also followed using fluorometry (Fig. 5). Upon the addition of 10 mol% of zinc(II) to a 1![[thin space (1/6-em)]](https://www.rsc.org/images/entities/char_2009.gif) :
:![[thin space (1/6-em)]](https://www.rsc.org/images/entities/char_2009.gif) 1 mixture of 1(E) and ANI a steady increase in fluorescence was observed (λ = 522 nm), which reached saturation after 180 minutes.22
1 mixture of 1(E) and ANI a steady increase in fluorescence was observed (λ = 522 nm), which reached saturation after 180 minutes.22
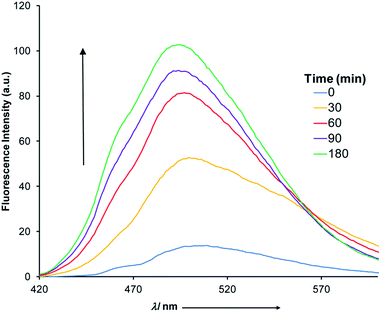 | ||
| Fig. 5 The fluorescence spectra (5 × 10⁻⁵ M, CH3CN) obtained through the CCD mediated catalytic hydrolysis of ANI. | ||
Next we took advantage of the reversible nature of CCD (Fig. S17 in ESI†) to regulate the catalysis and toggle it between the “on” and “off” states. To follow this process we focused on the diagnostic imine and aldehyde proton signals of ANI and the anthraldehyde product, respectively (Fig. 4a). The initial mixture (Fig. 4b) shows the characteristic imine signal of ANI at δ = 9.77 ppm, and the hydrazone and imidazole NH proton signals of 1(E) (catalytic amount)23 at δ = 15.25 and 11.38 ppm, respectively. The addition of Zn(ClO4)2 to the mixture affords 1(Zn-E), with its characteristic imidazolyl resonance at δ = 11.93 ppm (Fig. 4c). The concomitant release of acid results in the hydrolysis of the imine bond and production of anthraldehyde, which results in a signal at δ = 11.50 ppm that grows over time.24 The catalysis was turned “off” with the addition of excess CN− (5 equiv.), which effectively demetalates 1(Zn-E) and restores 1(E), thus stopping the catalytic cycle (Fig. 4d).25 This mixture was monitored for an additional 10 minutes to ensure that the 1H NMR spectrum does not change during the “off” state (Fig. 4e). The hydrolysis can then be turned back “on” with the reintroduction of excess Zn(ClO4)2 (7 equiv.), which results in the complete hydrolysis of ANI within a few minutes.
Conclusions
We have demonstrated how coordination-coupled deprotonation can be used in signaling and catalysis driven signal amplification. These processes are possible because CCD in 1(E) leads to the acidification of the solution, which when coupled with pH sensitive fluorophores leads to fluorescence turn “on”. This was demonstrated with the activation of a new BODIPY dye (MBD) that led to a 1000-fold increase in emission intensity. More importantly, the reversible CCD process was used in regulating signal enhancement by turning the catalytic hydrolysis of ANI “on” and “off” using a metalation/demetalation cycle. We plan to continue with the development of multicomponent switchable systems, and further complicate the processes they can accomplish by using switches that can be activated by orthogonal inputs.26 We hypothesize that this methodology will lead the way towards chemical systems7 with biological level complexity.Acknowledgements
We would like to acknowledge the support of the National Science Foundation CAREER program (CHE-1253385), and the Donors of the American Chemical Society Petroleum Research Fund (51842-DNI4). We gratefully acknowledge Prof. Richard Staples (Michigan State University) for X-ray data.Notes and references
- B. D. Gomperts, I. M. Kramer and P. E. R. Tatham, in Signal Transduction, Academic Press, Waltham, MA, USA, 2nd edn, 2009 Search PubMed.
- (a) A. Boiteux and B. Hess, Philos. Trans. R. Soc., B, 1981, 293, 5–22 CrossRef CAS; (b) M. D. Brand, J. Exp. Biol., 1997, 200, 193–202 CAS; (c) C. B. Newgard, M. J. Brady, R. M. O'Doherty and A. R. Saltiel, Diabetes, 2000, 49, 1967–1977 CrossRef CAS PubMed.
- (a) J.-M. Lehn, Chem.–Eur. J., 2000, 6, 2097–2102 CrossRef CAS PubMed; (b) V. E. Campbell, X. de Hatten, N. Delsuc, B. Kauffmann, I. Huc and J. R. Nitschke, Nat. Chem., 2010, 2, 684–687 CrossRef CAS PubMed; (c) A. G. Salles, S. Zarra, R. M. Turner and J. R. Nitschke, J. Am. Chem. Soc., 2013, 135, 19143–19146 CrossRef CAS PubMed.
- (a) G. M. Whitesides and R. F. Ismagoliv, Science, 1999, 284, 89–92 CrossRef CAS PubMed; (b) J.-M. Lehn, Science, 2002, 295, 2400–2403 CrossRef CAS PubMed.
- J.-M. Lehn, Angew. Chem., Int. Ed., 2013, 52, 2836–2850 CrossRef CAS PubMed.
- (a) A. P. de Silva, H. Q. N. Gunaratne and C. P. McCoy, Nature, 1993, 364, 42–44 CrossRef; (b) F. M. Raymo, Adv. Mater., 2002, 14, 401–414 CrossRef CAS; (c) F. M. Raymo, R. J. Alvarado, S. Giordani and M. A. Cejas, J. Am. Chem. Soc., 2003, 125, 2361–2364 CrossRef CAS PubMed; (d) A. P. de Silva and S. Uchiyama, Nat. Nanotechnol., 2007, 2, 399–410 CrossRef CAS PubMed; (e) V. Balzani, A. Credi and M. Venturi, Chem.–Eur. J., 2008, 14, 26–39 CrossRef CAS PubMed.
- F. R. Ludlow and S. Otto, Chem. Soc. Rev., 2008, 37, 101–108 RSC.
- (a) E. R. Kay, D. A. Leigh and F. Zerbetto, Angew. Chem., Int. Ed., 2007, 46, 72–191 CrossRef CAS PubMed; (b) V. Balzani, A. Credi and M. Venturi, in Molecular Devices and Machines—Concepts and Perspectives for the Nanoworld, Wiley-VCH, Weinheim, 2008 Search PubMed; (c) B. L. Feringa and W. R. Browne, in Molecular Switches, Wiley-VCH, Weinheim, 2nd edn, 2011 Search PubMed; (d) A. Coskun, M. Banaszak, R. D. Astumian, J. F. Stoddart and B. A. Grzybowski, Chem. Soc. Rev., 2012, 41, 19–30 RSC.
- (a) H. J. Yoon, J. Kuwabara, J.-H. Kim and C. A. Mirkin, Science, 2010, 330, 66–69 CrossRef CAS PubMed; (b) R. S. Stoll and S. Hecht, Angew. Chem., Int. Ed., 2010, 49, 5054–5075 CrossRef CAS PubMed; (c) J. Wang and B. L. Feringa, Science, 2011, 331, 1429–1432 CrossRef CAS PubMed; (d) M. J. Wiester, P. A. Ulmann and C. A. Mirkin, Angew. Chem., Int. Ed., 2011, 50, 114–137 CrossRef CAS PubMed; (e) M. Schmittel, S. De and S. Pramanik, Angew. Chem., Int. Ed., 2012, 51, 3832–3836 CrossRef CAS PubMed; (f) V. Blanco, A. Carlone, K. D. Hänni, D. A. Leigh and B. Lewandowski, Angew. Chem., Int. Ed., 2012, 51, 5166–5169 CrossRef CAS PubMed; (g) D. Wilson and N. R. Branda, Angew. Chem., Int. Ed., 2012, 51, 5431–5434 CrossRef CAS PubMed.
- (a) S. M. Landge and I. Aprahamian, J. Am. Chem. Soc., 2009, 131, 18269–18271 CrossRef CAS PubMed; (b) X. Su and I. Aprahamian, Org. Lett., 2011, 13, 30–33 CrossRef CAS PubMed; (c) S. M. Landge, E. Tkatchouk, D. Benitez, D. A. Lanfranchi, M. Elhabiri, W. A. Goddard and I. Aprahamian, J. Am. Chem. Soc., 2011, 133, 9812–9823 CrossRef CAS PubMed; (d) X. Su, T. F. Robbins and I. Aprahamian, Angew. Chem., Int. Ed., 2011, 50, 1841–1844 CrossRef CAS PubMed; (e) D. Ray, J. T. Foy, R. P. Hughes and I. Aprahamian, Nat. Chem., 2012, 4, 757–762 CrossRef CAS PubMed; (f) X. Su, S. Voskian, R. P. Hughes and I. Aprahamian, Angew. Chem., Int. Ed., 2013, 52, 10734–10739 CrossRef CAS PubMed; (g) X. Su and I. Aprahamian, Chem. Soc. Rev., 2014, 43, 1963–1981 RSC; (h) L. Tatum, X. Su and I. Aprahamian, Acc. Chem. Res., 2014, 47, 1214–1224 CrossRef PubMed.
- (a) L. Zhu and E. V. Anslyn, Angew. Chem., Int. Ed., 2006, 45, 1190–1196 CrossRef CAS PubMed; (b) M. Avital-Shmilovici and D. Shabat, Soft Mater., 2010, 6, 1073–1080 RSC; (c) P. Scrimin and L. J. Prins, Chem. Soc. Rev., 2011, 40, 4488–4505 RSC.
- (a) Q. Wu and E. V. Anslyn, J. Am. Chem. Soc., 2004, 126, 14682–14683 CrossRef CAS PubMed; (b) M. S. Maser III, N. C. Gianneschi, C. G. Oliveri, C. L. Stern, S. T. Nguyen and C. A. Mirkin, J. Am. Chem. Soc., 2007, 129, 10149–10158 CrossRef PubMed; (c) H. J. Yoon and C. A. Mirkin, J. Am. Chem. Soc., 2008, 130, 11590–11591 CrossRef CAS PubMed; (d) A. L. Garner, F. Song and L. Koide, J. Am. Chem. Soc., 2009, 131, 5163–5171 CrossRef CAS PubMed; (e) E. Sella, A. Lubelski, J. Klafter and D. Shabat, J. Am. Chem. Soc., 2010, 132, 3945–3952 CrossRef CAS PubMed; (f) E. Sella, R. Weinstain, R. Erez, N. Z. Burns, P. S. Baran and D. Shabat, Chem. Commun., 2010, 46, 6575–6577 RSC; (g) M. S. Baker and S. T. Phillips, J. Am. Chem. Soc., 2011, 133, 5170–5173 CrossRef CAS PubMed; (h) R. Bonomi, A. Cazzolaro, A. Sansone, P. Scrimin and L. J. Prins, Angew. Chem., Int. Ed., 2011, 50, 2307–2312 CrossRef CAS PubMed; (i) H. Mohapatra and K. M. Schmid, Chem. Commun., 2012, 48, 3018–3020 RSC.
- A. Mustafa, Science, 1950, 112, 440 CAS.
- Compound 1(E) was synthesized following the procedure reported in ref. 10e.
- Crystal data for 1(E) (CCDC 862857): C16H15N5O2, M = 309.33, monoclinic, a = 11.6410(8) Å, b = 8.7512(6) Å, c = 14.7356(10) Å, α = 90.00°, β = 92.5980(10)°, γ = 90.00°, V = 1499.61(18) Å3, T = 173(2) K, space group P21/c, Z = 4, 11726 reflections measured, 2739 independent reflections (Rint = 0.0292). The final R1 values were 0.0453 (I > 2σ(I)). The final wR(F2) values were 0.1115 (I > 2σ(I)). The final R1 values were 0.0544 (all data). The final wR(F2) values were 0.1191 (all data).
- Crystal data for 1(Zn-E) (CCDC 990962): (C18H19N6O3Zn)·0.5(C2H3N)·(ClO4), M = 552.74, monoclinic, a = 22.782(2) Å, b = 7.5608(8) Å, c = 26.996(3) Å, α = 90.00°, β = 102.9420(10)°, γ = 90.00°, V = 4531.9(8) Å3, T = 173(2) K, space group C2/c, Z = 8, 18054 reflections measured, 4252 independent reflections (Rint = 0.0710). The final R1 values were 0.0678 (I > 2σ(I)). The final wR(F2) values were 0.1595 (I > 2σ(I)). The final R1 values were 0.1222 (all data). The final wR(F2) values were 0.1888 (all data).
- Z. R. Grabowski, K. Rotkiewicz and W. Rettig, Chem. Rev., 2003, 103, 3899–4039 CrossRef PubMed.
- A. P. de Silva, H. Q. N. Gunaratne, T. Gunnlaugsson, A. J. M. Huxley, C. P. McCoy, J. T. Rademacher and T. E. Rice, Chem. Rev., 1997, 97, 1515–1566 CrossRef CAS PubMed.
- When zinc(II) is added to MBD (Fig. S33 in ESI†) no appreciable increase in emission is observed confirming that protonation results from CCD. Having the morpholinyl group is important as replacing it with a dimethyl amino group results in a false turn “on” with zinc(II).
- This value is comparable to those obtained with various zinc(II) sensors in organic solvents: (a) J.-S. Wu, W.-M. Liu, X.-Q. Zhang, F. Wang, P.-F. Wang, S.-L. Tao, X.-H. Zhang, S.-K. Wu and S.-T. Lee, Org. Lett., 2007, 9, 33–36 CrossRef CAS PubMed; (b) D. Y. Lee, N. Singh, M. J. Kim and D. O. Jang, Tetrahedron, 2010, 66, 7965–7969 CrossRef CAS; (c) J. Cao, C. Zhao, X. Wang, Y. Zhang and W. Zhu, Chem. Commun., 2012, 48, 9897–9899 RSC.
- (a) J. H. Clements and S. E. Webber, Macromolecules, 2004, 37, 1531–1536 CrossRef CAS; (b) E. M. Pérez, D. T. F. Dryden, D. A. Leigh, G. Teobaldi and F. Zerbetto, J. Am. Chem. Soc., 2004, 126, 12210–12211 CrossRef PubMed; (c) D. A. Leigh, M. A. F. Morales, E. M. Pérez, J. K. Y. Wong, C. G. Saiz, A. M. Z. Slawin, A. J. Carmichael, D. M. Haddleton, A. M. Brouwer, W. J. Buma, G. W. H. Wurpel, S. Léon and F. Zerbetto, Angew. Chem., Int. Ed., 2005, 44, 3062–3067 CrossRef CAS PubMed.
- No increase in emission is observed when ANI is treated with zinc(II) (Fig. S30 in ESI†) indicating that the CCD is required for the hydrolysis to occur.
- 20 mol% was used in this case in order to observe the NH signals in the 1H NMR spectrum.
- The addition of zinc(II) to ANI resulted in no changes in the 1H NMR spectrum (Fig. S29 in ESI†) indicating that the CCD is required for the hydrolysis to occur.
- The addition of a high concentration of CN− leads to a side (addition) reaction with the imine (Fig. S23 in ESI†). In order to obtain a cleaner transformation we used TREN as the demetalation agent. This yielded a clean and reversible catalysis (Fig. S24 in ESI†); however, the partial consumption of the released proton by TREN upon reintroduction of zinc(II) to the mixture, significantly slowed down the reaction rate (i.e., hydrolysis completes in 6 h). This also means that now we have a larger turnover number, because less protons are available for catalysis.
- C.-H. Wong and S. C. Zimmerman, Chem. Commun., 2013, 49, 1679–1695 RSC.
Footnote |
| † Electronic supplementary information (ESI) available. CCDC 862857 and 990962. For ESI and crystallographic data in CIF or other electronic format see DOI: 10.1039/c4sc02882a |
| This journal is © The Royal Society of Chemistry 2015 |

