Preparation of temperature sensitive molecularly imprinted polymer coatings on nickel foam for determination of ofloxacin in Yellow River water by solid-phase microextraction†
Xiujuan
Guan
,
Xinyue
Zhu
,
Bianfei
Yu
,
Tong
Zhao
and
Haixia
Zhang
*
State Key Laboratory of Applied Organic Chemistry, College of Chemistry and Chemical Engineering, Lanzhou University, Lanzhou 730000, China. E-mail: zhanghx@lzu.edu.cn
First published on 13th October 2015
Abstract
Nickel foam was firstly used as a solid phase microextraction support to prepare temperature sensitive molecularly imprinted polymers using ofloxacin molecules as the template. The fluorescence intensity could be observed by the naked eye under ultraviolet light after ofloxacin adsorption onto the new materials, which was positively proportional to the adsorbance. After adsorption had occurred, the significantly different fluorescence intensities distinguished the molecularly imprinted polymers from the corresponding non-molecularly imprinted polymers. A detailed evaluation was made by different characterization methods and various adsorption experiments. Finally, the molecularly imprinted polymer on nickel foam was used as an adsorbent in solid phase microextraction, coupled with high performance liquid chromatography, to detect ofloxacin, norfloxacin and enrofloxacin in Yellow River water, obtaining recoveries of 93.2 to 108.3% and limits of quantification of 0.014 to 0.020 μg mL−1.
1. Introduction
Solid-phase microextraction (SPME) was proposed as a sample pretreatment and enrichment method in 1990 and realized commercially by the Supelco company in 1993.1 The basic principle of SPME was established using a pin support and a polymer coating on quartz fiber. However, quartz fiber is too fragile and easily broken, so researchers have introduced other support types such as metal wires, including stainless steel wire,2 aluminium wire,3 silver wire,4 copper wire,5 gold wire,6 platinum filament,7 other metal oxides etc. At the same time, injector needles,8 porous materials,9,10 capillaries,11 PEEK tubes,12 syringes,13 electrospinning,14 synthetic fibers,15,16 other non-metal materials17etc. have also been applied. SPME coatings are designed to expand the varieties, especially with molecular imprinting polymers (MIPs) bolstering their contribution.18,19 Other SPME modes have also developed rapidly, for example, in-tube SPME20,21 and stir bar SPME22 are common alternatives now.Nickel foam sheet (NF), a kind of porous material with suitable hardness, can be folded and cut easily. Owing to its superior specific surface area, it is now usually used in electrochemical super capacitors23 and as an electrode material,24 catalyst and sound-absorbing material. Up to now, there have been no reports on using NF as a SPME support.
MIPs are widely used nowadays as selective adsorbents in solid phase extraction (SPE) and SPME.25,26 To evaluate the imprint factor of an MIP, the non-molecularly imprinted material (NIP) is usually prepared simultaneously. It is difficult to distinguish the topography of an NIP from an MIP intuitively because the grinding destroys their topography after bulk polymerization. Even with surface polymerization, the difficulty still exists and electron microscopy is the most effective tool for the task.27–29
A temperature sensitive molecularly imprinted polymer coating of ofloxacin (OFL) was prepared on steel wires in our previous work.30 The fluorescence intensity was difficult to observe from the material after trace OFL molecules were adsorbed, and desorption was necessary for the quantification. Furthermore, we found that the thick MIP coating split away from the steel wire easily and this was not of benefit to its storage in air. To solve this problem, the MIP coating was prepared on a NF surface in this work (MIP-NF). The advantages of MIP-NF include: (1) a stable and thinner MIP coating was obtained without losing adsorption capacity, which could be stored in air, (2) the fluorescence of MIP-NF, which could be observed by the naked eye under a UV lamp, was an indicator for the semiquantitative analysis of ofloxacin, and (3) a difference in fluorescence strength was observed between MIP-NF and NIP-NF after the same absorbance procedure, which intuitively reflected the different topography of MIP and NIP on NF.
2. Experimental
2.1 Materials
OFL, enrofloxacin (ENR), norfloxacin (NOR) and sulfamerazine (SMZ) were purchased from Shanghai Source Biological Technology Co., Ltd. (Shanghai, China). The compound structures are shown in Fig. S1 (ESI†). 3-Methacryloxypropyltrimethoxysilane (3-MPS), N-isopropyl acrylamide (NIPAAm), dopamine, methacrylate (MAA), acrylamide (AM), rhodamine B (RhB) and ethylene glycol dimethacrylate (EGDMA) were purchased from Aladdin Reagent Co., Ltd. (Shanghai, China). MAA and EGDMA were used after vacuum distillation. Azodiisobutyronitrile (AIBN) was purchased from Tianjin Yuefeng Chemical Co., Ltd. (Tianjin, China) and used after recrystallization. Methanol (MeOH), ethanol (EtOH), acetone, dimethyl sulfoxide (DMSO), chloroform, acetic acid (HAc), triethylamine (TEA), disodium hydrogen phosphate dihydrate and others were purchased from Tianjin Guangfu Chemical Co., Ltd. (Tianjin, China). Phosphoric acid was purchased from Chengdu Kelong Chemical Co., Ltd. (Chengdu, China). All the reagents were of analytical grade. Ultrapure water was from a MILLI-Q ultrapure water system (Millipore, Bedford, MA, USA). NF (1.6 mm thickness) was purchased from Hunan Changdeliyuan Co., Ltd. (Changsha, China).2.2 Instruments and chromatographic conditions
UV-Vis experiments were carried out using a UV-Vis spectrophotometer (TU-1810, PUXI, Beijing). Fourier transform infrared (FTIR) spectra were acquired with a Nicolet 20 NEXUS 670 FTIR spectrophotometer (Ramsey, MA, USA) using KBr pellets; scanning electron microscope (SEM) images of the materials were obtained using an S-94 4800 SEM (Hitachi, Japan). Nitrogen adsorption–desorption measurements were performed at 77 K using a Tristar ASAP 2020M Surface Area and Porosimetry analyzer (Micromeritics Instruments Corp., USA). The surface area measurement was based on the Brunauer–Emmett–Teller (BET) method, and the pore-size distribution was based on the Barrett–Joyner–Halenda (BEJ) formula. Thermogravimetric analysis was performed using a TGA up to 800 °C with a heating rate of 10 K min−1 in air (STA PT 1600, Linseis, Germany).Chromatographic analysis was carried out using a high performance liquid chromatography (HPLC) system (Varian, USA) equipped with two 210 pumps, a 325 UV-Vis detector, a Varian star chromatographic workstation and a six-port injection valve. The HPLC operation conditions included a reversed-phase C18 column (4.6 × 250 mm, 5 μm, Dikma technologies, Beijing, China) and a mobile phase of methanol/phosphate buffer (0.01 mol L−1, pH = 2.70, v/v = 28/72, filtered through a 0.45 μm membrane). Flow rate: 1.0 mL min−1; injection volume: 20 μL; detection wavelength: 290 nm.
2.3 Preparation of MIPs
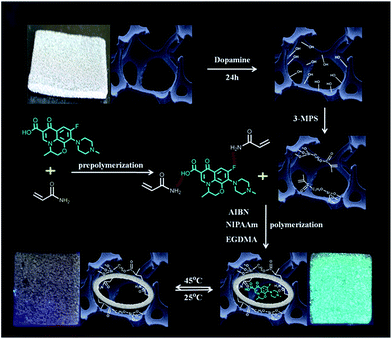
The dried NF pieces were put in 20 mL of Tris–HCl solution (pH = 8.50) containing 2 mg mL−1 dopamine and kept in the dark for 24 h to obtain dopamine modified NF (D-NF). After washing with methanol, the pieces of D-NF were kept in 10 mL of 3-MPS/H2O/MeOH solution (v/v/v = 1![[thin space (1/6-em)]](https://www.rsc.org/images/entities/char_2009.gif) :
:![[thin space (1/6-em)]](https://www.rsc.org/images/entities/char_2009.gif) 1
1![[thin space (1/6-em)]](https://www.rsc.org/images/entities/char_2009.gif) :
:![[thin space (1/6-em)]](https://www.rsc.org/images/entities/char_2009.gif) 8) for 30 min, followed by heating at 100 °C for 120 min. The product (Si-NF) was washed with methanol and dried.
8) for 30 min, followed by heating at 100 °C for 120 min. The product (Si-NF) was washed with methanol and dried.
![[thin space (1/6-em)]](https://www.rsc.org/images/entities/char_2009.gif) :
:![[thin space (1/6-em)]](https://www.rsc.org/images/entities/char_2009.gif) 2) was added 0.9 mmol of OFL, 3.15 mmol of NIPAAm and 3.6 mmol of MAA. Pre-polymerization with ultrasonication was continued for 1 h and then 1.8 mmol of EGDMA, 0.24 mmol of AIBN and 4 pieces of Si-NF were added in sequence. The polymerization was continued in an oil bath at 70 °C for 6 h to obtain the MIP materials (MIP-NF).
2) was added 0.9 mmol of OFL, 3.15 mmol of NIPAAm and 3.6 mmol of MAA. Pre-polymerization with ultrasonication was continued for 1 h and then 1.8 mmol of EGDMA, 0.24 mmol of AIBN and 4 pieces of Si-NF were added in sequence. The polymerization was continued in an oil bath at 70 °C for 6 h to obtain the MIP materials (MIP-NF).
The MIP-NF pieces were sunk into 50 mL of methanol/acetic acid (v/v = 97![[thin space (1/6-em)]](https://www.rsc.org/images/entities/char_2009.gif) :
:![[thin space (1/6-em)]](https://www.rsc.org/images/entities/char_2009.gif) 3) with slight oscillation at 45 °C for 24 h to remove the template molecules (renewing the solution every 3 h). The MIP-NF pieces were kept in air until use.
3) with slight oscillation at 45 °C for 24 h to remove the template molecules (renewing the solution every 3 h). The MIP-NF pieces were kept in air until use.
The corresponding NIP materials (NIP-NF) were prepared as above in the absence of OFL.
The MIP-NF materials with ENR and RhB were prepared under the same conditions. The preparation procedure is illustrated in Fig. 1.
2.4 Study on the adsorption properties of MIP-NF
First, the solvent used to prepare the OFL solution was chosen. H2O, ethanol and acetonitrile were used to prepare 10 mL solutions with 2 μg mL−1 OFL. A piece of MIP-NF was kept in each solution at 25 °C for 24 h. The residual OFL concentration in the solutions was measured and the adsorption capacities of MIP-NF were calculated and compared with each other.Then, the temperature sensitivity of MIP-NF was tested. A piece of MIP-NF was immersed in 10 mL of 2 μg mL−1 OFL aqueous solution at 25, 35 or 45 °C for 24 h. After adsorption, on the one hand, the MIP-NF was taken out and put in 10 mL of water to desorb the OFL. The desorption was continued for 1 h at 25, 35 or 45 °C, and the OFL concentration in the water was determined. On the other hand, the adsorption capacities of MIP-NF at different temperatures were obtained by measuring the residual OFL concentration in the adsorption solution.
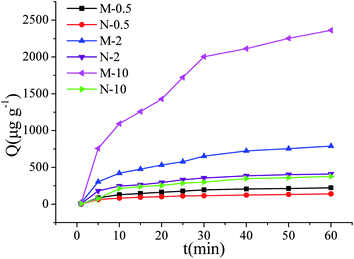
Lastly, 10 mL aqueous solutions with 0.5, 2 or 10 μg mL−1 OFL were prepared and to each solution one piece of MIP-NF was added to conduct the adsorption. At different time intervals from 1 to 60 min, 1 mL of the solution was taken out to measure the OFL concentration and the solution was replenished with 1 mL of water to keep the volume constant.
All the above measurements were carried out using a UV-Vis spectrometer at 290 nm to obtain the absorbance of OFL. The adsorption amounts were calculated according to a standard curve which obeys the Beer–Lambert law. All the experiments were repeated three times and the average value was used.
2.5 The imprint factor and selectivity of MIP-NF
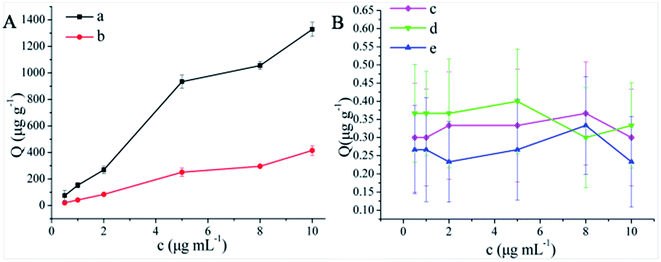
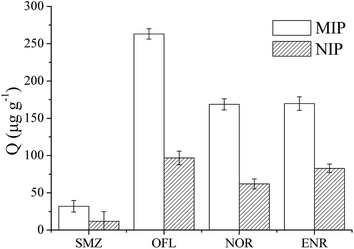
Pieces of NF, D-NF, Si-NF, NIP-NF and MIP-NF were put into 10 mL OFL aqueous solutions with different concentrations (0.5, 1, 2, 5, 8, 10 μg mL−1) to compare their adsorption capability. The static adsorption was continued for 24 h at 25 °C. The imprint factor α was obtained by dividing the adsorption capacity (Q, μg g−1) of the MIP by that of the NIP.A piece of NIP-NF or MIP-NF was kept in 10 mL of a mixture of OFL, ENR, NOR and SMZ (each 1 μg mL−1) at 25 °C for 24 h. After the adsorption, the residual concentration of each compound was calculated using their standard curves after HPLC analysis.
2.6 Application
Using MIP-NF as an extraction adsorbent, coupled with HPLC analysis, the OFL, ENR and NOR content of Yellow River water was measured.Yellow River water was sampled from the Tanjianzi section of the Yellow River in Lanzhou city. The water samples were filtered through a 0.45 μm membrane and kept at 4 °C for no more than 24 h before use.
The SPME was carried out under the following conditions: a piece of MIP-NF was put into 10 mL of water sample or the samples spiked with OFL, ENR and NOR (0.025–1.0 μg mL−1), and the extraction was continued for 30 min at 25 °C with gentle shaking. The desorption of OFL from MIP-NF with 2 mL of 3% acetic acid in methanol was repeated three times, for 5 min each at 45 °C. All of the desorption solutions were merged together and blow-dried with nitrogen. Finally, the residue was redissolved in 200 μL of MeOH and 20 μL was injected for HPLC analysis.
3. Results and discussion
3.1 Preparation of materials
Temperature sensitive MIPs based on stainless steel fibers were prepared in our previous work.30 However, a major drawback of the prepared material is its fragility and the materials have to be soaked in methanol before use. Some improvements have been made on the basis of the previous work to solve this problem including increasing the amount of solvent and decreasing the polymerization time, and by using NF with a larger surface area as the support. As a result, the polymer layer was thin enough to prevent it from peeling off and it could be stored in the air easily.3.2 Characterization
SEM photographs of the NF and MIP materials are shown in Fig. 2. After modification, the smooth NF surface (1, 3, 5 in Fig. 2) was covered with granular polymers (2, 4, 6 in Fig. 2). The NF had a particularly regular morphology and could act as a good support for SPME.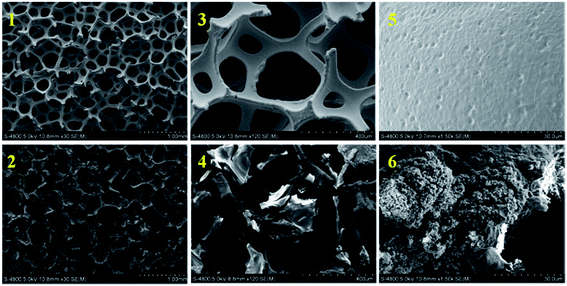 | ||
| Fig. 2 Scanning electron micrographs of NF (1, 3, 5) and MIP-NF (2, 4, 6): (1, 2) ×30, (3, 4) ×120 and (5, 6) ×1500 magnification. | ||
Corresponding photographs were obtained to trace the synthesis procedure (Fig. S2, ESI†). The color of the surface of the NF changed a great deal. After the MIP and NIP modification, the NF presented different colors owing to the polymers having different pores and densities, which meant it was easy to differentiate NIP and MIP with the naked eye when NF was the support.
The IR spectra of the MIP and NIP materials were used to certify the success of the synthesis (Fig. S3, ESI†), and the thermogravimetric curves of the prepared materials at 0–800 °C could reflect their stability (Fig. S4, ESI†). The MIP lost 4.1% weight over 0–295 °C owing to the volatilization of water or other solvents. The second weight loss was over 295–450 °C, attributed to the decomposition of the organic polymer. The slight difference in weight loss between MIP and NIP was due to the different degree of cross-linking in the polymers.
The results of elemental analysis are shown in Table S1 (ESI†). The amount of the C and N elements in the MIP before and after the removal of the templates are different, which proves that the template molecules present from the MIP synthesis could be removed. After elution of the template, the cavities left in the MIP should re-adsorb the template molecules from the samples.
The data for N2 adsorption, as summarized in Table S2 (ESI†), was used to investigate the pore diameter range DBJH, the pore volume VBJH and the surface area SBET of the NIP and MIP. All the data for the MIP are larger than the corresponding data for the NIP. That is, the MIP has a larger surface area, larger pore diameter and larger pore volume, which is easy to explain as being the result of the cavities left by the template molecules.
3.3 Adsorption experiments
The OFL standard curve in water with the UV method was obtained with the linear equation A = 340.8c − 36.87, R2 = 0.9998 (A: absorbance, c: μg mL−1).
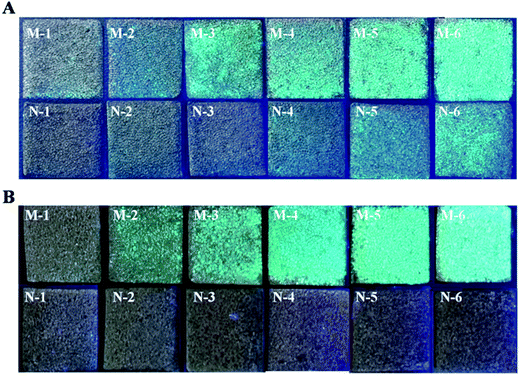
In addition, the aggregation phenomenon induced fluorescence quenching was reversible. The fluorescence of NIP-NF was restored while NIP-NF was immersed in water.
We prepared other two MIP-NFs using ENR and RhB as templates to verify the correctness of the aggregation mechanism. The static adsorption experiments were carried out under the same conditions as those for OFL except for the different concentrations. The corresponding results are given in the ESI.† The fluorescence differences for the MIP-NF and NIP-NF with ENR were the same as those with OFL (Fig. S5, ESI†). The phenomena of the MIP-NF and NIP-NF with RhB were a little different to those with OFL (Fig. S6, ESI†). When the concentration of RhB was lower, the same phenomena as those with OFL were obtained. A higher RhB concentration caused a larger amount of adsorption, which not only made the fluorescence of the MIP-NF and NIP-NF much brighter but also an obvious color appeared (Fig. S7, ESI†). The difference in phenomena between RhB and OFL might result from the strong adsorption property of RhB and its bright color, which disturbed the observation of fluorescence.
3.4 Application
MIP-NF was used to determine the antibiotics in Yellow River water, coupled with HPLC under the optimal extraction conditions. The desorption conditions were then optimized. Normally a mixture of an organic solvent and an acid was used.30 We compared the desorption results for different acetic acid content (1%, 3% and 10%) in methanol as the eluent. A high acetic acid concentration (10%) could destroy the nickel foam and 1% acetic acid could not desorb the molecules effectively, so 3% acetic acid in methanol was adopted in this experiment. The desorption volume and time were also investigated and the results showed that 3 × 200 μL could elute more than 90% of the OFL from the MIP-NF.The linear scope, standard curve, and limits of detection (LODLC, with a signal-to-noise ratio (S/N) of 3![[thin space (1/6-em)]](https://www.rsc.org/images/entities/char_2009.gif) :
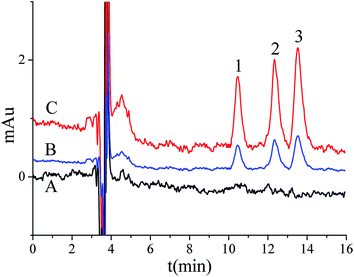
:![[thin space (1/6-em)]](https://www.rsc.org/images/entities/char_2009.gif) 1) and quantification (LOQLC, the minimum amount that could be quantified) are summarized in Table 1. The recoveries and RSD% are shown in Table 2. It was found that satisfactory recoveries (from 93.2–108.3%) were obtained. The LOQLC values for OFL, NOR and ENR were 0.020, 0.015 and 0.014 μg mL−1, respectively. The LOQLC value for OFL was half that of the previous result with steel wire,30 which verified the benefit of using NF as the support. Chromatograms of the standard addition of the three antibiotics in Yellow River water (25 ng mL−1) are shown in Fig. 7. No antibiotics were found in the sample. Comparing the chromatographic peaks of B (0.25 μg mL−1, direct injection) with C (0.025 μg mL−1, after MIP-NF treatment), the enrichment efficiency was satisfactory.
1) and quantification (LOQLC, the minimum amount that could be quantified) are summarized in Table 1. The recoveries and RSD% are shown in Table 2. It was found that satisfactory recoveries (from 93.2–108.3%) were obtained. The LOQLC values for OFL, NOR and ENR were 0.020, 0.015 and 0.014 μg mL−1, respectively. The LOQLC value for OFL was half that of the previous result with steel wire,30 which verified the benefit of using NF as the support. Chromatograms of the standard addition of the three antibiotics in Yellow River water (25 ng mL−1) are shown in Fig. 7. No antibiotics were found in the sample. Comparing the chromatographic peaks of B (0.25 μg mL−1, direct injection) with C (0.025 μg mL−1, after MIP-NF treatment), the enrichment efficiency was satisfactory.
| Compound | Linear equation | Linear scope (ng mL−1) | R 2 | LOD (ng mL−1) | LOQ (ng mL−1) |
|---|---|---|---|---|---|
| OFL | Y = 51.38X + 13.66 | 20–50![[thin space (1/6-em)]](https://www.rsc.org/images/entities/char_2009.gif) 000 000 |
0.9998 | 6.021 | 20.02 |
| NOR | Y = 106.4X − 12.30 | 15–50![[thin space (1/6-em)]](https://www.rsc.org/images/entities/char_2009.gif) 000 000 |
0.9999 | 4.451 | 14.84 |
| ENR | Y = 112.0X − 28.61 | 14–50![[thin space (1/6-em)]](https://www.rsc.org/images/entities/char_2009.gif) 000 000 |
0.9999 | 4.229 | 14.10 |
| Added concentration (μg mL−1) | Recovery (%) | Intra RSD (%) | Inter RSD (%) | ||||||
|---|---|---|---|---|---|---|---|---|---|
| OFL | NOR | ENR | OFL | NOR | ENR | OFL | NOR | ENR | |
| 0.05 | 109.6 | 93.2 | 98.2 | 5.06 | 4.43 | 3.48 | 5.87 | 4.74 | 5.11 |
| 1 | 96.9 | 108.3 | 100.1 | 6.52 | 3.43 | 5.54 | 3.61 | 3.61 | 3.62 |
| 5 | 99.9 | 100.9 | 101.3 | 6.02 | 4.42 | 4.54 | 3.52 | 3.52 | 1.20 |
4. Conclusion
A new MIP of ofloxacin with nickel foam as the support was obtained through modification with dopamine, silane and a thin MIP coating in sequence. After the adsorption of ofloxacin, the MIP on nickel foam showed the obvious fluorescence, which could allow direct semiquantitative analysis. The difference in fluorescence changes between the MIP and NIP, caused by aggregation induced fluorescence quenching in the NIP, reflected their different topology and the different kind of adsorption sites on the MIP and NIP. The MIP material on nickel foam benefits from good selectivity, superior adsorption capacity and simple SPME operation.Acknowledgements
The authors thank the funding from Gansu Province Science and Technology Support Program (1204FKCA127) and the National Science Foundation of China (21375052).References
- C. L. Arthur and J. Pawliszyn, Anal. Chem., 1990, 62, 2145–2148 CrossRef CAS.
- X. Hu, G. Dai, J. Huang, T. Ye, H. Fan, T. Youwen, Y. Yu and Y. Liang, J. Chromatogr. A, 2010, 1217, 5875–5882 CrossRef CAS PubMed.
- D. Djozan, B. Ebrahimi, M. Mahkam and M. A. Farajzadeh, Anal. Chim. Acta, 2010, 674, 40–48 CrossRef CAS PubMed.
- B. B. Prasad, M. P. Tiwari, R. Madhuri and P. S. Sharma, J. Chromatogr. A, 2010, 1217, 4255–4266 CrossRef CAS PubMed.
- P. Hashemi, M. Shamizadeh, A. Badiei, P. Z. Poor, A. R. Ghiasvand and A. Yarahmadi, Anal. Chim. Acta, 2009, 646, 1–5 CrossRef CAS PubMed.
- M. Mattarozzi, M. Giannetto, A. Secchi and F. Bianchi, J. Chromatogr. A, 2009, 1216, 3725–3730 CrossRef CAS PubMed.
- W. Du, F. Zhao and B. Zeng, J. Chromatogr. A, 2009, 1216, 3751–3757 CrossRef CAS PubMed.
- M. M. Moein, D. Jabbar, A. Colmsjö and M. Abdel-Rehim, J. Chromatogr. A, 2014, 1366, 15–23 CrossRef CAS PubMed.
- Z. Zhang, Q. Wang and G. Li, Anal. Chim. Acta, 2012, 727, 13–19 CrossRef CAS PubMed.
- J. Yang, Y. Li, J. Wang, X. Sun, S. M. Shah, R. Cao and J. Chen, Anal. Chim. Acta, 2015, 853, 311–319 CrossRef CAS PubMed.
- F. Tan, H. Zhao, X. Li, X. Quan, J. Chen, X. Xiang and X. Zhang, J. Chromatogr. A, 2009, 1216, 5647–5654 CrossRef CAS PubMed.
- J. Zhang, W. Zhang, T. Bao and Z. Chen, J. Chromatogr. A, 2015, 1388, 9–16 CrossRef CAS PubMed.
- M. García-Valverde, R. Lucena, F. Galán-Cano, S. Cárdenas and M. Valcárcel, J. Chromatogr. A, 2014, 1343, 26–32 CrossRef PubMed.
- S. Chigome and N. Torto, TrAC, Trends Anal. Chem., 2012, 38, 21–31 CrossRef CAS PubMed.
- E. M. Reyes-Gallardo, R. Lucena, S. Cárdenas and M. Valcárcel, J. Chromatogr. A, 2014, 1345, 43–49 CrossRef CAS PubMed.
- V. Samanidou, L.-D. Galanopoulos, A. Kabir and K. G. Furton, Anal. Chim. Acta, 2015, 855, 41–50 CrossRef CAS PubMed.
- Y.-B. Luo, B.-F. Yuan, Q.-W. Yu and Y.-Q. Feng, J. Chromatogr. A, 2012, 1268, 9–15 CrossRef CAS PubMed.
- X. Hu, Y. Fan, Y. Zhang, G. Dai, Q. Cai, Y. Cao and C. Guo, Anal. Chim. Acta, 2012, 731, 40–48 CrossRef CAS PubMed.
- J. Gauczinski, Z. Liu, X. Zhang and M. Schönhoff, Langmuir, 2012, 28, 4267–4273 CrossRef CAS PubMed.
- S. Xu, X. Zhang, Y. Sun and D. Yu, Analyst, 2013, 138, 2982–2987 RSC.
- M. Mei, X. Huang and D. Yuan, J. Chromatogr. A, 2014, 1345, 29–36 CrossRef CAS PubMed.
- J. Aguirre, E. Bizkarguenaga, A. Iparraguirre, L. Á. Fernández, O. Zuloaga and A. Prieto, Anal. Chim. Acta, 2014, 812, 74–82 CrossRef CAS PubMed.
- L. Gu, Y. Wang, R. Lu, L. Guan, X. Peng and J. Sha, J. Chromatogr. A, 2014, 2, 7161–7164 CAS.
- H. Wang, G. Wang, Y. Ling, F. Qian, Y. Song, X. Lu, S. Chen, Y. Tong and Y. Li, Nanoscale, 2013, 5, 10283–10290 RSC.
- F. Ning, H. Peng, J. Li, L. Chen and H. Xiong, J. Agric. Food Chem., 2014, 62, 7436–7443 CrossRef CAS PubMed.
- S. Farzaneh, E. Asadi, M. Abdouss, A. Barghi-Lish, S. Azodi-Deilami, H. A. Khonakdar and M. Gharghabi, RSC Adv., 2015, 5, 9154–9166 RSC.
- W. Ji, L. Chen, X. Ma, X. Wang, Q. Gao, Y. Geng and L. Huang, J. Chromatogr. A, 2014, 1342, 1–7 CrossRef CAS PubMed.
- Z. Xu, Z. Yang and Z. Liu, J. Chromatogr. A, 2014, 1358, 52–59 CrossRef CAS PubMed.
- X. Liu, Z. Chen, J. Long, H. Yu, X. Du, Y. Zhao and J. Liu, Ind. Eng. Chem. Res., 2014, 53, 16082–16090 CrossRef CAS.
- T. Zhao, X. Guan, W. Tang, Y. Ma and H. Zhang, Anal. Chim. Acta, 2015, 853, 668–675 CrossRef CAS PubMed.
Footnote |
| † Electronic supplementary information (ESI) available. See DOI: 10.1039/c5ra15031k |
| This journal is © The Royal Society of Chemistry 2015 |

