A simple and effective 1,2,3-triazole based “turn-on” fluorescence sensor for the detection of anions†
Debanjana
Ghosh
a,
Shannon
Rhodes
a,
Karena
Hawkins
a,
Domonique
Winder
a,
Austin
Atkinson
a,
Weihua
Ming
a,
Clifford
Padgett
b,
Jeffrey
Orvis
a,
Karelle
Aiken
a and
Shainaz
Landge
*a
aDepartment of Chemistry, Georgia Southern University, PO Box 8064, Statesboro, GA 30460, USA. E-mail: slandge@georgiasouthern.edu
bDepartment of Chemistry and Physics, Armstrong Atlantic State University, 11935 Abercon Street, Savannah, GA 31419, USA
First published on 16th October 2014
Abstract
A novel and effective 1,2,3-triazole based fluorescence chemosensor has been synthesized for the specific detection of anions in homogeneous medium. Notably, the molecule, synthesized in one step using “Click chemistry”, is a simple 1,4-diaryl-1,2,3-triazole, containing a phenol moiety. The probe displayed the strongest response to fluoride ion through the “turn-on” fluorescence sensing mechanism when screened for selectivity and sensitivity against a series of anions (F−, Cl−, Br−, I−, H2PO4−, ClO4−, OAc−, BF4−). Fluorescence spectroscopy and Nuclear Magnetic Resonance Spectroscopy (NMR) studies substantiate 1![[thin space (1/6-em)]](https://www.rsc.org/images/entities/char_2009.gif) :
:![[thin space (1/6-em)]](https://www.rsc.org/images/entities/char_2009.gif) 1 stoichiometry between the probe and fluoride anion. Kinetic studies and the single crystal X-ray spectroscopic evidence revealed the binding interaction occurs with the phenolic group and the anion.
1 stoichiometry between the probe and fluoride anion. Kinetic studies and the single crystal X-ray spectroscopic evidence revealed the binding interaction occurs with the phenolic group and the anion.
Introduction
The development of novel organic systems capable of molecular recognition is making a strong influence in supramolecular chemistry.1–7 When a molecular sensor responds to external stimuli, significant and observable changes in properties such as color and fluorescence take place. Colorimetric and fluorescent sensors recognize and sense various anions on the basis of a variety of signaling mechanisms, for example: photoinduced electron transfer (PET),6 metal-to-ligand charge transfer (MLCT);8 excimer/exciplex formation,9 intramolecular charge transfer (ICT);3,4 and excited state intra/intermolecular proton transfer (ESPT).10 These interactions can occur via hydrogen bonding,11 deprotonation12 and competitive binding,13 irreversible or reversible. Most desirable in this respect are the sensors with high sensitivity and easy signaling capability that respond with a dramatic change in color and/or fluorescence at sub-parts-per-million levels14,15 of the analyte concentration.2 The ability of a molecule to act selectively as a receptor depends on its affinity for binding the targeted substrate. Hence, there is great opportunity to rationally design sensors with specific, implemented functions that recognize a given analyte only when the “proper” external stimulus is applied.16Though anions are essential in biological and environmental systems, anion recognition and sensing has only recently captured the attention of supramolecular chemists.17 Fluoride in particular has gained considerable focus because of its health effects. This anion is well-known for its potential to enhance dental18 and bone health.19 However, harmful repercussion due to overexposure from a high concentration (level of natural fluoride ranges from 0.5 to 48 ppm or more) in ground water resulted in fluorosis.20 In industrial and military applications,21 nuclear power and weaponry, the sensing of fluoride can be used to probe uranium enrichment22 and in chemical warfare, fluoride recognition can expedite the tracking of phosphorofluoridate nerve agents such as sarin.23 Great efforts in research are dedicated to designing highly conjugated, organic fluoride receptors with protic units such as urea,24 thiourea,25 sulfonamide,26 amide27 or phenolic groups.28 Such sensors respond to the hard basicity of fluoride via a Brønsted acid–base reaction and/or hydrogen bond formation at the N–H and O–H moieties.
The possibilities are endless in the development of small molecular organic sensors for fluoride detection and thus continued study in this area is warranted for a number of reasons. In general, well-designed, small organic receptors are readily mobile tools that lend themselves to the detection of anions in intracellular, biological and environmental assays. Furthermore, sensors that can relay information about anion concentration through reversible interactions present an opportunity for the development of reusable materials and switchable (logic-gate) systems.29 Indeed, small molecule fluoride sensors are suitable for inclusion in polymers30 and fabrication on materials.31–34
With the evolution of “Click chemistry”,35 1,4-disubstituted-1,2,3-triazoles have become motifs in chemical sensors. Even though the Click-derived triazoles are generally used as a convenient method of ligation, their prevalence in chemosensors can be attributed to their ability to bind with both cations and anions. In addition to the synthetic simplicity and modular nature of reaction, the triazole cores have promising photophysical and structural properties that enhance their ability to perform a variety of important roles in sensing,36 for example: binding to the target analyte, acting as a linker between binding site and the reporter, and contributing to the reporter as a part of a conjugated fluorophore.37 In anion sensing, the triazole's polar Csp2–H bond in neutral 1,4-diaryl-1,2,3-triazoles is an electropositive site that can also function as an effective hydrogen bond donor for binding.38
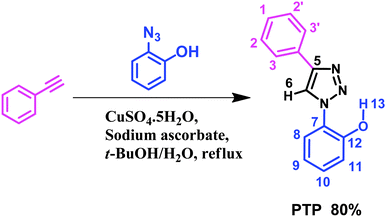
Herein we report the results for a diaryl triazole, 2-(4-phenyl-1-H-1,2,3-triazol-1-yl) phenol (PTP), (Scheme 1) which “turn-on” in the presence of fluoride upon irradiation at 290 nm. The sensor, efficiently synthesized in one step, interacts with the anion by the phenolic –OH via deprotonation and resides in the close vicinity of triazole's Csp2–H site. Investigations with Nuclear Magnetic Resonance Spectroscopy (NMR), UV-absorption and fluorescence spectroscopy were undertaken to probe the nature of the molecule's response to (i) varied concentrations of F− and (ii) other anions such as Cl−, Br−, I−, H2PO4−, ClO4−, OAc−, BF4− as their tetrabutylammonium salts. Overall, our results demonstrate strong fluoride signaling capabilities in PTP.
Results and discussion
The structure of the probe PTP, discussed in the following sections is fully characterized by Nuclear Magnetic Resonance (1D and 2D). It allowed to accurately assign all the signals along with the binding pocket of the probe with the anions. The modulation in the photophysics of the probe upon addition of the anions has been exploited by steady state absorption and fluorescence of PTP. Hence the binding stoichiometry has been determined from these results.NMR studies
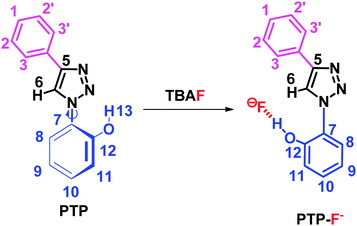
The structure of PTP and PTP+F− were explored by NMR spectroscopy in deuterated acetonitrile. The 1H NMR spectrum of PTP (see ESI,† Fig. S1) shows the distinctive triazole proton singlet of H-6 at 8.65 ppm. It is typical for the 1,2,3-triazole C–H proton to be easily distinguished from the other protons and for that particular reason it has been exploited in many applications39 and in our studies. The phenolic proton H-13 appears in the region of 8.68 ppm as a broadened singlet, if visible. The aromatic region of the proton spectrum shows the expected coupling patterns (from δ 7.00–8.00 ppm), supported by correlation spectroscopy (COSY) experiments (see ESI,† Fig. S3). In the 13C NMR experiments, the resonances for PTP (see ESI,† Fig. S2) were accurately assigned with the help of DEPT, HSQC and HMBC experiments (see ESI,† Fig. S4, S5 and S6 respectively). NOE experiments with PTP show a clear H-6 correlation with H-3 and H-8 (Scheme 2, see ESI,† Fig. S7). Further support for the proposed conformation for the PTP probe came from a similar molecule whose crystal structure shows the triazole nitrogen and the phenolic proton in close proximity but ruled out the possibility of hydrogen bonding between them.40In order to unveil a plausible mechanism and decipher the binding sites, the structure of the probe with the fluoride anion (PTP+F−) has been confirmed by single X-ray crystallography and NMR experiments. The thermal ellipsoid is shown in Fig. 1. The probe is almost planar showing that the fluoride is hydrogen bonded to the phenolic –OH and is in close proximity to the triazole Csp2–H proton.
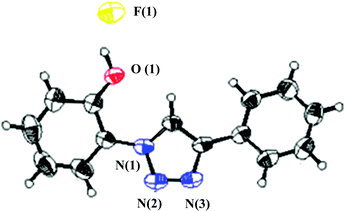 | ||
| Fig. 1 ORTEP drawing (50% probability ellipsoids) of PTP+F−. The protons are placed in calculated positions. | ||
The 1H NMR and 13C NMR titration experiments were conducted with gradual addition of 0 to 8 equivalents of TBAF (Fig. 2 and 3 respectively). In 1H NMR spectrum, the –OH signal which appears at 8.68 ppm disappears immediately upon addition of TBAF suggesting the binding occurs almost instantly when it comes in contact with the anion.41 Perturbation of this –OH bond leads to several chemical shift changes in the spectra. The proton (H-9) para to the –OH group moves upfield (∼1 ppm) with increased concentration of TBAF, while H-11 which is ortho shows a small downfield shift at 0.4–1.0 eq. fluoride concentration, that reverses to a substantial upfield shift at higher concentrations, >2.0 eq. The strong upfield shift by phenolic protons not only shows its major role in the binding region but also advocates the increased electron density with a through-bond propagation,42 especially at H-9 and H-11. Not surprisingly, H-10 which is meta to the –OH unit displays a more modest upfield shift of 0.4 ppm. The triazole proton (8.65 ppm, H-6) moves downfield by ∼1 ppm as the fluoride concentration increases from 0 to 8 eq. Deshielding effect in the triazole C–H protons has been observed when such molecules come into close contact with anions43 suggesting the polarizing, hydrogen-bonding-like interaction with the fluoride anion. Protons H-1, H-2, H-3 and interestingly H-8 show very little change in chemical shift over the course of titration. The lack of significant changes at the H-8 and phenyl protons (H1–H3) further confirms that the major binding sites for fluoride ion are indeed the triazole H-6 and the phenolic –OH protons. 1H NMR studies indicate that fluoride anion is in close contact to the probe at the triazole's H-6 proton.
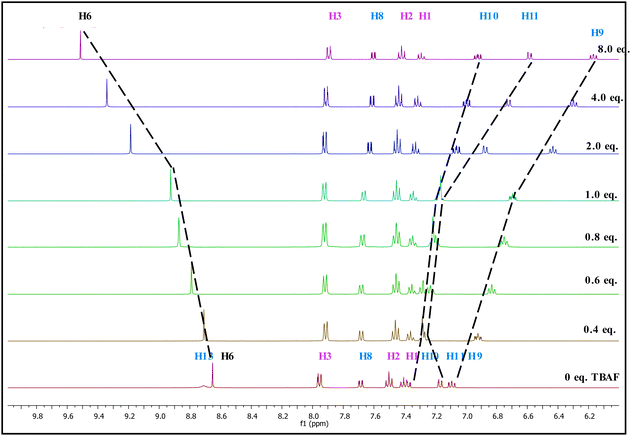 | ||
| Fig. 2 Changes in partial 1H NMR (400 MHz) spectra of PTP (∼1.7 × 10⁻¹ mol dm−3) in CD3CN upon increasing equivalents of TBAF (0 to 8 eq.). | ||
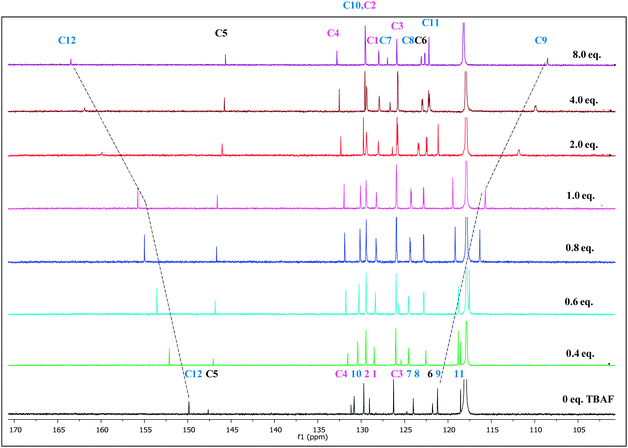 | ||
| Fig. 3 Changes in partial 13C NMR spectra of PTP (∼1.7 × 10⁻¹ mol dm−3) in CD3CN upon increasing equivalents of TBAF (0 to 8 eq.). | ||
NOE experiments of PTP with the addition of TBAF shows that the correlation between H-6 and H-8 disappears while the correlation between H-6 and H-3 remains unchanged. This indicates the phenolic ring has rotated 180° to facilitate binding with the fluoride ion (see ESI,† Fig. S8), as shown in Scheme 2.
The 13C NMR titrations (Fig. 3) of PTP with TBAF are in full agreement with the results from the 1H NMR titrations. The addition of fluoride ion from 0 to 8 eq. induces a downfield shift of >12 ppm for C-12. C-9 shows an upfield shift of similar magnitude, mirroring this position's upfield shift in the 1H NMR spectra. The other chemical shift changes are either quite modest or virtually non-existent as seen for C-1, 2, 3 and 11 for example.
Addition of higher concentration of TBAF (0 to 5 eq.) does not show HF2− peaks in the expected range of 15 to 17 ppm44 due to deprotonation of the –OH proton (see ESI,† Fig. S9). However, this does not rule out the possibility of deprotonation or reversible protonation and hence we conducted additional absorption studies.
Absorption and fluorescence studies
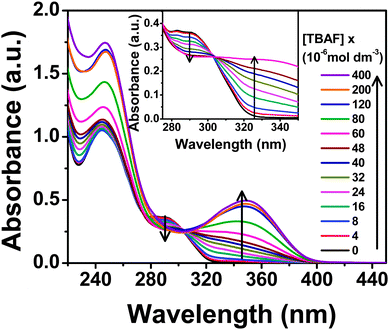
The lowest energy absorption band (S0–S1 transition) of PTP spans 275–310 nm peaking at around 290 nm in acetonitrile, which corresponds to the π–π* transition of the substituted phenyl ring.45,46 The anion binding properties of the probe have been investigated using absorption and fluorescence experiments with tetrabutylammonium salts of various anions, F−, Cl−, Br−, I−, H2PO4−, ClO4−, OAc−, BF4−. Overall, PTP shows selective spectroscopic responses for F−, H2PO4− and OAc− ions, with F− showing the maximum shifts in absorbance and fluorescence.The characteristic absorption spectrum modulated significantly in the presence of F− ions. Subsequent addition of TBAF to the probe induces a decrease in the absorbance of the low energy absorption band at 290 nm with the concomitant development of a new charge transfer band around 345 nm (Fig. 4). Appearance of an isosbestic point at 303 nm up to addition of 6 × 10⁻⁵ mol dm−3 TBAF (∼1![[thin space (1/6-em)]](https://www.rsc.org/images/entities/char_2009.gif) :
:![[thin space (1/6-em)]](https://www.rsc.org/images/entities/char_2009.gif) 1 concentration of PTP
1 concentration of PTP![[thin space (1/6-em)]](https://www.rsc.org/images/entities/char_2009.gif) :
:![[thin space (1/6-em)]](https://www.rsc.org/images/entities/char_2009.gif) TBAF) indicates the presence of more than one species in the medium. Further addition of TBAF shifts the isosbestic point. Addition of H2PO4− and OAc− ions as the same concentration of F− to the probe leads to an almost imperceptible increase in the absorbance at 345 nm. Addition of the rest of the anions (Cl−, Br−, I−, ClO4− and BF4−) did not alter the absorption spectrum of PTP at all, thereby indicating a selective and strong response towards F− ion (Fig. 5).
TBAF) indicates the presence of more than one species in the medium. Further addition of TBAF shifts the isosbestic point. Addition of H2PO4− and OAc− ions as the same concentration of F− to the probe leads to an almost imperceptible increase in the absorbance at 345 nm. Addition of the rest of the anions (Cl−, Br−, I−, ClO4− and BF4−) did not alter the absorption spectrum of PTP at all, thereby indicating a selective and strong response towards F− ion (Fig. 5).
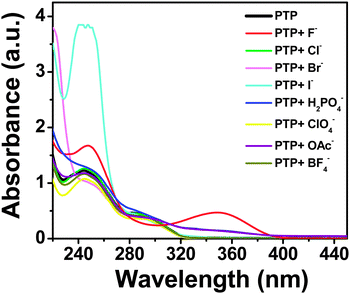 | ||
| Fig. 5 Absorption spectra of PTP (∼5 × 10⁻⁵ mol dm−3) upon the addition of 2 × 10⁻⁴ mol dm−3 of various anions. | ||
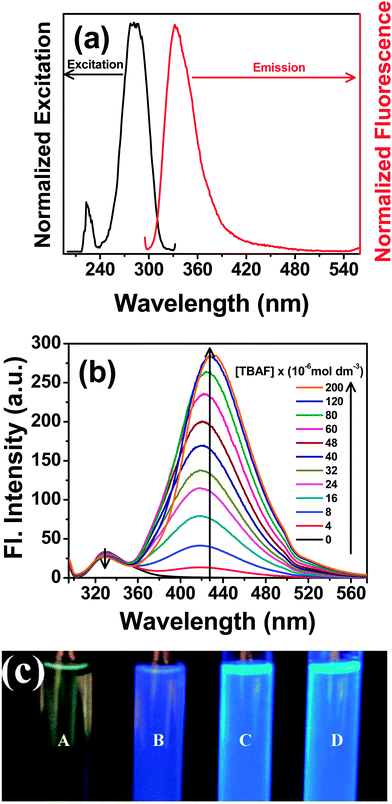
Photoexcitation of the probe at the low energy absorption band (290 nm) yields a broad fluorescence spectrum having emission maximum at ∼330 nm in acetonitrile (Fig. 6a). Upon progressive addition of F− ions, the fluorescence intensity of the 330 nm band of the probe gradually decreases and a new band develops at ∼430 nm that increases in its intensity (Fig. 6b). The enhancement in the fluorescence intensity of the newly developed band at 430 nm is more pronounced than the decrease in the intensity of the band at 330 nm. This reveals that the newly formed species, upon F− addition, has greater fluorescence quantum yield than the original probe. The fluorescence quantum yield of PTP has been determined in acetonitrile before and after the addition of TBAF relative to the quantum yield of quinine sulphate in water (Φf = 0.546). The overall quantum yield of PTP is 0.0017 and 0.0222 before and after addition of F− respectively. The increase in quantum yield substantiates the enhancement of the fluorescence yield of PTP after addition of F−.
Correlating the changes in the emission spectrum, Fig. 6c depicts the enhancement in the fluorescence intensity of PTP, under UV lamp of wavelength 365 nm, on addition of TBAF from 0 to 4 equivalents. Hence, presence of F− “turn-on” the fluorescence of the probe even in the sub-micromolar concentration of the analyte which is lower than the level of fluoride present in the environment. On monitoring the emission spectrum at 450 nm, the excitation spectrum of PTP reveals a different spectral pattern from the original probe indicating the formation of a new structure upon fluoride addition (see ESI,† Fig. S10). Appearance of an isoemissive point at 350 nm for addition upto 6 × 10⁻⁵ mol dm−3 TBAF (∼1![[thin space (1/6-em)]](https://www.rsc.org/images/entities/char_2009.gif) :
:![[thin space (1/6-em)]](https://www.rsc.org/images/entities/char_2009.gif) 1 concentration of PTP
1 concentration of PTP![[thin space (1/6-em)]](https://www.rsc.org/images/entities/char_2009.gif) :
:![[thin space (1/6-em)]](https://www.rsc.org/images/entities/char_2009.gif) TBAF) further suggests presence of two species in the medium.
TBAF) further suggests presence of two species in the medium.
The amplitude of the optical variations and the existence of the isoemissive point are ascribed to the ability of the probe to interact specifically through an equilibrium process with the F− anion. The interaction of H2PO4− and OAc− with the probe is similar to that of F− (see ESI,† Fig. S11), however, higher concentrations of these anions are required to reach the saturation level. Addition of the rest of the anions (Cl−, Br−, I−, ClO4− and BF4−) did not alter any fluorescence changes in PTP (Fig. 7 and see ESI,† Fig. S12). The observed spectroscopic changes of PTP upon addition of F− is attributed to hydrogen bonding which is consistent with the previous studies of hydrogen bonding interaction of probe and analyte.3,5,26,46
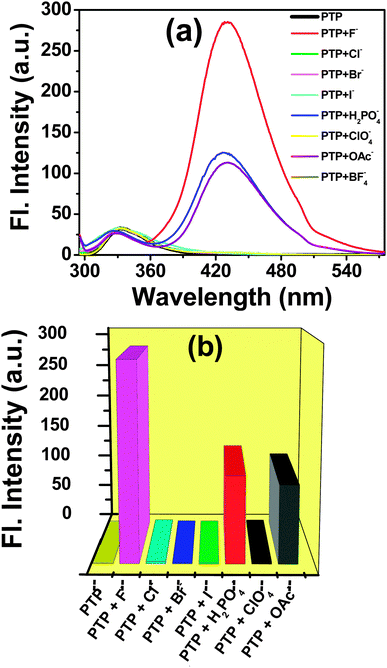 | ||
| Fig. 7 (a) Fluorescence spectra and (b) bars representing the fluorescence response of PTP (∼5 × 10⁻⁵ mol dm−3) upon the addition of 2 × 10⁻⁴ mol dm−3 of various anions λexc = 290 nm. | ||
In order to investigate the mechanism of the interaction of the probe with the anions two separate experiments were performed. In the first experiment, addition of a polar protic solvent (methanol) to PTP + TBAF recovers the absorption spectrum of PTP only (see ESI,† Fig. S13), suggesting the reversibility of the deprotonation pathway.51 In the other experiment, tetraethylammonium hydroxide (TEAOH) was gradually added to PTP in acetonitrile (see ESI,† Fig. S14). Steady state absorption titration experiments revealed analogous changes in the spectrum as of TBAF showing the development of a new band at ∼345 nm at the cost of the low energy absorption band at 290 nm in acetonitrile. This indicates that the binding interaction occurs via the deprotonation pathway.52
In order to look at the stoichiometry of the probe with the F− ions, Job's plot47 (Fig. 8) has been graphed between the difference in the fluorescence intensity (ΔF = Fx − F0) at 430 nm against the mole fraction of the probe [PTP]/([PTP + TBAF]). The curve, fitted using the non-linear curve fit parameters of the ORIGIN 8.0 software, showed maximum emission intensity at 0.5 mole fraction. Therefore, stoichiometry of F− ions to PTP is 1![[thin space (1/6-em)]](https://www.rsc.org/images/entities/char_2009.gif) :
:![[thin space (1/6-em)]](https://www.rsc.org/images/entities/char_2009.gif) 1. This corroborates the Job's plot from the 1H NMR titration study48 of PTP in presence of TBAF (see ESI,† Fig. S16).
1. This corroborates the Job's plot from the 1H NMR titration study48 of PTP in presence of TBAF (see ESI,† Fig. S16).
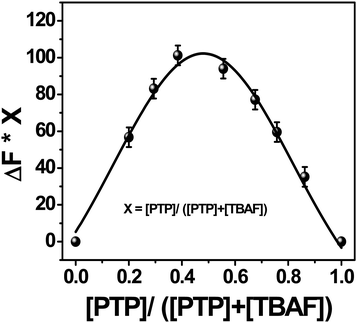 | ||
| Fig. 8 Job's plot of PTP with TBAF in acetonitrile. The fluorescence intensity is monitored at 430 nm. | ||
To gain further insight into the binding interaction of the probe with the F− ion compared to H2PO4− and OAc−, the binding constant value, K, was determined from the fluorescence intensity data following the modified Benesi–Hildebrand equation (eqn (1)).49 The interactions of the probe with F−, H2PO4− and OAc− were tabulated from the plots of 1/ΔF against 1/[L] (Table 1).
| 1/ΔF = 1/ΔFmax + 1/K·1/ΔFmax·1/[L] | (1) |
![[thin space (1/6-em)]](https://www.rsc.org/images/entities/char_2009.gif) :
:![[thin space (1/6-em)]](https://www.rsc.org/images/entities/char_2009.gif) 1 interaction between the probe and the anions. The binding constant values have been determined from the slope of the individual plots. The higher binding constant evaluated for the F− ion demonstrates the higher selectivity and sensitivity of PTP towards fluoride (see ESI,† Fig. S15).
1 interaction between the probe and the anions. The binding constant values have been determined from the slope of the individual plots. The higher binding constant evaluated for the F− ion demonstrates the higher selectivity and sensitivity of PTP towards fluoride (see ESI,† Fig. S15).
| Environment | Binding constant, K (mol−1 dm3) |
|---|---|
| PTP + F− | (9.0 ± 0.4) × 103 |
| PTP + H2PO4− | (6.0 ± 0.2) × 103 |
| PTP + OAc− | (4.9 ± 0.2) × 103 |
Experimental
Materials and methods
All chemicals and reactants were obtained from commercial sources and used without further purification. Column chromatography was performed with Selecto Scientific Silica gel (particle size 100–200 microns). NMR spectra were recorded on a Agilent MR400DD2 spectrometer, with a multinuclear probe with two RF channels and variable temperature capability. 1H NMR: 400 MHz and 13C NMR: 100 MHz; the solvent used was CD3CN purchased from Sigma-Aldrich. The NMR signals are reported in parts per million (ppm) relative to the residual in the solvent. Signals are described with multiplicity, singlet (s), doublet (d), triplet (t), triplet of doublet (td), quartet (q) and multiplet (m); coupling constants (J; Hz) and integration. Melting points were measured with Vernier Melt Station using Vernier LabQuest 2 and are uncorrected. The Electrospray Ionization Mass Spectrometry (ESI-MS) was conducted using Shimadzu LCMS-2020 Single Quad respectively. High Resolution MS (HRMS) analyses were performed using MALDI, Q-TOF micro, 3200API, LCMS, GCMS EI(DI). All the experiments were performed at ambient temperature (27 °C) with air-equilibrated solutions.Room temperature absorption and steady state fluorescence measurements were performed using a Shimadzu UV-2450 spectrophotometer and PerkinElmer LS55 with well plate reader fluorimeter respectively. Concentration of PTP was kept at ∼5.0 × 10⁻⁵ mol dm−3 in acetonitrile to avoid any possible intermolecular effect. The solvents used were of HPLC grade and Millipore water was used for the experiment.
Synthetic procedure
![[thin space (1/6-em)]](https://www.rsc.org/images/entities/char_2009.gif) :
:![[thin space (1/6-em)]](https://www.rsc.org/images/entities/char_2009.gif) 1, v/v) in a round bottom flask. An aqueous solution of copper(II) sulfate pentahydrate (8.10 mg, 0.03 mmol in 4 mL of water) was added dropwise, followed by sodium ascorbate (64.0 mg, 0.32 mmol). The reaction was vigorously stirred while refluxing for 24 hours. Upon cooling to room temperature, the resulting mixture was placed in an ice bath and diluted with water (30 mL) to induce precipitation. The crude, solid product was collected with vacuum filtration and purified by flash column chromatography (40% ethyl acetate in hexanes, followed by 50% ethyl acetate in hexanes) to off white/beige powder 0.71 g (80%). Crystals of PTP were isolated by slow evaporation of methanol which resulted in colourless crystals. The electrospray ionization mass spectrometry (ESI-MS) confirms the molecular weight (m/z) of PTP (see ESI,† Fig. S17).
1, v/v) in a round bottom flask. An aqueous solution of copper(II) sulfate pentahydrate (8.10 mg, 0.03 mmol in 4 mL of water) was added dropwise, followed by sodium ascorbate (64.0 mg, 0.32 mmol). The reaction was vigorously stirred while refluxing for 24 hours. Upon cooling to room temperature, the resulting mixture was placed in an ice bath and diluted with water (30 mL) to induce precipitation. The crude, solid product was collected with vacuum filtration and purified by flash column chromatography (40% ethyl acetate in hexanes, followed by 50% ethyl acetate in hexanes) to off white/beige powder 0.71 g (80%). Crystals of PTP were isolated by slow evaporation of methanol which resulted in colourless crystals. The electrospray ionization mass spectrometry (ESI-MS) confirms the molecular weight (m/z) of PTP (see ESI,† Fig. S17).
Conclusion
Using “Click chemistry” we have successfully synthesized a simple, novel and efficient 1,2,3-triazole based fluorescent sensor which “turn-on” in the presence of fluoride ion. The crystal data and the NMR studies confirm the binding interaction with the phenolic group of the probe and the fluoride anion. This hypothesis is proved by the deshielding effect shown on the triazole signal and the shielding effect on the phenolic signals during the interaction. UV-absorption and fluorescence spectroscopic studies have revealed the development of new species and formation of isosbestic and isoemissive points in the absorption and emission spectra respectively. The study substantiates the existence of equilibrium between the two species formed after the addition of F− to PTP. The probe also interacts with the dihydrogen phosphate and acetate anions however, with weaker responses. Our current work is focused towards the manipulation of the triazole systems, which can be utilized in selectively recognizing both cations and anions (dual sensor), in the development of molecular switch and in logic-gate applications.Acknowledgements
The authors acknowledge the Department of Chemistry, Georgia Southern University (GSU), Honors Research Fund and the College Office of Undergraduate Research (COUR) for the financial assistance. DG and WM gratefully acknowledge the financial support from Office of Naval Research (Award number: N000141210589).Notes and references
- Fluorescent Chemosensors for Ion and Molecule Recognition, ed. A. W. Czarnik, ACS, Washington, 1992 RSC; E. Kimura and T. Koike, Chem. Soc. Rev., 1998, 27, 179 RSC; U. E. Spichiger-Keller, Chemical Sensors and Biosensors for Medical and Biological Applications, Wiley-VCH, Weinheim, 1998 CrossRef CAS; T. D. H. Lee, K. H. Lee and J.-I. Hong, Org. Lett., 2001, 3, 5 CrossRef CAS; N. Chattopadhyay, A. Mallick and S. Sengupta, J. Photochem. Photobiol., A, 2006, 177, 55 CrossRef PubMed; K. Niikura, A. Metzger and E. V. Anslyn, J. Am. Chem. Soc., 1998, 120, 8533 CrossRef; S. Banthia and A. Samanta, J. Phys. Chem. B, 2006, 110, 6437 CrossRef PubMed; X. Zhang, L. Guo, F.-Y. Wu and Y.-B. Jiang, Org. Lett., 2003, 5, 2667 CrossRef PubMed; M. T. Fernandez-Arguelles, J. M. Costa-Fernandez, R. Pereiro and A. Sanz-Medel, Anal. Chim. Acta, 2003, 491, 27 CrossRef; R. Badugu, J. R. Lakowicz and C. D. Geddes, J. Am. Chem. Soc., 2005, 127, 3635 CrossRef PubMed; M. S. Han and D. H. Kim, Angew. Chem., Int. Ed., 2002, 41, 3809 CrossRef.
- A. P. De Silva, H. Q. N. Gunaratne, T. Gunnlaugsson, A. J. M. Huxley, C. P. McCoy, J. T. Rademacher and T. E. Rice, Chem. Rev., 1997, 97, 1515 CrossRef CAS PubMed; S. M. Landge and I. Aprahamian, J. Am. Chem. Soc., 2009, 131, 18269 CrossRef PubMed.
- F.-Y. Wu, Z. Li, Z.-C. Wen, N. Zhou, Y.-F. Zhao and Y.-B. Jiang, Org. Lett., 2002, 4, 3203 CrossRef CAS PubMed; D. Ghosh, D. Sarkar and N. Chattopadhyay, J. Mol. Liq., 2010, 156, 131 CrossRef PubMed.
- F.-Y. Wu and Y.-B. Jiang, Chem. Phys. Lett., 2002, 355, 438 CrossRef CAS; S. M. Landge, K. Tkatchouk, D. Benitez, D. A. Lanfranchi, M. Elhabiri, W. A. Goddard III and I. Aprahamian, J. Am. Chem. Soc., 2011, 133, 9812 CrossRef PubMed.
- X. He, S. Hu, K. Liu, Y. Guo, J. Xu and S. Shao, Org. Lett., 2006, 8, 333 CrossRef CAS PubMed.
- T. Gunnlaugsson, A. P. Davis, J. E. O'Brien and M. Glynn, Org. Lett., 2002, 4, 2449 CrossRef CAS PubMed; S. K. Kim and J. Yoon, Chem. Commun., 2002, 770 RSC.
- R. Badugu, J. R. Lakowicz and C. D. Geddes, Anal. Biochem., 2004, 327, 82 CrossRef CAS PubMed.
- P. D. Beer, Acc. Chem. Res., 1998, 31, 71 CrossRef CAS.
- S. Nishizawa, H. Kaneda, T. Uchida and N. Teramae, J. Chem. Soc., Perkin Trans. 2, 1998, 2325 RSC; S. Nishizawa, Y. Kato and N. Teramae, J. Am. Chem. Soc., 1999, 121, 9463 CrossRef CAS; D. Ghosh, N. Nandi and N. Chattopadhyay, J. Phys. Chem. B, 2012, 116, 4693 CrossRef PubMed; D. Ghosh and N. Chattopadhyay, J. Lumin., 2011, 131, 2207 CrossRef PubMed.
- L. G. Arnaut and S. J. Formosinho, J. Photochem. Photobiol., A, 1993, 75, 1 CrossRef CAS; S. J. Formosinho and L. G. Arnaut, J. Photochem. Photobiol., A, 1993, 75, 21 CrossRef; L. M. Tolbert and K. M. Solntsev, Acc. Chem. Res., 2002, 35, 19 CrossRef PubMed; J. T. Hynes, T.-H. Tran-Thi and G. Granucci, J. Photochem. Photobiol., A, 2002, 154, 3 CrossRef; A. Jarczewskia and C. D. Hubbard, J. Mol. Struct., 2003, 649, 287 CrossRef; D. Ghosh, D. Bose, D. Sarkar and N. Chattopadhyay, J. Phys. Chem. A, 2009, 113, 10460 CrossRef PubMed.
- Y. Li and A. H. Flood, Angew. Chem., Int. Ed., 2008, 47, 2649 CrossRef CAS PubMed; Y. Li and A. H. Flood, J. Am. Chem. Soc., 2008, 130, 12111 CrossRef PubMed; H. Juwarker, J. M. Lenhardt, D. M. Pham and S. L. Craig, Angew. Chem., Int. Ed., 2008, 47, 3740 CrossRef PubMed; R. M. Meudtner and S. Hecht, Angew. Chem., Int. Ed., 2008, 47, 4926 CrossRef PubMed; Y. Hua and A. H. Flood, Chem. Soc. Rev., 2010, 39, 1262 RSC.
- Y.-J. Li, L. Xu, W.-L. Yang, H.-B. Liu, S.-W. Lai, C.-M. Che and Y.-L. Li, Chem. – Eur. J., 2012, 18, 4782 CrossRef CAS PubMed; B. Sui, B. Kim, Y. Zhang, A. Frazer and K. D. Belfield, ACS Appl. Mater. Interfaces, 2013, 5, 2920 Search PubMed.
- K. Niikura, A. Metzger and E. V. Anslyn, J. Am. Chem. Soc., 1998, 120, 8533 CrossRef CAS.
- Y. Qu, J. Hua and H. Tian, Org. Lett., 2010, 12, 3320 CrossRef CAS PubMed.
- L. Basabe-Desmonts, D. N. Reinhoudt and M. Crego-Calama, Chem. Soc. Rev., 2007, 36, 993 RSC.
- M. S. Han and D. H. Kim, Angew. Chem., Int. Ed., 2002, 41, 3809 CrossRef CAS.
- F. P. Schmidtchen and M. Berger, Chem. Rev., 1997, 97, 1609 CrossRef CAS PubMed; P. A. Gale, Coord. Chem. Rev., 2000, 199, 181 CrossRef; D. Sarkar, A. Mallick, B. Haldar and N. Chattopadhyay, Chem. Phys. Lett., 2010, 484, 168 CrossRef PubMed.
- C. M. Carey, J. Evid Based Dent. Pract., 2014, 14S, 95 CrossRef PubMed.
- M. Kleerekoper, Endocrinol. Metab. Clin. North Am., 1998, 27, 441 CAS.
- E. Perumal, V. Paul, V. Govindarajan and L. Panneerselvam, Toxicol. Lett., 2013, 223, 236 CrossRef CAS PubMed; R. J. Carton, Fluoride, 2006, 39, 163 Search PubMed; M. A. Armienta and N. Segovia, Environ. Geochem. Health, 2008, 30, 345 CrossRef PubMed; A. Lutz, J. M. Thomas and S. Diarra, Procedia Earth Planet. Sci., 2013, 7, 541 CrossRef PubMed; A. Lutz, S. Diarra, W. B. Apambire, J. M. Thomas and J. Ayamsegna, J. Water Resour. Prot., 2013, 5, 13 CrossRef; H. G. Jarvis, P. Heslop, J. Kisima, W. K. Gray, G. Ndossi, A. Maguire and R. W. Walker, Trop. Med. Int. Health, 2013, 18, 222 CrossRef PubMed; Y. Zheng, Zhongguo Dizhi, 2010, 37, 723 Search PubMed; K. Nohno, S. Sakuma, H. Koga, M. Nishimuta, M. Yagi and H. Miyazaki, Caries Res., 2006, 40, 487 CrossRef PubMed.
- Y. Zhou, J. F. Zhang and J. Yoon, Chem. Rev., 2014, 114, 5511 CrossRef CAS PubMed; C. B. Black, B. Andrioletti, A. C. Try, C. Ruiperez and J. L. Sessler, J. Am. Chem. Soc., 1999, 121, 10438 CrossRef.
- N. Peter, A. Nadezhdinskii and V. Ryzhikov, Annu. Meet. Proc. Inst. Nucl. Mater. Manage., 2008, 49, 139/1 Search PubMed; E. H. Van Veen, M. T. C. De Loos-Vollebregt, A. P. Wassink and H. Kalter, Anal. Chem., 1992, 64, 1643 Search PubMed.
- R. Gotor, A. M. Costero, S. Gil, M. Parra, R. Martinez-Manez and F. Sancenon, Chem. – Eur. J., 2011, 17, 11994 CrossRef CAS PubMed; C. E. Byers, J. M. McGuire, S. W. Hulet, D. C. Burnett, B. I. Gaviola, E. M. Jakubowski and S. A. Thomson, J. Anal. Toxicol., 2008, 32, 57 CrossRef; Y. Xie and B. N. Popov, Anal. Chem., 2000, 72, 2075 CrossRef; Y. Xie and B. N. Popov, Anal. Chim. Acta, 2001, 448, 221 CrossRef; Z. Miao, R. Feng, G. Li, Y. Zhou and Z. Du, Junshi Yixue Kexueyuan Yuankan, 1998, 22, 203 Search PubMed.
- D. A. Jose, D. K. Kumar, B. Ganguly and A. Das, Org. Lett., 2004, 6, 3445 CrossRef CAS PubMed.
- S. Kondo, M. Nagamine, S. Karasawa, M. Ishihara, M. Unno and Y. Yano, Tetrahedron, 2011, 67, 943 CrossRef CAS PubMed.
- H. Lu, W. Xu, D. Zhang, C. Chen and D. Zhu, Org. Lett., 2005, 7, 4629 CrossRef CAS PubMed; S. V. Bhosale, S. V. Bhosale, M. B. Kalyankar and S. J. Langford, Org. Lett., 2009, 11, 5418 CrossRef PubMed.
- C. Caltagirone, A. Mulas, F. Isaia, V. Lippolis, P. A. Gale and M. E. Light, Chem. Commun., 2009, 6279 RSC.
- V. Bhalla, R. Tejpal and M. Kumar, Tetrahedron, 2011, 67, 1266 CrossRef CAS PubMed; C.-H. Chen and M.-K. Leung, Tetrahedron, 2011, 67, 3924 CrossRef PubMed.
- A. Bamesberger, C. Schwartz, Q. Song, W. Han, Z. Wang and H. Cao, New J. Chem., 2014, 38, 884 RSC; Y. Mi, Z. Cao, Y. Chen, S. Long, Q. Xie, D. Liang, W. Zhu and J. Xiang, Sens. Actuators, B, 2014, 192, 164 CrossRef CAS PubMed; S. H. Kim, Y. A. Son, J. S. Bae and D. H. Lee, Method for manufacturing stimuli-responsive charge transfer pigment, Repub. Korea, 2012, KR 1171652 B1 20120809 Search PubMed.
- Y. Qu, Y. Wu, Y. Gao, S. Qu, L. Yang and J. Hua, Sen. Actuators, B, 2014, 197, 13 CrossRef CAS PubMed; P. Alaei, S. Rouhani, K. Gharanjig and J. Ghasemi, Spectrochim. Acta, Part A, 2012, 90, 85 CrossRef PubMed; C. Yang, J. Xu, J. Ma, D. Zhu, Y. Zhang, L. Liang and M. Lu, Polym. Chem., 2012, 3, 2640 RSC; M. H. Park, T. Kim, J. O. Huh, Y. Do and M. H. Lee, Polymer, 2011, 52, 1510 CrossRef PubMed; J. Hu, C. Li, Y. Cui and S. Liu, Macromol. Rapid Commun., 2011, 32, 610 CrossRef PubMed.
- H. Çiftçi, Y. Oztekin, U. Tamer, A. Ramanavicine and A. Ramanavicius, Talanta, 2014, 126, 202 CrossRef PubMed.
- A. B. Descalzo, D. Jiménez, J. E. Haskouri, D. Beltrán, P. Amorós, M. D. Marcos, R. Martínez-Máñez and J. Soto, Chem. Commun., 2002, 562 RSC; E. Kim, H. J. Kim, D. R. Bae, S. J. Lee, E. J. Cho, M. R. Seo, J. S. Kim and J. H. Jung, New J. Chem., 2008, 32, 1003 RSC; Q. Wang, C. Tan, H. Chen and H. Tamiaki, J. Phys. Chem. C, 2010, 114, 13879 Search PubMed.
- R. Velu, V. T. Ramakrishnan and P. Ramamurthy, J. Photochem. Photobiol., A, 2011, 217, 313 CrossRef CAS PubMed.
- A. M. Alkilany, S. E. Lohse and C. J. Murphy, Acc. Chem. Res., 2013, 46, 650 CrossRef CAS PubMed; R. C. Mulrooney, N. Singh, N. Kaur and J. F. Callan, Chem. Commun., 2009, 686 RSC; J. Liu, X. Yang, K. Wang, R. Yang, H. Ji, L. Yang and C. Wu, Chem. Commun., 2011, 47, 935 RSC.
- V. V. Rostovtsev, L. G. Green, V. V. Fokin and K. B. Sharpless, Angew. Chem., Int. Ed., 2002, 41, 2596 CrossRef CAS; B. Schulze and U. S. Schubert, Chem. Soc. Rev., 2014, 43, 2522 RSC.
- Y. Hua and A. H. Flood, Chem. Soc. Rev., 2010, 39, 1262 RSC; H. Struthers, T. L. Mindt and R. Schibli, Dalton Trans., 2010, 675 RSC.
- Y. H. Lau, P. J. Rutledge, M. Watkinson and M. H. Todd, Chem. Soc. Rev., 2011, 40, 2848 RSC.
- Y. Li and A. H. Flood, Angew. Chem., Int. Ed., 2008, 47, 2649 CrossRef CAS PubMed; Y. Li and A. H. Flood, J. Am. Chem. Soc., 2008, 130, 12111 CrossRef PubMed; H. Juwarker, J. M. Lenhardt, D. M. Pham and S. L. Craig, Angew. Chem., Int. Ed., 2008, 47, 3740 CrossRef PubMed; R. M. Meudtner and S. Hecht, Angew. Chem., Int. Ed., 2008, 47, 4926 CrossRef PubMed.
- A. Kumar and P. S. Pandey, Org. Lett., 2008, 10, 165 CrossRef CAS PubMed; S. Lee, Y. Hua, H. Park and A. H. Flood, Org. Lett., 2010, 12, 2100 CrossRef PubMed; Y. Wang, F. Bie and H. Jiang, Org. Lett., 2010, 12, 3630 CrossRef PubMed.
- L.-L. Zhang, K. Yu, L.-L. Liu and D.-S. Guo, Acta Crystallogr., Sect. E: Struct. Rep. Online, 2012, 68, o1262 CAS.
- H. Khanmohammadi and K. Rezaeian, RSC Adv., 2014, 4, 1032 RSC.
- X. Peng, Y. Wu, J. Fan, M. Tian and K. Han, J. Org. Chem., 2005, 70, 10524 CrossRef CAS PubMed; M. Boiocchi, L. D. Boca, D. E. Gomez, L. Fabbrizzi, M. Licchelli and E. Monzani, J. Am. Chem. Soc., 2004, 126, 16507 CrossRef PubMed.
- H. Juwarker, J. M. Lenhardt, J. C. Castillo, E. Zhao, S. Krishnamurthy, R. M. Jamiolkowski, K.-H. Kim and S. L. Craig, J. Org. Chem., 2009, 74, 8924 CrossRef CAS PubMed.
- W. Huang, X. Yu, H. Lin and H. Lin, J. Inclusion Phenom. Macrocyclic Chem., 2011, 69, 69 CrossRef CAS; C. D. Jia, B. Wu, J. J. Liang, X. J. Huang and X. J. Yang, J. Fluoresc., 2010, 20, 291 CrossRef PubMed; V. Uahengo, B. Xiong, N. Zhou, P. Cai, K. Hu and G. Cheng, Chin. J. Chem., 2012, 30, 1702 CrossRef.
- A. K. Mahapatra, G. Hazra, S. K. Mukhopadhyay and A. R. Mukhopadhyay, Tetrahedron Lett., 2013, 54, 1164 CrossRef CAS PubMed.
- T.-P. Lin, C.-Y. Chen, Y.-S. Wen and S.-S. Sun, Inorg. Chem., 2007, 46, 9201 CrossRef CAS PubMed; H. Aboubakr, H. Brisset, O. Siri and J.-M. Raimundo, Anal. Chem., 2013, 85, 9968 CrossRef PubMed.
- P. Job, Spectrochemical Methods of Analysis, Wiley Intersience, New York, 1971, p. 346 Search PubMed.
- M. A. Saeed, F. R. Fronczek and M. A. Hossain, Chem. Commun., 2009, 6409 RSC; K. Choi and A. D. Hamilton, J. Am. Chem. Soc., 2001, 123, 2456 CrossRef CAS; M. A. Hossain, J. M. Llinares, M. S. Mason, P. Morehouse, D. Powell and K. Bowman-James, Angew. Chem., Int. Ed., 2002, 41, 2335 CrossRef.
- H. A. Benesi and J. H. Hildebrand, J. Am. Chem. Soc., 1949, 71, 2703 CrossRef CAS.
- T. Pirali, S. Gatti, R. Di Brisco, S. Tacchi, E. Zaninetti, E. Brunelli, A. Massarotti, G. Sorba, P. L. Canonico, L. Moro, A. A. Genazzani, G. C. Tron and R. A. Billington, ChemMedChem, 2007, 2, 437 CrossRef CAS PubMed.
- G. Zhang and Q. Li, Supramol. Chem., 2014, 26, 817 CrossRef CAS.
- S. Sharma, M. S. Hundal and G. Hundal, Tetrahedron Lett., 2013, 54, 2423 CrossRef CAS PubMed.
Footnote |
| † Electronic supplementary information (ESI) available. CCDC 1019571. For ESI and crystallographic data in CIF or other electronic format see DOI: 10.1039/c4nj01411a |
| This journal is © The Royal Society of Chemistry and the Centre National de la Recherche Scientifique 2015 |

