One-step synthesis of Ni-doped SnO2 nanospheres with enhanced lithium ion storage performance†
Xiaomin
Ye
,
Wenjing
Zhang
,
Qianjin
Liu
,
Shuping
Wang
,
Yanzhao
Yang
and
Huiying
Wei
*
Key Laboratory for Special Functional Aggregate Materials of Education Ministry, School of Chemistry and Chemical Engineering, Shandong University, Jinan 250100, P. R. China. E-mail: weihuiying@sdu.edu.cn; Fax: +86-531-88564464; Tel: +86-531-88365431
First published on 12th September 2014
Abstract
In our work, Ni-doped SnO2 nanospheres have been synthesized via a one-step hydrothermal method using glucose as the soft template. Their structure and physicochemical properties were investigated using X-ray diffraction (XRD), a transmission electron microscope (TEM), a field-emission scanning electron microscope (FE-SEM) equipped with energy-dispersive X-ray spectroscopy (EDS), high resolution transmission electron microscopy (HRTEM) and electrochemical methods. Compared with the pristine SnO2, appropriate Ni-doped SnO2 nanospheres showed much better rate capability and excellent cycling performance. In particular, the sample with 5 mol% Ni showed a high initial reversible capacity of 1267 mA h g−1 at a charge–discharge rate of 0.2 C, and a stable reversible capacity of 674.8 mA h g−1 after 35 cycles. Nickel doping could accommodate the huge volume expansion and avoid the agglomeration of nanoparticles. Thus, the electrochemistry performance was significantly improved.
Introduction
Lithium-ion batteries, with high reversible capacity, long cycle life, and low cost, have attracted considerable attention in science and industry fields.1–3 Graphite, as the most popular anode material in commercial LIBs anodes, shows excellent cyclability, but low capacity (372 mA h g−1) limits its industrial applications.4 In particular, some promising negative materials such as silicon (Si), tin (Sn), SnO2, Fe2O3, Co3O4, and MnO2 have attracted much interest, because of their higher theoretical capacities and higher energy densities than those of conventional graphite anodes.5 Among them, tin dioxide (SnO2), with a high theoretical capacity (782 mA h g−1), has attracted considerable attention from chemical engineers.6 Due to the maximum intake of 4.4 Li per Sn atom to form Li4.4Sn during alloying, SnO2 is considered as one of the most suitable materials to replace the carbon anode in the lithium-ion battery. Unfortunately, the practical application of SnO2-based anodes has been hampered by their poor cycling stability. SnO2 suffers from drastic volume expansion–contraction (∼300%) during the Li-ion insertion–extraction reaction, which eventually leads to mechanical failure and a loss of electrical activity of the electrode.7To improve the electrochemical performance, significant research efforts have focused on producing a buffer layer or void space for SnO2.7 These methods include reducing the particle size to nanoscopic dimensions by synthesizing various morphologies of SnO2, such as zero-dimensional (0D) nanoparticles;8 one-dimensional (1D) nanorods, nanobelts,9 nanowires and nanotubes;10 two-dimensional (2D) nanosheets;11 and three-dimensional (3D) hierarchical architectures.12 For example, Lou et al. reported a one-pot synthesis of SnO2 hollow nanospheres, which had a high capacity Li-ion storage (about 500 mA h g−1 after 40 cycles at 0.2 C).13 Moreover, carbon supported SnO2 nanocomposites offer an effective way to tailor their electrical and microstructural properties.14 Lou et al. prepared SnO2–carbon composite hollow spheres by ternary self-assembly approaches, which displayed a stable reversible capacity of about 473 mA h g−1 after 50 cycles.15 The carbon networks acted as a physical buffer for the huge volume change, as well as the electrical conducting path. There have also been efforts to mix SnO2 with other metal oxides, such as ZnO–SnO2, CuO–SnO2, InO2–SnO2, SiO2–SnO2, and NiO–SnO2.16–19 Some common properties appear in these hybrid systems, such as the capability to absorb the volume change and the ability to react reversibly with a number of lithium ions.20,21 Due to those properties, the electrochemical performance is greatly improved.
Nowadays, SnO2 are also intentionally ‘doped’ by incorporating atoms or ions of suitable elements into host lattices to enhance the cycling stability.22,23 For example, Wang et al. synthesized antimony-doped SnO2 with excellent cycling performance.24 A specific discharge capacity of 637 mA h g−1 was found after 100 cycles at 0.2 C, corresponding to 49.5% of the initial specific capacity.
However, studies on Ni-doped SnO2 as anode materials for lithium-ion batteries have been seldom reported. Herein, we report a simple hydrothermal method for the synthesis of nickel-doped SnO2 nanospheres. Glucose played an important role in mediating the nanospheres. Nickel doping occurred by replacing tin in the crystal structure, and then the component Ni served as a buffer, so that the electrode avoided the usual drastic volume expansion and agglomeration of nanoparticles. Based on this, the electrochemical performance of the electrode was significantly improved. Our results indicate the potential application for Ni-doped SnO2 nanospheres as promising anode materials for future lithium-ion batteries.
Experimental
Preparation of samples
All of the reactants were of analytical grade and used without further purification. The content of Ni was controlled according to the relation: Ni/(Ni + Sn). In a typical synthesis, 0.6 g of tin dichloride dehydrate (SnCl2·2H2O), 2.51 g of sodium citrate (Na3C6H5O7·2H2O), and 5% molar ratio of nickel acetate (Ni(CH3COO)2·4H2O) were dispersed in distilled water (15 ml) under stirring. After stirring for several minutes, 0.55 g of glucose was added to the solution with continuous stirring to form a transparent solution. Then, the solution was transferred into a 25 ml Teflon-lined stainless steel autoclave and kept at 180 °C for 9 h. The as-prepared precipitate was separated by centrifugation and washed with distilled water and ethanol several times. Finally, the product was dried at 60 °C overnight. The dried products were annealed at 700 °C under air for 4 h to obtain the SnO2 nanospheres. For comparison, the control samples with 0 mol%, 2.5 mol% and 7.5% mol Ni were prepared under identical conditions.Characterization
XRD measurements were carried out with a Bruker D8 advance X-ray diffractometer with Cu-Kα radiation (λ = 0.15418 nm) in the 2θ range from 20° to 70°. The morphology of the as-prepared samples were characterized using a field-emission scanning electron microscope (FE-SEM, Hitachi, S4800) equipped with energy dispersive X-ray spectroscopy (EDS), a transmission electron microscope (TEM, JEM 100-CXII, 80 kV) and a high-resolution transmission electron microscope (HRTEM, JEM-2100, 200 kV).Electrochemical measurement
In order to measure the electrochemical performance of the electrodes, CR2032 coin-type cells were assembled in an argon-filled glove box. The anode electrode was prepared by dispersing 70 wt% active materials, 20 wt% of acetylene black and 10 wt% of carboxymethyl cellulose (CMC) binder in distilled water. Then, the mixed slurry was spread uniformly on a Cu foil current collector and dried at 90 °C overnight, before testing. The electrolyte was 1 M LiPF6 in a mixture of ethylene carbonate (EC)–diethyl carbonate (DEC) (1![[thin space (1/6-em)]](https://www.rsc.org/images/entities/char_2009.gif) :
:![[thin space (1/6-em)]](https://www.rsc.org/images/entities/char_2009.gif) 1 in volume), and the separator was a polypropylene micro-porous film (Celgard 2400). The charge–discharge tests were performed on a Land CT2001A system (Wuhan, China), at a rate of 0.2 C, and in the potential range of 0.005–2.0 V. Cycle voltammograms (CV) curves were recorded on a CHI-630B electrochemical workstation in the range of 0.0–2.50 V (vs. Li+/Li), at the scan rate of 0.2 mV s−1. The electrochemical impedance spectroscopy (EIS) was carried out by an electrochemical workstation (MATERIALS MATES 510, ITALIA), by applying ac voltage in the frequency range of 10 mHz–100 kHz.
1 in volume), and the separator was a polypropylene micro-porous film (Celgard 2400). The charge–discharge tests were performed on a Land CT2001A system (Wuhan, China), at a rate of 0.2 C, and in the potential range of 0.005–2.0 V. Cycle voltammograms (CV) curves were recorded on a CHI-630B electrochemical workstation in the range of 0.0–2.50 V (vs. Li+/Li), at the scan rate of 0.2 mV s−1. The electrochemical impedance spectroscopy (EIS) was carried out by an electrochemical workstation (MATERIALS MATES 510, ITALIA), by applying ac voltage in the frequency range of 10 mHz–100 kHz.
Results
Characterization of Ni-doped SnO2 nanospheres
Ni-doped SnO2 nanospheres were synthesized via a one-step hydrothermal method in our work. Their structure and physicochemical properties were investigated via a series of measurements. Fig. 1 shows the XRD patterns for the Ni-doped SnO2 samples and the individual SnO2. These indicate that all the peaks corresponded to a pure phase (cassiterite, JCPDS No. 41-1445) and no diffraction peaks of crystalline by-products, such as NiO, were detected.25 This indicates that the nickel doping was performed by substituting tin in the crystal structure. For the undoped SnO2, the peaks at 26.57°, 33.92°, 37.927°, 51.834°, 54.797°, 57.928° and 61.849° were attributed to the (110), (101), (200), (211), (220), (002) and (310) crystal planes, respectively.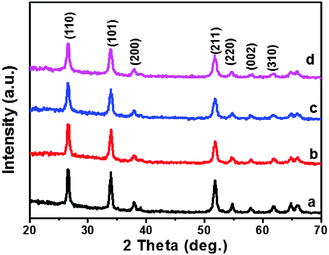 | ||
| Fig. 1 XRD patterns of (a) pristine SnO2, (b) 2.5 mol% Ni–SnO2, (c) 5 mol% Ni–SnO2, and (d) 7.5 mol% Ni–SnO2. | ||
All the samples were also characterized by the Raman spectra, with an exciting laser wavelength of 514 nm, as illustrated in Fig. 2. For the undoped-SnO2 sample, typical modes positioned at A1g = 634.7 cm−1 and B2g = 778.19 cm−1 were detected.26 Clearly, the strongest typical A1g mode showed a redshift and a decrease of peak intensity with the increase in the Ni2+ doping concentration. The main features of the other two bands, labelled as M1 and M2, were associated with surface modes.27 It also could be seen that the peak values dramatically decreased due to the Ni doping. The above phenomena are powerful evidence of the nickel incorporation into the SnO2 cassiterite lattice.27,28 Moreover, no Ni–O characteristic peak (about 570 cm−1) was detected in the spectrum of the doped samples. This is in agreement with the previous XRD results and further confirms the incorporation of bivalent Ni2+ to the SnO2 cassiterite lattice.
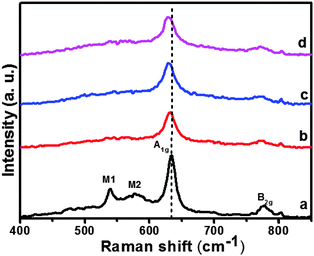 | ||
| Fig. 2 Raman spectra of (a) pristine SnO2, (b) 2.5 mol% Ni–SnO2, (c) 5 mol% Ni–SnO2, and (d) 7.5 mol% Ni–SnO2. | ||
The morphology of the pure SnO2 and Ni-doped SnO2 samples were examined by TEM and SEM images. Fig. 3 displays the TEM images of the individual SnO2 and Ni-doped SnO2. All of them showed nanospheres composed of numerous tiny nanoparticles. The TEM images also showed that the surface of the nanospheres had many pores, indicating good accessibility to the exterior.22 The diameter size of the nanospheres for 0 mol% Ni, 2.5 mol% Ni, 5 mol% Ni and 7.5 mol% Ni samples were around 160 nm, 140 nm, 120 nm, and 100 nm, respectively. The size of the nanospheres slightly reduced with the increasing content of Ni.
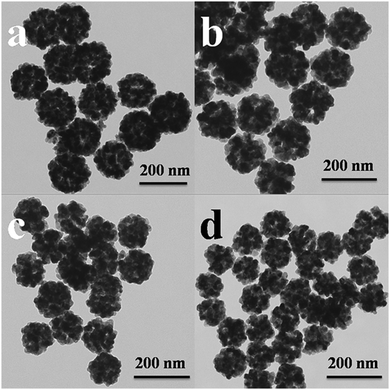 | ||
| Fig. 3 TEM images of (a) pristine SnO2, (b) 2.5 mol% Ni–SnO2, (c) 5 mol% Ni–SnO2, and (d) 7.5 mol% Ni–SnO2. | ||
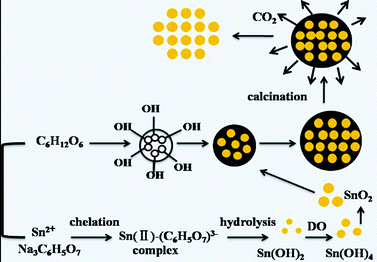
The schematic illustration in Scheme 1 is proposed to show the changes during the hydrothermal and calcination process. Herein, the introduction of sodium citrate and glucose were important for the preparation of SnO2 nanospheres. The chelation between the divalent tin ions and sodium citrate could efficiently restrain the rapid precipitation of Sn(OH)2via hydrothermal treatment, which was beneficial for the oxidation of bivalent tin to tetravalent tin with the oxygen dissolved in the solution.29 Moreover, glucose was found to play an important role in mediating the spherical structure. The hydrolysis of SnCl2 occurred in the microenvironment of glucose dehydration, and carbon nanospheres loaded with SnO2 nanoparticles were formed in the hydrothermal reaction.30 After calcination in air, the carbon in the nanospheres was removed, leaving behind the nanospheres structure.
For further investigation of the morphology of the nanospheres, the representative SEM image, accompanied with the EDS spectrum of the 5 mol% Ni sample, are depicted in Fig. 4a and b. The nanospheres showed uniform size and good dispersion (Fig. 4a). The EDS spectrum of the nanospheres confirmed the existence of Sn, O and Ni, from which the atom ratio of Ni/(Sn + Ni) was calculated to be 5.09 mol%. By combing the Raman spectrum analysis, Ni2+ was successfully incorporated into the SnO2 lattice. The crystal structures and edges of the 5 mol% Ni-doped SnO2 were determined with HRTEM (Fig. 4c and d). Clear lattice fringes were detected in the image. An interplanar spacing of about 0.325 nm corresponded to the (110) planes of SnO2, and another at about 0.26 nm was attributed to the (101) planes. Moreover, the selected-area electron diffraction (SAED) pattern (Fig. 4e) of the Ni-doped nanospheres showed the characteristic diffraction rings, which were assigned to the (110), (101), (200) and (211) crystal planes. These data are in agreement with the XRD results and indicated the polycrystalline nature of the powder.
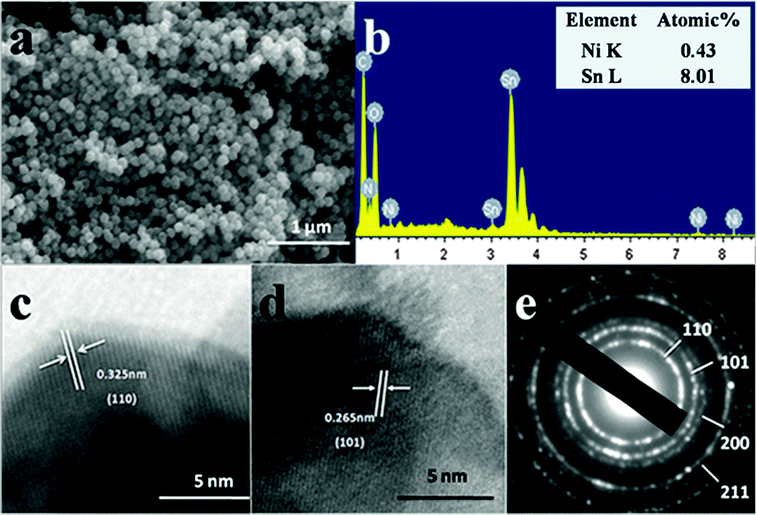 | ||
| Fig. 4 SEM image (a), EDS spectrum (b), HR-TEM images (c) and (d), the corresponding SAED pattern (e) of the as-prepared 5 mol% Ni-doped sample. | ||
Electrochemical performance of Ni-doped SnO2
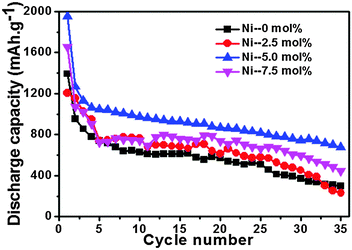
Fig. 5 exemplifies the discharge cycling performance of different electrodes at 0.2 C in a voltage window of 0.005–2.0 V for 35 cycles. The initial reversible capacity of 954.1 mA h g−1 and the specific discharge capacity of 296.9 mA h g−1 after 35 cycles for pristine SnO2 were measured. Because of the large volume change during the charge–discharge process, the capacity of SnO2 decayed rapidly.7 In this work, the cycling performance of the SnO2 was greatly enhanced with the appropriate content of nickel doping. For example, after 35 cycles, the reversible capacities for 2.5 mol%, 5 mol% and 7.5 mol% Ni-doped samples were 230.2 mA h g−1, 674.8 mA h g−1 and 447.8 mA h g−1, respectively. It was found that the appropriate molar rate of Ni led to a much improved electrochemical performance.The 5 mol% Ni-doped SnO2 electrode exhibited a much better rate capability than the individual SnO2 at various rates of 0.1 C, 0.2 C, 0.5 C and 1 C (Fig. 6). As shown in Fig. 6, at a rate of 1 C, the specific capacity of 5 mol% Ni-doped SnO2 was about 485.5 mA h g−1, and this was much higher than that of the pure SnO2 electrode (181.9 mA h g−1). When the rate returned to 0.1 C, the discharge capacity recovered to 628.9 mA h g−1. This excellent capacity retention was mainly attributed to the excellent structural stability. It is hypothesized that the nickel doping could decrease the lattice volume expansion effect in the alloying and dealloying process. When bivalent nickel substituted tetravalent tin in the crystal structure, Ni was thought to be a buffer for the lattice expansion, which could relieve the mechanical stress induced by the large volume change.19
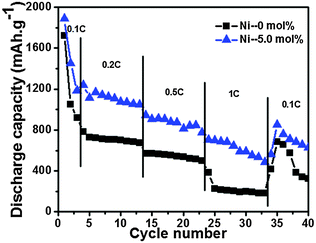 | ||
| Fig. 6 Rate performance of SnO2 and 5 mol% Ni-doped SnO2 samples in the voltage range of 0.005–2.0 V. | ||
To further understand the electrochemical process, the cycle voltammogram (CV) curves of different electrodes for the first two cycles were analyzed, as shown in Fig. 7. The CV curves (Fig. 7b) of 5 mol% Ni-doped SnO2 were in good agreement with the characteristics of pristine SnO2 (Fig. 7a). It was thus evident that the doping of Ni did not change the electrochemical reaction process. Fig. 7b clearly indicated a strong irreversible reduction peak around 0.7 V during the first cycle, which was due to the irreversible reduction of SnO2 to Sn (eqn (1)).22,24 In the subsequent cycles, this peak no longer appeared.
| Sn1−xNixO + 4Li+ + 4e− → Sn1−xNix + 2Li2O | (1) |
The irreversible capacity loss during the initial cycles was mostly due to the formation of Li2O or the solid electrolyte interface (SEI) layers.31 In the first cycle, the cathodic peak at about 0.06 V and the anodic peak at 0.59 V were detected, which corresponded to the reversible alloying and dealloying (Fig. 7b), as described in eqn (2).32
| Sn1−xNix + yLi+ + ye− ↔ LiySn1−xNix (0 ≤ y ≤ 4.4) | (2) |
An oxidation peak around 1.3 V and a reduction peak around 0.87 V were assigned to the partial reversibility of eqn (1).33 This implied that the overall Li storage capacity in the SnO2 anodes increased.34 Compared to pure SnO2 (Fig. 7a), the potential difference (ΔE) between the anodic and cathodic peaks of 5 mol% Ni-doped SnO2 (Fig. 7b) was reduced. The doping of Ni prevented SnO2 from cracking and led to the improvement of the redox behavior.
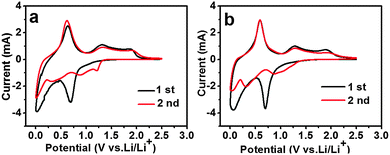 | ||
| Fig. 7 First second CV curves of SnO2 and Ni-doped SnO2 anodes: (a) pristine SnO2, and (b) 5 mol% Ni-doped SnO2. | ||
Fig. 8 displays the first three voltage profiles for SnO2 and the 5 mol% Ni-doped SnO2 electrodes at a constant current density of 0.2 C. The initial discharge and charge capacity of the Ni-doped anode were much larger than the tin oxide anode. The first discharge capacity for SnO2 and Ni-doped SnO2 were 1392 mA h g−1 and 1951 mA h g−1, showing a coulombic efficiency of 67.3% and 62.6%, respectively. During the second cycle, the discharge capacity of undoped and doped electrodes decreased to 954 mA h g−1 and 1267 mA h g−1, leading to a much higher coulombic efficiency of 85.2% and 88.9%, respectively. After the first cycle, the 5 mol% Ni-doped sample displayed a higher coulombic efficiency than that of individual SnO2. It was also evident that both of the electrodes exhibited a large capacity loss in the subsequent cycles, which was due to the formation of a solid electrolyte interface (SEI) layer and the irreversible reduction of SnO2 to Sn (eqn (1)).
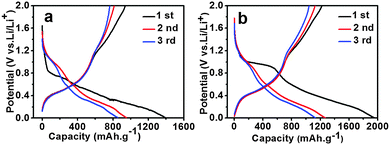 | ||
| Fig. 8 The initial three charge and discharge curves of (a) pure SnO2 electrode, and (b) the 5 mol% Ni-doped electrode. | ||
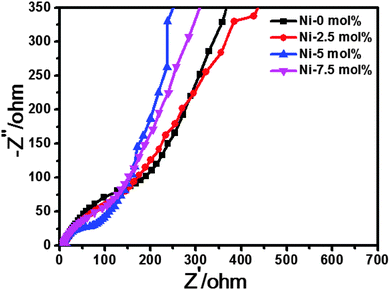
To better demonstrate the improved electrochemical performance of 5 mol% Ni-doped SnO2, Nyquist plots of the Ni-doped and pure SnO2 are shown in Fig. 9. Before the EIS measurement, the electrodes were cycled between 0 V and 2.0 V at a 0.1 C rate for 3 cycles and allowed to stand for 10 h at 2.0 V to ensure the formation of the stable SEI films on the surface of the electroactive particles. All the electrodes exhibited Nyquist plots composed of a small intercept at high frequency, a circular arc at high to medium frequency, and a straight line at low frequency. For the Li-ion battery, the intercept in the high-frequency region was attributed to ohmic resistance, which represented the total resistance of the electrolyte, separator, and electrical contacts; the circular arc in the medium-frequency region was assigned to the charge-transfer impedance on electrode; and the inclined line corresponded to the lithium-diffusion process within the electrodes.35,36 The ohmic resistance was similar for all the electrodes, because the electrodes were prepared by adding a conductive carbon black agent, which meant good conductivity in the electrode. From Fig. 9, it is clear that for different circular arcs, the order of the curvature from small to large arcs was 0 mol%, 2.5 mol%, 7.5 mol% and 5 mol%, respectively. The 5 mol% Ni-doped electrode provided the largest curvature compared to the others. This indicates that the charge transfer resistance at the electrode/electrolyte interface of the 5 mol% Ni-doped SnO2 was lowest, which consequently decreases the overall battery internal resistance. As a result, the 5 mol% Ni-doped electrode could accordingly have a higher reactivity and lower polarization. Based on the above analysis of the tests, nickel doping was proven to be beneficial for enhancing the electrochemistry performance.
Conclusions
In summary, using a quite facile hydrothermal route, we succeeded in the fabrication of Ni-doped SnO2 nanospheres with different molar ratios of Ni. In this process, the structures were mediated by glucose. Our work focused on determining the sample with the most suitable amount of nickel doping, which exhibited much better cyclic performance and rate capability than the pristine SnO2. In particular, the sample with 5 mol% Ni had the best electrochemical performance, and with a high initial reversible capacity of 1267 mA h g−1 at a charge–discharge rate of 0.2 C and a reversible capacity of 674.8 mA h g−1 after 35 cycles. The doping of nickel acted as a buffer, by reducing the volume expansion effect. In addition, the decreased possibility of tin aggregation during the alloying and dealloying process led to a lower charge transfer resistance, which then brought about a higher overall ionic conductivity. It is anticipated that nickel-doped SnO2 nanostructures could play an important role in the further improvement of lithium-ion battery anodes of SnO2-based materials.Acknowledgements
This study was supported by the Natural Science Foundation of China (Grant 21276142).Notes and references
- S. Ding, J. S. Chen and X. W. Lou, Adv. Funct. Mater., 2011, 21, 4120 CrossRef CAS.
- S. P. Wang, H. X. Yang, L. J. Feng, S. M. Sun, J. X. Guo, Y. Z. Yang and H. Y. Wei, J. Power Sources, 2013, 233, 43 CrossRef CAS PubMed.
- W. J. Zhang, Q. J. Liu, L. J. Feng, S. P. Wang, Y. Z. Yang and H. Y. Wei, New J. Chem., 2014, 38, 2265 RSC.
- S. Ding, D. Luan, F. Y. C. Boey, J. S. Chen and X. W. Lou, Chem. Commun., 2011, 47, 7155 RSC.
- C. M. Wang, W. Xu, J. Liu, J. G. Zhang, L. V. Saraf and B. W. Arey, Nano Lett., 2011, 11, 1874 CrossRef CAS PubMed.
- C. Wang, Y. Zhou, M. Ge, X. Xu, Z. Zhang and J. Jiang, J. Am. Chem. Soc., 2010, 132, 46 CrossRef CAS PubMed.
- P. G. Bruce, B. Scrosati and J. M. Tarascon, Angew. Chem., Int. Ed., 2008, 47, 2930 CrossRef CAS PubMed.
- D. F. Zhang, L. D. Sun, J. L. Yin and C. H. Yan, Adv. Mater., 2003, 15, 1022 CrossRef CAS.
- J. Z. Wang, N. Du, H. Zhang, J. X. Yu and D. Yang, J. Phys. Chem. C, 2011, 115, 11302 CAS.
- Y. Wang, H. C. Zeng and J. Y. Lee, Adv. Mater., 2006, 18, 645 CrossRef CAS.
- Y. M. Li, X. J. Lv, J. Lu and J. H. Li, J. Phys. Chem. C, 2010, 114, 21770 CAS.
- H. Wang, Y. M. Wu, Y. S. Bai, W. Zhou, Y. R. An, J. H. Li and L. Guo, J. Mater. Chem., 2011, 21, 10189 RSC.
- X. W. Lou, Y. Wang, C. Yuan, J. Y. Lee and L. A. Archer, Adv. Mater., 2006, 18, 2325 CrossRef CAS.
- X. W. Lou, J. S. Chen, P. Chen and L. A. Archer, Chem. Mater., 2009, 21, 2868 CrossRef CAS.
- X. W. Lou, D. Deng, J. Y. Lee and L. A. Archer, Chem. Mater., 2008, 5, 6562 CrossRef.
- P. Sun, L. You, Y. Sun, N. Chen, X. Li, H. Sun, J. Ma and G. Lu, CrystEngComm, 2012, 14, 1701 RSC.
- C. Li, W. Wei, S. Fang, H. Wang, Y. Zhang, Y. Gui and R. Chen, J. Power Sources, 2010, 195, 2939 CrossRef CAS PubMed.
- H. B. Wu, J. S. Chen, H. H. Hng and X. W. D. Lou, Nanoscale, 2012, 4, 2526 RSC.
- J. S. Chen and X. W. Lou, Small, 2013, 9, 1877 CrossRef CAS PubMed.
- P. Lavela and J. L. Tirado, J. Power Sources, 2007, 172, 379 CrossRef CAS PubMed.
- P. Lavela, J. L. Tirado and C. Vidal-Abarca, Electrochim. Acta, 2007, 52, 7986 CrossRef CAS PubMed.
- Y. D. Wang and T. Chen, Electrochim. Acta, 2009, 54, 3510 CrossRef CAS PubMed.
- H. El-Shinawi, M. Böhm, T. Leichtweiß, K. Peppler and J. Janek, Electrochem. Commun., 2013, 36, 33 CrossRef CAS PubMed.
- Y. D. Wang, I. Djerdj, B. Smarsly and M. Antonietti, Chem. Mater., 2009, 21, 3202 CrossRef CAS.
- M. F. Hassan, M. M. Rahman, Z. P. Guo, Z. X. Chen and H. K. Li, J. Mater. Chem., 2010, 20, 9707 RSC.
- J. Hays, A. Punnoose, R. Baldner, M. H. Engelhard, J. Peloquin and K. M. Reddy, Phys. Rev. B: Condens. Matter Mater. Phys., 2005, 72, 075203 CrossRef.
- F. H. Aragón, J. A. H. Coaquira, P. Hidalgo, S. W. da Silva, S. L. M. Brito, D. Gouvêa and P. C. Morais, J. Raman Spectrosc., 2011, 42, 1081 CrossRef.
- X. F. Liu, J. Iqbal, Z. B. Wu, B. He and R. H. Yu, J. Phys. Chem. C, 2010, 114, 4790 CAS.
- R. Yang, Y. G. Gu, Y. Q. Li, J. Zheng and X. G. Li, Acta Mater., 2010, 9, 864 Search PubMed.
- D. Deng and J. Y. Lee, Chem. Mater., 2008, 20, 1841 CrossRef CAS.
- D. Fattakhova, L. Kavan and P. Krtil, J. Solid State Electrochem., 2001, 5, 196 CrossRef CAS.
- I. A. Courtney, W. R. McKinnon and J. R. Dahna, J. Electrochem. Soc., 1999, 59, 146 Search PubMed.
- Y. Idota, T. Kubota, A. Matsufuji, Y. Maekawa and T. Miyasaka, Science, 1997, 276, 1395 CrossRef CAS.
- Y. S. Lin, J. G. Duh and M. H. Hung, J. Phys. Chem. C, 2010, 114, 13136 CAS.
- M. M. Liu, X. W. Li, H. Ming, J. Adkins, X. M. Zhao, L. Su, Q. Zhou and J. W. Zheng, New J. Chem., 2013, 37, 2096 RSC.
- Q. J. Liu, F. Yang, S. P. Wang, L. J. Feng, W. J. Zhang and H. Y. Wei, Electrochim. Acta, 2013, 111, 903 CrossRef CAS PubMed.
Footnote |
| † Electronic supplementary information (ESI) available. See DOI: 10.1039/c4nj00989d |
| This journal is © The Royal Society of Chemistry and the Centre National de la Recherche Scientifique 2015 |

