 Open Access Article
Creative Commons Attribution 3.0 Unported Licence
Electrochemical studies of decamethylferrocene in supercritical carbon dioxide mixtures
Jack A.
Branch
,
David A.
Cook
and
Philip N.
Bartlett
*
School of Chemistry, University of Southampton, Southampton, UK SO171BJ. E-mail: P.N.Bartlett@soton.ac.uk
First published on 12th November 2014
Abstract
Detailed analysis of the voltammetry of decamethylferrocene at micro and macrodisc electrodes has been carried out in scCO2/MeCN (15 wt%), 20 mM [NBun4][BF4] and 309 K and 17.5 MPa. A passivating film needs to be removed from platinum electrodes before stable, reproducible voltammetry can be obtained. At low concentrations (0.22 mM) reversible 1e− behaviour is observed. Significant effects from natural convection are also present and it is demonstrated that fitting a baffle to the electrode dampens this effect. Limiting currents at microdisc electrodes at concentrations ranging from 0.22 to 11 mM and radii of 10 to 25 μm all obey the microdisc equation. The diffusion coefficient is calculated to be 4.06 × 10⁻⁵ cm2 s−1 in scCO2/MeCN (15 wt%) with 20 mM [NBun4][BF4] and 309 K at 17.5 MPa. The solubility of decamethylferrocene is in excess of 11 mM for these conditions.
1. Introduction
Although there have been relatively few studies of electrochemistry in supercritical solvents1 recent studies show that these electrolytes may be of interest for applications ranging from voltammetric analysis,2–10 electrochemical reduction of CO2 to a variety of products,7,11,12 electrosynthesis13–15 and electrodeposition.16 Interest in the applications to electrodeposition arises because of the advantages of high mass transport and the absence of surface tension which allow for the electrodeposition into high-aspect ratio nanopores and nanostructures. Thus we have studied the electrodeposition of Cu,17 Ag18 and Ge19 from supercritical fluids. Given these potential practical applications it is of interest to better understand the physical chemistry and basic electrochemical processes in supercritical fluid electrolytes.Carbon dioxide is a widely used supercritical fluid (SCF)4,19–33 because it is non-toxic, inexpensive and non-flammable and because like all SCF its solvent properties can be tuned by variation of T and p. Supercritical carbon dioxide (scCO2), although having a low dielectric constant (ε < 2),4 is of interest as a supercritical solvent for electrochemistry because it is reasonably inert and because it has an easily accessible critical temperature and pressure (Tc = 304 K, pc = 7.3 MPa). One way to increase the dielectric constant and to make it more suitable for electrochemistry is to add a more polar co-solvent.
Previously we described the phase behaviour and conductivity of multi component mixtures using scCO2 (ref. 30) with both methanol and acetonitrile (MeCN) as co-solvents. Of the two, acetonitrile was found to be preferred since, for similar pressures and temperatures, the solubility of the tetraalkylammonium tetrafluoroborate supporting electrolyte was 5 times higher in acetonitrile mixtures compared to methanol.30
In a recent paper, Toghill et al.7 reported the results of a study of voltammetry at macroelectrodes in supercritical CO2 containing acetonitrile. In their experiments they used decamethylferrocene as the redox probe in a supercritical mixture of carbon dioxide with up to 0.41 mole fraction acetonitrile and tetradecylammonium tetrakis(pentafluorophenyl)borate (TDATFPB, a room temperature ionic liquid) as the supporting electrolyte. Based on the observed voltammetry of the decamethylferrocene at gold macrodisc electrodes they concluded that the electrochemistry occurred in a separate 60 μm thick liquid-like film of acetonitrile, CO2 and the electrolyte present on the surface of the Au electrode. We were therefore prompted to see if this was a more general phenomenon and to look closely at the voltammetry in scCO2/MeCN under our conditions (0.15 wt%, 0.17 mole fraction (CO2/MeCN) 0.006 mole fraction (MeCN/TBATFB) acetonitrile with tetraalkylammonium tetrafluoroborate electrolyte) to see if there is evidence for the presence of such a film at the electrode surface.
In this paper we present our results using decamethylferrocene as an outer sphere redox probe to investigate the electrochemistry at both micro and macroelectrodes. We determine the diffusion coefficient through microelectrode analysis and we present evidence that indicates that in our system there is no evidence for a liquid like film present at the surface of the Pt micro disc or at an Au macro disc electrode.
2. Experimental
2.1 Reagents
Tetrabutylammonium tetrafluoroborate ([NBun4][BF4]) was purchased from Aldrich and was used without further purification. Decamethylferrocene (C20H30Fe) was purchased from Aldrich and sublimed before use. Acetonitrile (MeCN) was purchased from Rathburn Chemicals and was refluxed over CaH2 before use. CO2 (99.9995%) was purchased from BOC. Hexaamineruthenium(III) chloride (Ru(NH3)6Cl3) was purchased from Aldrich and used without further purification.2.2 Electrochemical experiments
Cyclic voltammetry was performed using a potentiostat, Autolab, PGSTAT101 (Eco Chemie).Working electrodes were platinum microdiscs (20, 25 and 50 μm diameter) sealed in glass, then further sealed in 1/16′′ O.D PEEK tubing. The radii of the working microelectrodes were confirmed using scanning electron microscopy (SEM).
The “baffle” working electrode was a platinum microdisc (50 μm diameter) sealed in glass, then further sealed in 1/16′′ O.D PEEK tubing. In addition, 1/16′′ O.D PEEK tubing was placed over the working end of the electrode and extended for a further 5 mm to create a baffle around the electrode. Counter electrodes were 0.5 mm diameter Pt wires (sealed in 1/16′′ O.D PEEK tubing). Reference electrodes were 0.5 mm diameter Pt wires (sealed in 1/16′′ O.D PEEK tubing). The cell employed for the electrochemistry was a two-piece stainless steel construction. The bottom part has a 8.65 cm3 well, that forms the working volume of the cell. The top part has 7, 1/16′′, female, SSI type fittings, through which the electrodes, thermocouple and tubing could be sealed into the cell, along with an additional port for a safety key. The two pieces are sealed using a disposable O-ring, which are then further sealed with a safety belt, which is locked by the safety key, see our recent perspective article for more details.16
Electrolytes and metallocenes were introduced into the cell either as dry powders or solutions in acetonitrile. This loading step was carried out in a dry, dinitrogen-purged glove box when air sensitive materials were employed. To introduce DMFc into the supercritical cell, small quantities of the solid were weighed out and then transferred to the N2 purged glove box. Once in the N2 purged glove box, the DMFc was dissolved in acetonitrile. The acetonitrile itself was weighed out in the glove box to obtain the correct wt% (small errors can be introduced by this procedure as small changes in pressure in the glove box can affect the weight reading). For higher concentrations of DMFc (where tens of milligrams are required), the solid DMFc was introduced into the supercritical cell directly. For scCO2–MeCN mixtures, the cell was preheated to the desired temperature by immersing in a water bath. The water bath was heated thermostatically using a heated water circulator (TC120, Grant). Supercritical fluid grade CO2 (99.9995%, BOC) was then added via a specialised CO2 pump (PU-1580-CO2, JASCO). CO2 was pumped at rates from 0.1–2.0 cm3 min−1 (to ensure the cell temperature remained constant) until the desired pressure and CO2![[thin space (1/6-em)]](https://www.rsc.org/images/entities/char_2009.gif) :
:![[thin space (1/6-em)]](https://www.rsc.org/images/entities/char_2009.gif) MeCN ratio was achieved. The system was also stirred during pumping, using a magnetic stirrer, to ensure that the solution was homogenous. Stirring was stopped at least 5 min before any electrochemical measurements to allow the solution to settle.
MeCN ratio was achieved. The system was also stirred during pumping, using a magnetic stirrer, to ensure that the solution was homogenous. Stirring was stopped at least 5 min before any electrochemical measurements to allow the solution to settle.
3. Results and discussion
We have recently studied the phase behaviour and conductivity of scCO2 with acetonitrile as a co-solvent and tetrabutylammonium tetrafluoroborate as supporting electrolyte.30 In that paper we located the phase boundary for the single phase region. For the compositions similar to those used here that boundary lies at around 7.5 MPa at 309 K and increases linearly with temperature with a slope of around 0.375 MPa K−1. Consequently for all the experiments described below we will be well into the single phase region around 10 MPa above the boundary.3.1 Electrode preconditioning
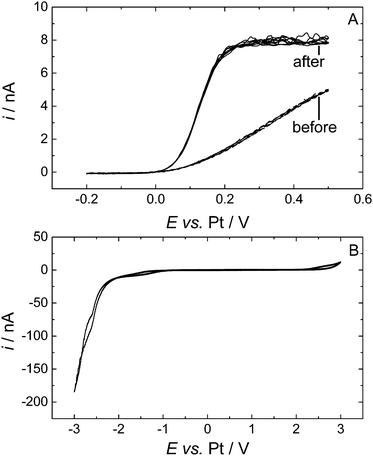
Decamethylferrocene (DMFc) was chosen as the redox probe in these experiments as it was found to be better behaved than ferrocene itself and has greater stability against reactions with any trace oxygen present.34 Preliminary results recorded at a 25 μm diameter Pt microdisc showed an electrochemical process at 0 V, but instead of reaching a limiting current on scanning anodically the current continued to increase, Fig. 1A. This behaviour was seen for all three sizes of Pt microdisc (20, 25 and 50 μm diameter). The voltammetry in Fig. 1A is suggestive of the presence of a semi porous blocking film at the electrode surface. Upon cycling the electrode within the solvent potential window (−0.2 V to 3 V then to −3 V, Fig. 1B) the voltammetry changes and the expected microelectrode redox wave is seen with a well-defined plateau. We attribute this change to the formation of a film on the electrode that is removed upon cycling over a wider potential range.To investigate over which region the film was removed from the surface the potential range of the conditioning cycle was altered. When the electrode was cycled from −0.2 V to 3 V the film was not removed and the voltammetry was unchanged. However when the conditioning cycle was set between −0.2 V to −3 V the film was removed and well behaved DMFc voltammetry was obtained as shown Fig. 1A curve 2. We can therefore conclude that the blocking film at the electrode was removed by reduction.
Once this preconditioning step was performed on an electrode, reproducible and stable voltammetry was seen and the preconditioning step did not need to be repeated during that experimental session. A similar problem was encountered by Crooks and Bard2 when using ferrocene in supercritical acetonitrile. There they reported the presence of a passivating layer at the tungsten working electrode that could be removed by a short voltage pulse, but which did not affect subsequent electrochemical measurements. This layer was attributed to the formation of a polymer of acetonitrile on the electrode surface. It is important to note that in these experiments it is not possible to polish the electrodes immediately before recording the voltammetry and that it takes some time (of the order of 1/2 day) to assemble the high pressure cell, load it with electrolyte, reagent, acetonitrile and CO2 and then to bring it up to temperature and pressure.
3.2 Electrochemistry of decamethylferrocene in scCO2 with 15 wt% CH3CN
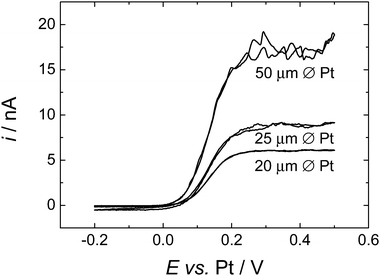
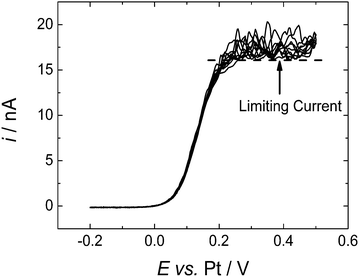
Cyclic voltammetry, at all three sizes of microdisc, gave stable, reproducible results. Fig. 2 shows typical cyclic voltammograms for all three sizes of Pt microdisc. For each size of electrode we observe well behaved voltammetry with a well-defined sigmoidal wave as expected for the steady state response at a microelectrode but with a limiting current plateau that is noisy and never settles to a stable value. The magnitude of the noise is larger at the larger electrode.The noise seen on the limiting current is attributed to natural convection of the supercritical fluid mixture – a process which has a significant influence because of the low viscosity of the supercritical fluid and which is presumably driven by temperature gradients within the high pressure cell. Running repeated voltammetric scans allows us to build up an averaged current response, Fig. 3. Then to estimate the diffusion limited current we recognise that the convection causes additional transport of material to the microdisc surface and therefore only increases the current. We therefore take the lower bound of the current in the plateau region as the best estimate of iL, the diffusion limited current at the microdisc.
Microdisc voltammograms were analysed in the standard way by making mass transport corrected Tafel plots (plots of ln((iL/i) − 1) against E, where iL is the diffusion limited current and i is the measured current at potential E). This yields a straight line plot with an intersection on the potential axis of E′, with a gradient of nF/RT. Voltammograms obtained for two different concentrations of DMFc (0.22 and 0.43 mM) and two different sizes of Pt microdisc electrode (25 and 50 μm diameter) were analysed and the results are given in Table 1.
| [DMFc]/mM | Electrode diameter/μm | n | E′ vs. Pt/V ± 0.002 V |
|---|---|---|---|
| 0.22 | 25 | 0.998 (±0.004) | 0.119 |
| 50 | 1.03 (±0.01) | 0.110 | |
| 0.43 | 25 | 0.900 (±0.002) | 0.131 |
| 50 | 0.910 (±0.006) | 0.132 |
From the results in Table 1 we can see that the DMFc behaves as an ideally reversible system at the lower concentration (0.22 mM) but that on increasing the higher concentration it starts to deviate from ideality and we find n < 1.
3.3 Electrochemistry of decamethylferrocene in scCO2 with 15 wt% CH3CN using a microdisc electrode with a baffle
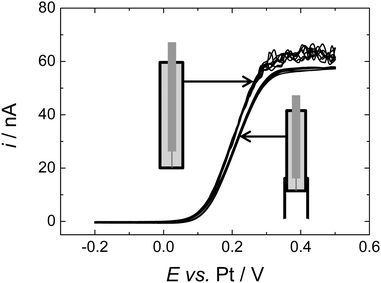
In order to clearly demonstrate that the instability in the limiting current seen at microdisc electrodes was due to natural convection we constructed a microdisc electrode with a baffle around the end – for details of the construction see the Experimental Section. The baffle comprises an extended piece of PEEK tubing which surrounds the working electrode and extends approximately 5 mm beyond the face of the electrode and surrounding insulation. In this case a 50 μm diameter Pt disc electrode was used encased in 1/16′′ diameter insulating sheath. Fig. 4 shows voltammograms recorded at the electrode fitted with the baffle and a nominally identical Pt microdisc electrode recorded in the same cell during the same supercritical experiment. Note both electrodes were preconditioned as described above to clean the electrode surface before recording the voltammograms. As the figure shows, for the microdisc fitted with the baffle a stable steady state limiting current plateau is obtained although this limiting current is slightly below the minimum plateau current on the “bare” microdisc.The slight difference in limiting currents at the two electrodes is due to differences in their radii. This was confirmed by comparing the voltammetry for the two electrodes in aqueous ruthenium(III) hexamine solution. The two limiting currents were measured from the ruthenium hexamine trichloride system, the difference between them was found to be iL(NB,Ru)/iL(B,Ru) = 1.07, where NB refers to “no baffle” and B to “baffle”.
3.4 Determination of the diffusion coefficient of decamethylferrocene in scCO2 with 15 wt% CH3CN
The diffusion controlled limiting current at a microdisc35 is given by| iL = 4nFDca | (1) |
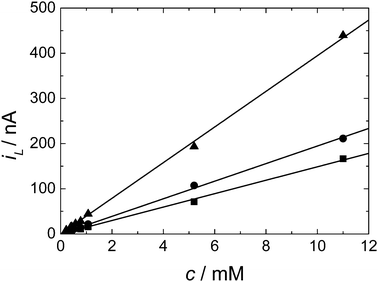
Fig. 5 shows the plot obtained for the diffusion limited current against the concentration of DMFc over the range 0.22 to 11 mM for three different microdisc electrodes. As we can see the limiting current increases linearly with concentration in all cases as expected from eqn (1). The results also clearly show that the solubility of DMFc in scCO2/MeCN under these conditions exceeds 11 mM. From the slopes of the plots in Fig. 5 and using eqn (1) we obtain the values for D given in Table 2.
| a/μm | D/cm2 s−1 |
|---|---|
| 9.5 ± 0.1 | 4.05 × 10⁻⁵ ± 0.046 × 10⁻⁵ |
| 12.64 ± 0.2 | 3.99 × 10⁻⁵ ± 0.064 × 10⁻⁵ |
| 24.72 ± 0.4 | 4.14 × 10⁻⁵ ± 0.070 × 10⁻⁵ |
| Mean | 4.06 × 10⁻⁵ ± 0.06 × 10⁻⁵ |
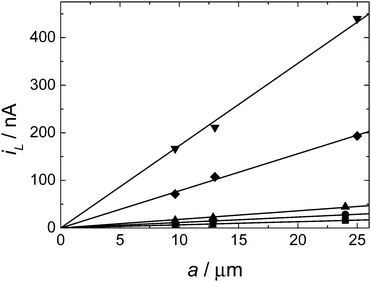
Fig. 6 shows a plot of the limiting current as a function of microelectrode radius for a separate set of experiments using five different DMFc concentrations. Again we can see that the results are fully consistent with eqn (1). The diffusion coefficients obtained from the slopes of the lines in Fig. 6 are given in Table 3.
| c/mM | D/cm2 s−1 |
|---|---|
| 0.43 ± 0.018 | 3.96 × 10⁻⁵ ± 0.16 × 10⁻⁵ |
| 0.78 ± 0.018 | 3.81 × 10⁻⁵ ± 0.085 × 10⁻⁵ |
| 1.07 ± 0.018 | 4.37 × 10⁻⁵ ± 0.078 × 10⁻⁵ |
| 5.20 ± 0.018 | 3.89 × 10⁻⁵ ± 0.017 × 10⁻⁵ |
| 11.0 ± 0.018 | 4.08 × 10⁻⁵ ± 0.012 × 10⁻⁵ |
| Mean | 4.02 × 10⁻⁵ ± 0.07 × 10⁻⁵ |
From the two sets of experiments (a total of eight separate experiments carried out over two weeks) we find excellent agreement in the values of D for DMFc of 4.05 × 10⁻⁵ cm2 s−1. This is comparable to diffusion coefficients previously reported in our work in scCO2/MeCN under similar conditions for [Cu(MeCN)4]+ of 2.30 × 10⁻⁵ cm2 s−1 with [NBun4][BF4] supporting electrolyte and 3.30 × 10⁻⁵ cm2 s−1 with [NBun4][B(3,5-(CF3)2C6H3)] supporting electrolyte.17
3.5 Comparison with the results of Toghill et al.
Recently Toghill et al.7 suggested, based on their experimental data for the voltammetry of DMFc in scCO2/MeCN, that a 60 μm thick liquid layer formed at the working electrode surface and that all of the voltammetry occurred within this layer. This conclusion was based on the results of voltammetry at macrodiscs at scan rates of 25–1000 mV s−1.From their results they obtained a diffusion coefficient for DMFc of 1.86 × 10⁻⁵ cm2 s−1. From our experiments with Pt microdisc electrodes there is no evidence for the presence of a liquid film at the electrode surface. We see microelectrode behaviour as a function of concentration and electrode radius which is fully consistent with the standard model. From work on SECM36–38 we know that the current at a microdisc electrode increases by ∼1.1 times its bulk value when the electrode is 4 multiples of the electrode radius from an interface at which the redox species concentration is held at the bulk value (the positive feedback case in SECM). Thus, if the mass transport limiting current in our experiments were due to transport across a thin (<100 μm) liquid film we would not see the correct dependence of limiting current on microdisc radius for electrodes up to 25 μm radius. In addition we see a strong influence of natural convection on the limiting current; this is inconsistent with the presence of a thick liquid film at the electrode surface.
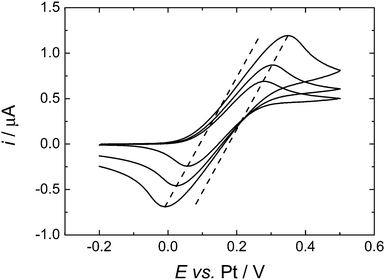
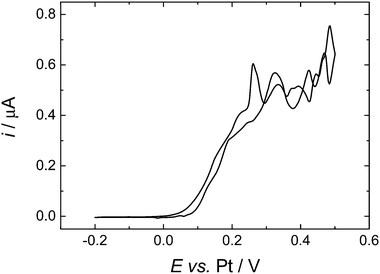
To compare more directly to the work of Toghill et al. we also studied the voltammetry at a gold macrodisc electrode. In the case of gold electrodes we found no evidence for the formation of a polymeric film of the type seen for Pt electrodes and it was not necessary to cycle the electrode to cathodic potentials to clean the surface. Fig. 7 shows voltammograms recorded at 100, 200 and 500 mV s−1. At these scan rates the voltammograms are not significantly distorted by the convection within the cell (see below) but the effects of iR drop are significant. The dashed lines in Fig. 7 connect the peak currents at the different scan rates and provide a simple way to correct for the effects of iR drop since for the reversible case the peak potentials should be independent of scan rate. The slopes of the dashed lines give an estimate of the uncompensated resistance of 0.14 MΩ which is reasonable given the known conductivity of this electrolyte.30 The separation between the two lines is 83 mV, close to the expected value of 61.2 mV for a reversible 1e− process at 309 K. From the cyclic voltammetry at the gold macroelectrode we estimate the diffusion coefficient for the DMFc to be 5.05 × 10⁻⁵ cm2 s−1 which compares well with the results presented above for the microelectrodes. At lower scan rates the voltammetry at the gold macrodisc electrode is significantly distorted, as expected, by convection within the cell. Fig. 8 shows a voltammogram recorded at 10 mV s−1. It has the sigmoidal shape expected for hydrodynamic voltammetry and shows significant noise at anodic potential where the current becomes mass transport limited.
It is important to note that there are significant differences in the experimental conditions used in our studies and those of Toghill et al. Toghill et al. used an ionic liquid electrolyte (10 mM [N(C10H11)4][B(C6F5)4]) and significantly higher concentrations of acetonitrile co-solvent (up to 30 vol% in their work as compared to ∼15 wt% here). Their experiments were carried out at slightly higher temperature (313 rather than 309 K) but at lower pressure (10 rather than 17 MPa). As the acetonitrile mole fraction is increased, the dielectric constant of the system increases. Thus it is crucial to add 10–18% (mole fraction) of acetonitrile into scCO2 to achieve a dielectric constant of 7 to ensure sufficient dissociation of the electrolyte.16 Adding much higher concentrations of acetonitrile (xCH3CN > 0.5) will significantly reduce the electrostatic solvation energy, but will also make the solution more liquid-like and therefore slow down mass transport.
Although a mole fraction of 0.41 will yield a higher dielectric constant, it also moves towards a more liquid-like system. A marked difference in the voltammetry between the results of Toghill et al. and the present work is the significant sloping background seen in their voltammograms (compare Fig. 2 and 3 in their paper with Fig. 2 above). The reason for this is unclear but it clearly affects their limiting current and peak current values.
4. Conclusions
We have carried out detailed studies of the voltammetry of decamethylferrocene in scCO2/MeCN (15 wt%), 20 mM [NBun4][BF4] at 309 K and 17.5 MPa at Pt microdisc electrodes and a gold macroelectrode. For the Pt electrodes we find that it is necessary to perform a preconditioning step to remove a passivating film initially present at the surface, but this is not necessary for the gold electrode. In all cases there is significant noise in the current at high overpotential caused by natural convection within the cell due to the low viscosity of the supercritical fluid. We are able to significantly reduce this by placing a baffle around the microelectrode electrode. For the platinum microelectrode studies we find reversible 1e− redox behaviour with a formal potential of 0.115 V vs. Pt pseudo reference electrode. The limiting currents, corrected for the effects of convection, measured at the Pt microdisc electrodes at concentrations from 0.22 to 11 mM and for radii from 10 to 25 μm all obey the microdisc equation. From the analysis of the results we obtain a value of the diffusion coefficient of DMFc of D = 4.06 × 10⁻⁵ cm2 s−1 in scCO2/MeCN (15 wt%), 20 mM [NBun4][BF4] and 309 K at 17.5 MPa. The solubility limit for DMFc under these conditions is shown to exceed 11 mM. The results obtained at the gold macroelectrode are wholly consistent with the results for the Pt microelectrodes. We therefore conclude that in scCO2/MeCN (15 wt%), 20 mM [NBun4][BF4] and 309 K at 17.5 MPa the electrochemistry of DMFc is well behaved and there is no evidence for the presence of a liquid film coating the electrode surface.Acknowledgements
This work is part of the Supercritical Fluid Electrodeposition project (www.scfed.net) which is a multidisciplinary collaboration of British universities investigating the fundamental and applied aspects of supercritical fluids funding by a Programme Grant from the EPSRC (EP/I013394/1). The author would like to thank Dr Wenjian Zhang for his help with sublimation of materials. The author would also like to thank Dr Charlie Cummings for his advice on the preconditioning step. We would also like to acknowledge our team members at University of Southampton and collaborating teams at University of Nottingham and University of Warwick. PNB gratefully acknowledges the receipt of a Wolfson Merit award.Notes and references
- K. E. Toghill, M. A. Méndez and P. Voyame, Electrochem. Commun., 2014, 44, 27–30 CrossRef CAS PubMed.
- R. M. Crooks and A. J. Bard, J. Electroanal. Chem., 1988, 243, 117–131 CrossRef CAS.
- C. R. Cabrera and A. J. Bard, J. Electroanal. Chem., 1989, 273, 147–160 CrossRef CAS.
- A. P. Abbott and J. C. Harper, J. Chem. Soc., Faraday Trans., 1996, 92, 3895–3898 RSC.
- A. P. Abbott, C. A. Eardley, J. C. Harper and E. G. Hope, J. Electroanal. Chem., 1998, 457, 1–4 CrossRef CAS.
- A. P. Abbott, E. G. Hope and D. J. Palmer, Anal. Chem., 2005, 77, 6702–6708 CrossRef CAS PubMed.
- K. E. Toghill, P. Voyame, D. Momotenko, A. J. Olaya and H. H. Girault, Phys. Chem. Chem. Phys., 2013, 15, 972–978 RSC.
- D. Niehaus, M. Philips, A. Michael and R. M. Wightman, J. Phys. Chem., 1989, 93, 6232–6236 CrossRef CAS.
- S. A. Olsen and D. E. Tallman, Anal. Chem., 1994, 66, 503–509 CrossRef CAS.
- D. L. Goldfarb and H. R. Corti, J. Phys. Chem. B, 2004, 108, 3368–3375 CrossRef CAS.
- M. Gattrell, N. Gupta and A. Co, J. Electroanal. Chem., 2006, 594, 1–19 CrossRef CAS PubMed.
- A. P. Abbott and C. A. Eardley, J. Phys. Chem. B, 2000, 104, 775–779 CrossRef CAS.
- M. Atobe, H. Ohsuka and T. Fuchigami, Chem. Lett., 2004, 33, 618–619 CrossRef CAS.
- H. Yan, T. Sato, D. Komago, A. Yamaguchi, K. Oyaizu, M. Yuasa and K. Otake, Langmuir, 2005, 21, 12303–12308 CrossRef CAS PubMed.
- P. E. Anderson, R. N. Badlani, J. Mayer and P. A. Mabrouk, J. Am. Chem. Soc., 2002, 124, 10284–10285 CrossRef CAS PubMed.
- P. N. Bartlett, D. A. Cook, M. W. George, A. L. Hector, J. Ke, W. Levason, G. Reid, D. C. Smith and W. Zhang, Phys. Chem. Chem. Phys., 2014, 16, 9202–9219 RSC.
- D. Cook, P. N. Bartlett, W. J. Zhang, W. Levason, G. Reid, J. Ke, W. T. Su, M. W. George, J. Wilson, D. Smith, K. Mallik, E. Barrett and P. Sazio, Phys. Chem. Chem. Phys., 2010, 12, 11744–11752 RSC.
- P. N. Bartlett, M. Perdjon-Abel, D. Cook, G. Reid, W. Levason, F. Cheng, W. Zhang, M. W. George, J. Ke, R. Beanland and J. Sloan, ChemElectroChem, 2014, 1, 187–194 CrossRef CAS.
- J. Ke, P. N. Bartlett, D. Cook, T. L. Easun, M. W. George, W. Levason, G. Reid, D. Smith, W. T. Su and W. J. Zhang, Phys. Chem. Chem. Phys., 2012, 14, 1517–1528 RSC.
- J. Ke, W. T. Su, S. M. Howdle, M. W. George, D. Cook, M. Perdjon-Abel, P. N. Bartlett, W. J. Zhang, F. Cheng, W. Levason, G. Reid, J. Hyde, J. Wilson, D. C. Smith, K. Mallik and P. Sazio, Proc. Natl. Acad. Sci. U. S. A., 2009, 106, 14768–14772 CrossRef CAS PubMed.
- C. F. Karanikas and J. J. Watkins, Microelectron. Eng., 2009, 87, 566–572 CrossRef PubMed.
- A. Cabanas, D. P. Long and J. J. Watkins, Chem. Mater., 2004, 16, 2028–2033 CrossRef CAS.
- A. P. Abbott and J. C. Harper, Phys. Chem. Chem. Phys., 1999, 1, 839–841 RSC.
- M. S. Kim, J. Y. Kim, C. K. Kim and N. K. Kim, Chemosphere, 2005, 58, 459–465 CrossRef CAS PubMed.
- C. Y. Kong, M. Nakamura, K. Sone, T. Funazukuri and S. Kagei, J. Chem. Eng. Data, 2010, 55, 3095–3100 CrossRef CAS.
- D. L. Goldfarb, D. P. Fernandez and H. R. Corti, Fluid Phase Equilib., 1999, 158, 1011–1019 CrossRef.
- H. Ohde, F. Hunt, S. Kihara and C. M. Wai, Anal. Chem., 2000, 72, 4738–4741 CrossRef CAS.
- J. M. Blackburn, D. P. Long, A. Cabanas and J. J. Watkins, Science, 2001, 294, 141–145 CrossRef CAS PubMed.
- H. Wakayama and Y. Fukushima, Ind. Eng. Chem. Res., 2006, 45, 3328–3331 CrossRef CAS.
- P. N. Bartlett, D. C. Cook, M. W. George, J. Ke, W. Levason, G. Reid, W. T. Su and W. J. Zhang, Phys. Chem. Chem. Phys., 2009, 12, 492–501 RSC.
- A. O'Neil and J. J. Watkins, Chem. Mater., 2007, 19, 5460–5466 CrossRef.
- E. T. Hunde and J. J. Watkins, Chem. Mater., 2004, 16, 498–503 CrossRef CAS.
- A. C. Michael and R. M. Wightman, Anal. Chem., 1989, 61, 2193–2200 CrossRef CAS.
- I. Noviandri, K. N. Brown, D. S. Fleming, P. T. Gulyas, P. A. Lay, A. F. Masters and L. Phillips, J. Phys. Chem. B, 1999, 103, 6713–6722 CrossRef CAS.
- G. Denuault, M. V. Mirkin and A. J. Bard, J. Electroanal. Chem., 1991, 308, 27–38 CrossRef CAS.
- C. Lefrou and R. Cornut, ChemPhysChem, 2010, 11, 547–556 CrossRef CAS PubMed.
- J. L. Amphlett and G. Denuault, J. Phys. Chem. B, 1998, 102, 9946–9951 CrossRef CAS.
- A. J. Bard and M. V. Mirkin, Scanning Electrochemical Microscopy, Marcel Dekker, Inc., New York, 2001 Search PubMed.
| This journal is © the Owner Societies 2015 |

