 Open Access Article
Creative Commons Attribution 3.0 Unported Licence
Photodesorption of water from rutile(110): ab initio calculation of five-dimensional potential energy surfaces of ground and excited electronic states and wave packet studies†
Jan
Mitschker
and
Thorsten
Klüner
*
Institute of Chemistry, Carl von Ossietzky Universität Oldenburg, Germany. E-mail: Thorsten.Kluener@uni-oldenburg.de
First published on 14th November 2014
Abstract
In this paper, we report on our results concerning the interaction of water with titanium dioxide in its rutile modification. The (110) surface is modelled by an embedded Ti9O18Mg714+ cluster. We present up to five-dimensional potential energy surfaces for the water molecule on this surface and include the dissociation of one hydrogen atom. The electronic ground state as well as one electronically excited state is included. To deal with the multi-configurational character of the wave function, we use the complete active space self-consistent field (CASSCF) approach. The resulting potential energy surfaces are fitted by means of an artificial neural network. As a first example of quantum dynamical studies based on our potential surfaces, we present results on the photodesorption of water from rutile(110).
I. Introduction
The photocatalytic properties of titanium dioxide have motivated a large number of studies in the last decades.1,2 Experimental and theoretical findings have contributed to a better understanding of these phenomena. Nevertheless, insight into the underlying processes on an atomic, i.e. femtosecond time-scale is still deficient. From an experimental point of view, preparation of perfect surfaces and measurement of ultra fast processes is still a great challenge. From a theoretical point, substrate surfaces are hard to model and require large computational power, which became available only in the last years. Density functional theory is one of the working horses in computational chemistry, but suffers—despite the problem of choosing the correct functional—of two major drawbacks: bond breaking reactions and well-defined electronically excited states are not accessible without further simplifications. This is due to the multi-configurational character of the wave function. The complete active space self-consistent field (CASSCF) theory on the other hand can deal with this problem and dynamical correlation can be included later on within a perturbative approach (CASPT2).From the plethora of surface photoreactions water splitting is one of the most interesting processes.3 This is due to the fact that new routes to energy and fuels become indispensable. Water splitting by sunlight can be considered as an ideal case of green chemistry and hydrogen may be the new fuel. In the last years, a large variety of potential substrates have been identified. Nevertheless, most of them suffer from disadvantages like costs, toxicity, poor stability (e.g. photocorrosion) or low efficiency. This is connected to the thermodynamical potential and the size of the band gap. Although the last point is true for titanium dioxide, too, many attempts tried to overcome this challenge. Modifying the surface by defects and dopants is one basic idea. Others try to build combined compounds or add small clusters onto the titanium dioxide surface using two different photocatalysts in a two-step excitation. Within a microscopic picture of photoreactions on surfaces, a large set of elementary processes can be identified that act together and can enhance or reduce the photocatalytic activity.4 Most important are: excitation and charge separation at the beginning and charge transport through the bulk material towards the surface. Here, adsorption of reactants and charge transport between substrate and adsorbate are crucial steps. Eventually, reaction products have to desorb in order to release reaction sites. On the other hand, recombination of electrons and holes or the presence of poisons, either in the environment or formed during the reaction, can reduce the efficiency dramatically. Despite extensive research activities, no technical device for water splitting has been developed so far. Nevertheless, other applications like self-cleaning surfaces or anti-microbiological coatings have been established successfully.
In this contribution, we want to address the water splitting by reducing the complexity of this system in order to make computations on a high level of theory feasible. Our aim is not to give a consistent picture of the whole reaction, but just to understand one of the elementary steps. In the first part of this paper, we want to present the potential energy surfaces for the electronic ground state and a representative electronically excited state. They are the prerequisite for quantum dynamical studies which constitute the second part of our study.
II. Methods
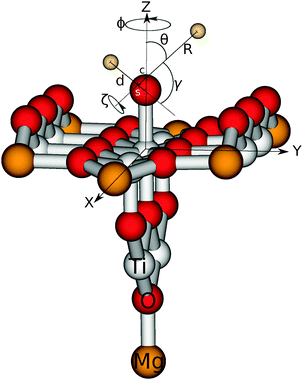
For water on rutile(110) two adsorption forms have been found experimentally and theoretically. They are depicted in Fig. 1. In the molecular form water binds as a whole molecule above a five-fold titanium atom, whereas in the dissociative form one hydrogen has moved to a bridging oxygen and only an OH fragment remains above the titanium atom.In order to allow the use of multi-configurational ab initio methods, we pursued an embedded cluster approach. Our cluster consists of nine titanium and 18 oxygen atoms as shown in Fig. 2. Artificial polarisation at the oxygen dangling bonds is prevented by adding seven further magnesium atoms at the corners of the cluster. It should be emphasized that their presence is just for this technical reason and they do not act as some kind of dopant. This Ti9O18Mg714+ cluster is embedded in a finite point charge field (PCF) of 4421 point charges. The charges are +2 and −1 and the positions are equivalent to the coordinates of titanium and oxygen, respectively.
Because a cluster model is not sufficient to calculate surface relaxation effects, we used the coordinates from a previous study by Meyer et al.5 Within that study, a bare and a water covered surface were used. For the water adsorption both a molecular and a dissociative form were considered. In our study, we kept the surface (and PCF) geometry fixed for all data points and used an average value from these three surfaces. Here, only the z-direction normal to the surface has been included.
The basis set is of nearly triple zeta quality for the central atoms of the cluster and has been published elsewhere.6,7 However, we have changed the basis set for the central oxygen atoms in the bridging oxygen rows because they bind to the dissociated hydrogen during the reaction. Therefore, their basis sets are chosen to be equivalent to the one of the water oxygen (see below).
It has been demonstrated in previous studies6–9 that this embedded cluster is large enough to deal with photoreactions on titanium dioxide. Details on the basis set and the embedding scheme can be found elsewhere.6–9 To describe the bond breaking properly, a multi-configurational wave function is necessary. We used the CASSCF approach and the size of the active space has been checked thoroughly (see below). Dynamical correlation can be included by a subsequent CASPT2 calculation. The size of the cluster and of the basis set is a compromise between accuracy and computational requirements needed for high level computations. All calculations were performed with the Molcas program package, version 7.6.10
Subsequent quantum dynamical studies require a coordinate system which results in a Hamiltonian that can be implemented efficiently. Cartesian coordinates are one choice, but here the coordinates have no physical meaning. Systems where bond angles and lengths are included explicitly are therefore much more advantageous. Jacobi coordinates are one solution,11 because they separate the motion of the center of mass from internal coordinates and furthermore provide a dissociation vector. Their definition for the system under study is given in Fig. 2. By keeping the values of X, ζ and Φ constant, Cs symmetry can be preserved which results in a dramatic reduction of the computational effort. Furthermore, the distance between oxygen and the second hydrogen atom was fixed at a value of 0.96 Å. The remaining five degrees of freedom were considered in our study. It should be emphasized that the dissociation vector R formally defines the distance between hydrogen and the center of mass of OH. Because of the much higher mass of oxygen, the center is located closely to the oxygen atom (for small and medium values of R) and therefore the dissociation vector R can be interpreted as the OH distance in good approximation.
III. Results
A. The water molecule
The choice of the basis set for the atoms involved is crucial for the calculation of bond-breaking processes and electronic excitations. Therefore, we carefully checked the basis set for the water molecule in the gas phase with respect to dissociation and excitation energies. We choose the first excited state (Ã1B1) for the electronic excitation, which is the HOMO–LUMO transition. For CASSCF (and CASPT2) calculations the active space is a further important aspect. In Table 1 the calculated dissociation energies for various basis sets and active spaces are given. The OH bond was 0.95 Å and the angle 104.45°. For all calculations the lowest orbital 1a1, which is the oxygen 1s orbital, was kept inactive. In the calculations with only six electrons in the active space, the 2a1 orbital was kept inactive, too. The two larger CAS calculations (CAS(8,6) and CAS(6,5)) comprise both anti-bonding orbitals, whereas in the smaller ones only the orbital of the breaking bond is included. The basis set IV in Table 1 is the (10s6p3d1f) → 〈7s4p3d1f〉 basis for oxygen used in our previous studies, and the cc-pVTZ basis augmented by one diffuse function (ζ = 0.02526) for the hydrogen atom.| CAS(8,6) | CAS(8,5) | CAS(6,5) | CAS(6,4) | Contraction | ||
|---|---|---|---|---|---|---|
| I | cc-pVDZ | 4.91 (4.51) | 40 → 24 | |||
| II | cc-pVTZ | 5.18 (4.66) | 5.19 (4.47) | 5.24 (4.66) | 5.26 (4.32) | 74 → 58 |
| III | aug-cc-pVTZ | 5.24 (4.71) | 5.30 (4.36) | 5.30 (4.70) | 5.33 (4.35) | 108 → 92 |
| IV | See text | 5.21 (4.70) | 5.23 (4.49) | 5.28 (4.70) | 5.30 (4.35) | 84 → 71 |
The results reveal that the dissociation energy is quite insensitive to the basis set and active space used except for the cc-pVDZ basis which is clearly insufficient. The smaller spaces give slightly higher dissociation energies. Obviously, the CASSCF values react more sensitive to the reduced number of virtual orbitals. The perturbative treatment can overcome this deficiency. The values on the CASPT2 level of theory are in good agreement with the experimental findings.
For the 1Ã1B1 state the corresponding excitation energies are given in Table 2. Exclusion of the 2a1 orbital was unrewarding because for some bond length and basis sets it moved to the active space by some unwanted orbital rotations. Furthermore, due to the results in the previous section the cc-pVDZ basis set was not used. In the experiment,13 the excitation occurs in an energy range from 7.25 eV to 7.6 eV with a maximum at 7.447 eV.
| CAS(8,6) | CAS(8,5) | CAS(6,5) | |
|---|---|---|---|
| II | 8.16 (8.10) | 8.14 (7.81) | 8.81 (8.12) |
| III | 7.65 (7.38) | 7.64 (7.08) | 7.71 (7.36) |
| IV | 7.64 (7.40) | 7.63 (7.09) | 7.71 (7.38) |
The importance of the diffuse functions is apparent from our results. Both basis sets with diffuse functions yield good excitation energies compared to the experimental value with an error of 0.2 eV. It should be noted that the better agreement is not only a consequence of the diffuse functions at the oxygen. Omitting the diffuse s-function IV basis at the hydrogen atoms changes the energy dramatically. For this modified basis set the excitation energy is 8.06 eV (7.91 eV).
B. Adsorption of water on rutile(110)
With the methods outlined above for the cluster and the basis set IV from the previous section, we calculated the potential energy surface for the electronic ground state. Because hydrogen is bound to an oxygen atom of the cluster in the dissociative form the active space is enlarged by this orbital and two further electrons, eventually resulting in a CAS(10,6) system. While the calculations for the water molecule in the gas phase were straightforward, here the problem arises that for those geometries that correspond to a molecular form unoccupied orbitals are not relevant. As a consequence, large orbital rotations occur and now d-orbitals of the titanium atoms become part of the active space. This of course leads to a discontinuous potential energy surface (PES). We overcame this challenge by performing two calculations for each data point. The first one was a single-reference calculation. For the second one we used the active space of this solution and kept all those orbitals frozen that are normally inactive. This procedure introduces an error that increases with the multi-configurational character of the wave-function but is less than in a RHF calculation. The results are visualized for one curve in Fig. 3. Although there is an error of about 1 eV for larger bond length, this region of the PES is not important.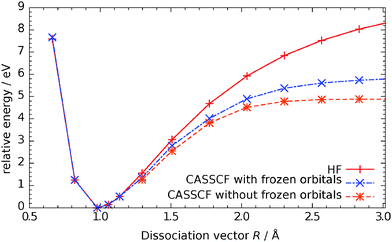 | ||
| Fig. 3 Comparison of energies for SCF, CASSCF(10,6) with frozen cluster orbitals and CASSCF(10,6) calculation. | ||
Within our coordinate system, the global minimum is found at θ = 58°, Y = 0.001 Å, Z = 2.2 Å, γ = 65° and R = 0.98 Å. This geometry corresponds to the molecular adsorption form as shown in Fig. 1. The second local minimum located at θ = 88°, Y = 0.32 Å, Z = 2.0 Å, γ = 40° and R = 2.57 Å is the dissociative form. The corresponding adsorption energies are −2.1 eV and −0.9 eV, respectively. For generating the PES, data points were calculated for geometries between these two minima on a regular grid with bond length up to 5.3 Å and distances from the surface up to 7.9 Å. For the remaining coordinates (0° ≤ θ ≤ 180°, 0° ≤ γ ≤ 180°, −1.38 Å ≤ Y ≤ 1.38 Å) those that are unphysical, e.g. because of strong nuclear repulsion or a movement into the surface, were omitted and the rest calculated randomly. In total 171![[thin space (1/6-em)]](https://www.rsc.org/images/entities/char_2009.gif) 239 ab initio data points were constructed. Unfortunately, CASPT2 calculations were too demanding for such a large number of points and therefore only CASSCF results are presented here.
239 ab initio data points were constructed. Unfortunately, CASPT2 calculations were too demanding for such a large number of points and therefore only CASSCF results are presented here.
In spite of this large number of data points the grid is still too sparse to be used for quantum dynamical simulations. Therefore, we used the method of artificial neural networks to fit our data. This idea became very popular in the last years (see for example the overview by Behler14–16). The great advantage is that no analytical expression is necessary. But this can also be considered as a disadvantage because the fitting now becomes some kind of black-box tool.
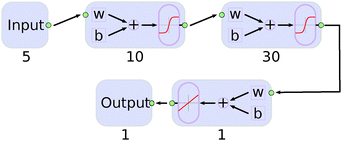
We found that a neural network with two hidden layers performs better than those with only one. The structure of the final network is shown in Fig. 4. The Matlab program17 was used and the algorithm for Bayesian regularization applied. As the low energy region of the PES is of great importance for the simulation, data points were weighted exponentially according to the equation:
| wi = exp((40 eV − Ei)/7 eV) | (1) |
Here, wi is the weight of data point i with energy Ei and the 40 eV is the highest energy calculated. This formula proofed to be more appropriate than a simple linear relationship between energy and weight. Further advanced methods have been proposed for other systems, like a hierarchical scheme fitting the high energy part as a zero-order potential and then fitting the differences in a second step.16,18 However, our straightforward and simple approach turned out to be sufficiently accurate for the current study.
Several combinations of sizes for the two layers were tested. By comparing with the input data, we found that a number of 10 and 30 neurons for the first and second layer were sufficient. Larger networks gave smaller errors but the generalization was worse and over-fitting occurred.
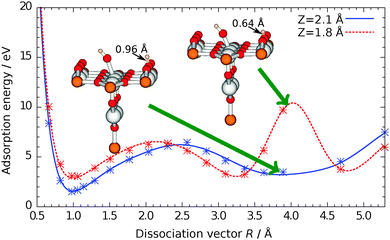
To show how well the neural network performs, in Fig. 5 two one-dimensional cuts from the five-dimensional PES are presented. The marks indicate the input and the lines the fitted data. Both curves differ only in the coordinate Z. However, in one case, this corresponds to an equilibrium distance between hydrogen and the bridging oxygen atom while in the other case the interaction is repulsive. This small change leads to very different curves. The Neural Network can deal with this issue and this is a clear proof for the universal character of the fitting method. The root-mean-square deviation of the five-dimensional surface is 0.1427 eV for the important points that are below 7.0 eV.
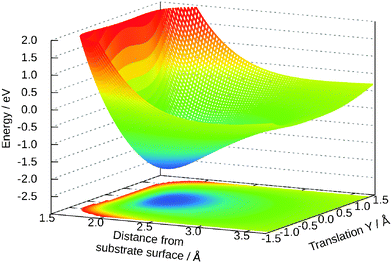
Out of the five-dimensional surface only two-dimensional cuts can be presented here. We restrict the discussion to some cases that are typical for the surface. Fig. 6 is an extension of the previous Fig. 5 for the distances R and Z. The geometries for the molecular and the dissociative adsorption are clearly visible as both are separated by an energy barrier. The dissociative case does not only depend on both coordinates shown here, but on the combination of the remaining ones. For example, moving the molecule in positive Y direction shifts this minimum to smaller distances R and small angles θ keep the hydrogen away from the bridging oxygen. For these angles, the potential is just Morse-like in R and Z direction.
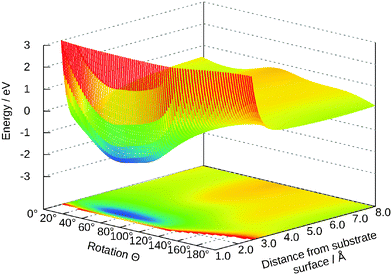
The dependency of the potential on the coordinates Z and Y and θ is shown in Fig. 7 and 8, respectively. The topology of these surfaces is quite simple and can be compared to systems with diatomic molecules. Adsorption above the central titanium is preferred and the water is symmetrically orientated with the oxygen pointing towards the surface (cf.Fig. 1 (left)). The coordinates Z, θ and Y can be used for simple photo-desorption studies as performed in our group for others systems previously.
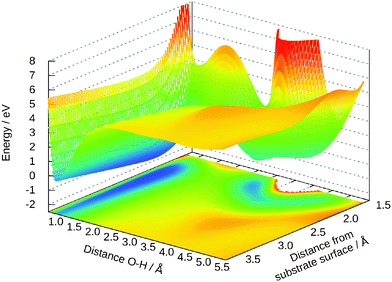
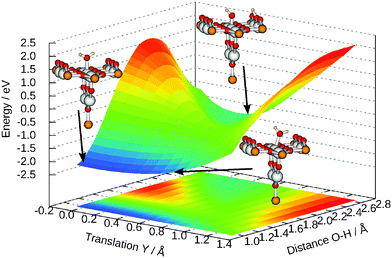
The importance of Y for the dissociation becomes obvious from Fig. 9 where the energy as a function of Y and R is plotted but all the others coordinates are optimized for each combination. The topology suggests that the energy barrier between both forms can be lowered significantly if the molecule translates towards the bridging oxygen, forming a new O–H bond and then moves back to central titanium atom. Some geometries are illustrated in Fig. 9, too. Comparing both adsorption geometries does not reveal the influence of this translation. Its a consequence of the fact that the energy change due to bond breaking is much stronger than for a simple translation. It should be emphasized that these considerations a only based on the topology of the potential energy surface and effects like tunneling can lead to different dynamics.
C. Electronically excited states of the water–rutile system
Electronical excitations are the main feature of photochemistry but they are most difficult to calculate. We faced various problems during our study of excited states. Most of them were related to unwanted orbital rotations that were even more pronounced than in the ground state. Neither intra-adsorbate nor adsorbate/cluster excitations could be performed for the whole potential energy surface. Therefore, we used a very simple approach for the excited state and removed one electron from the active space giving a H2O+ species. This can be justified by the picture of an hole attacking the adsorbate while the corresponding electron is far away in the bulk phase and does not influence the surface chemistry. For example, it was pointed out that surface hydroxyl radicals generated by photogenerated holes play a crucial role. This can be accomplished either by reaction of surface bound OH− ions or by reaction of water with surface-trapped holes.19–22 The detailed mechanism is still unknown.The frozen orbitals from the ground state were kept frozen in this CASSCF, too, but the active space was optimized for this cationic system. Of course, this introduces a further error, but only the qualitative topology of the excited states potential energy surface is important for the dynamical simulation whereas the vertical excitation does not enter.
Analogous to Fig. 8 in Fig. 10 the potential energy surface for this excited state is presented. A similar neural network was used but the size of the second hidden layer reduced to 25. As clearly visible in the figure, the state is strongly repulsive and the minimum at θ = 58° in the ground state vanishes. For most two-dimensional cuts this is the case.
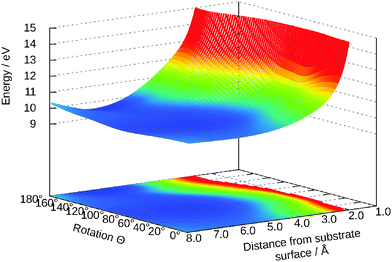 | ||
| Fig. 10 Two-dimensional cut for θ and Z in the excited state. The other values are: Y = 0.0 Å, γ = 65°, R = 0.98 Å. | ||
D. Photodesorption of water
As pointed out at the beginning, the potential energy surfaces can be used for quantum dynamical studies. For the coordinate system given the Hamiltonian reads:11 | (2) |
 | (3) |
 | (4) |
 | (5) |
 | (6) |
As a first step, we will consider the case of the photodesorption of a water molecule. This can be considered as a prototype of all non-adiabatic surface reactions.23 A three-dimensional study with Z, Y and θ included has been performed.
Gadzuk's jumping wave packet approach24,25 is the theoretical framework of the simulations. Within this model, a wave packet is propagated for N different times τn in the excited state and afterwards in the ground state until the expectation values of asymptotic observables converge. The time evolution can be written as:
| |Ψ(t;τn)〉 = e−iĤgs(t−τn)·e−iĤes(τn)|Ψ(0)〉 | (7) |
Expectation values are then obtained by an exponential averaging over all N trajectories according to:
 | (8) |
This formula allows for the exponential depletion of the excited state. It should be noted that the resonance life time τ is an empirical parameter and should be chosen according to experimental desorption probabilities. To our knowledge there is no experimental data available for this system and therefore this parameter might reveal a significant variation from a few femtoseconds to about 50 fs as demonstrated earlier. Nevertheless, the influence of τ on general features of the observables in similar systems is minor.
Furthermore, the imaginary time propagation26 has been used for generating the starting wave packet of the rovibronic ground state and a grid change27 was applied to keep the grid short in the asymptotic region of the potential. For all simulations the split-propagator28 was used with a time step of 10ℏEh−1 (0.24 fs).
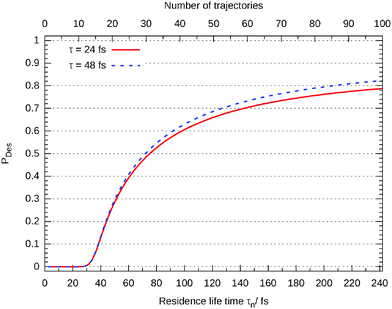
In Fig. 11 the desorption probability as a function of the number of trajectories N and the maximum residence life time is shown. Each is separated by 100ℏEh−1 (2.4 fs). As it can be seen, the Gadzuk averaged desorption probability nicely converges.
Closer analysis reveals that there are three different scenarios: for short propagation times (τn < 30 fs) the wave packet remains on the surface. For a longer life times the wave packet accelerates on the excited state's potential energy surface and moves off but the desorption is finalized in the ground state. This behaviour can be seen in Fig. 12 where the (not-averaged) desorption probability as a function of τn is shown for the excited state and the end of the corresponding propagation in the ground state. For example, at τn = 35 fs nothing of the wave packet is desorbed in the excited state but at the end of the ground state propagation half of it has left the surface. Finally, τn > 160 fs leads to a total desorption in the excited state.
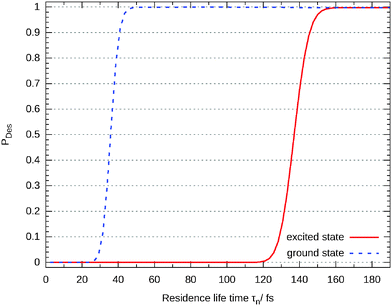 | ||
| Fig. 12 Desorption probability as a function of the residence life time at the end of the propagation in the excited state and in the ground state, respectively. | ||
In Fig. 11 the probability was given according to eqn (8) for two different values of τ. As already mentioned above, this value is often adjusted to experimental results. In default thereof, we give this probability as a function of τ in Fig. 13 showing that the influence on the probability is marginal for values larger than about 30 fs.
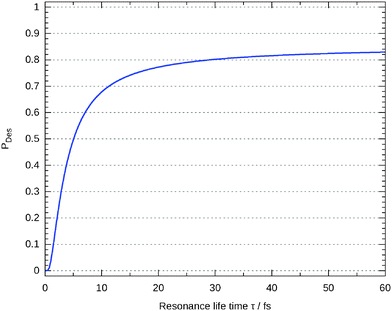 | ||
| Fig. 13 Desorption probability as a function of τ in eqn (8). | ||
Another observable that can me measured is the velocity of the desorbing molecules. Theoretically this is done by averaging the velocity over all rotational quantum states and then averaging according to eqn (8) for all the trajectories. In Fig. 14, this velocity distribution in z-direction is plotted for different resonance life times τ. As mentioned above, this observable only slightly depends on the parameter τ, making our predictions independent of this unknown value. The maximum of the distribution occurs for all resonance life times at v = 4600 ms−1. The distribution is monomodal with a tail becoming more pronounced for shorter resonance life times. This can be traced back to the corresponding distributions for the single trajectories. All of them are monomodal, too, but the maximum moves to higher velocities for longer residence life times. This could be expected from Fig. 10 because the excited state is repulsive and therefore longer life times will increase the acceleration of the molecule. For shorter resonance life times in the averaging formula, the impact of the slower trajectories is more pronounced leading to the tailing feature in the final velocity.
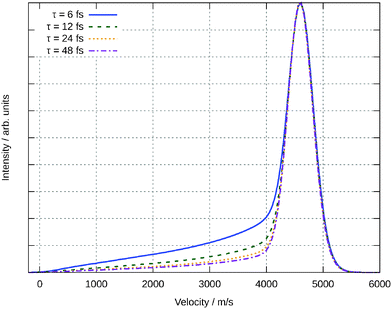 | ||
| Fig. 14 Velocity distribution of the desorbing water molecules for different resonance life times τ. | ||
In conclusion, the desorption mechanism found for the water–rutile system can be classified as an example of the MGR mechanism.29,30 Although our results are similar to a simple one-dimensional case, this behaviour is hard to predict in advance because complicated couplings of different degrees of freedom are possible that are not obvious in the PES for more than two dimensions (see for example ref. 9, 31 and 32).
IV. Conclusion and outlook
Within this paper, we have shown that the computation of a high-dimensional potential energy surface for the H2O–TiO2 system is possible on a high level of theory, although this is still a very challenging task. The main problem is the multi-configurational character of the wave function during the dissociation process of the water molecule. We were able to calculate a five-dimensional PES explicitly describing the breaking of one O–H bond. Furthermore, a second PES for a representative electronically excited state has been obtained. These potential energy surfaces have been used for quantum dynamical studies. As a prototype of non-adiabatic surface reactions we performed simulations on the photodesorption of water from rutile. This is a first step towards a detailed understanding of more complex reactions like photodissociation. We found that the photodesorption is an example of the MGR mechanism and predict experimental velocities of desorbing molecules around 4600 ms−1.Acknowledgements
We like to thank Prof. Dr Bernd Meyer for providing the geometry of the relaxed surfaces. The simulations were performed at the HPC Cluster HERO, located at the University of Oldenburg and funded by the DFG through its Major Research Instrumentation Programme (INST 184/108-1 FUGG) and the Ministry of Science and Culture of the Lower Saxony State. Financial support of the DFG through its Priority Program “Fuels Produced Regeneratively Through Light-Driven Water Splitting: Clarification of the Elemental Processes Involved and Prospects for Implementation in Technological Concepts” (SPP 1613) is gratefully acknowledged. J. M. thanks the Studienstiftung des Deutschen Volkes for getting a scholarship.References
- M. A. Henderson, Surf. Sci. Rep., 2011, 66, 185–297 CrossRef CAS PubMed.
- J. T. Yates and C. T. Campbell, Proc. Natl. Acad. Sci. U. S. A., 2011, 108, 911–916 CrossRef CAS PubMed.
- K. Maeda, J. Photochem. Photobiol., C, 2011, 12, 237–268 CrossRef CAS PubMed.
- J. T. Yates, Jr., Surf. Sci., 2009, 603, 1605–1612 CrossRef PubMed.
- P. M. Kowalski, B. Meyer and D. Marx, Phys. Rev. B: Condens. Matter Mater. Phys., 2009, 79, 115410 CrossRef.
- M. Mehring and T. Klüner, Chem. Phys. Lett., 2011, 513, 212–217 CrossRef CAS PubMed.
- M. Mehring and T. Klüner, Mol. Phys., 2013, 111, 1612 CrossRef CAS.
- M. Arndt, S. Murali and T. Klüner, Chem. Phys. Lett., 2013, 556, 98–101 CrossRef CAS PubMed.
- H. Spieker and T. Klüner, Phys. Chem. Chem. Phys., 2014, 16, 18743–18748 RSC.
- G. Karlström, R. Lindh, P.-Å. Malmqvist, B. O. Roos, U. Ryde, V. Veryazov, P.-O. Widmark, M. Cossi, B. Schimmelpfennig, P. Neogrády and L. Seijo, Comput. Mater. Sci., 2003, 28, 222 CrossRef.
- R. Schinke, Photodissociation dynamics. spectroscopy and fragmentation of small polyatomic molecules, Cambridge Univ. Press, Cambridge, 1995 Search PubMed.
- R. van Harrevelt and M. C. van Hemert, J. Chem. Phys., 2000, 112, 5777–5786 CrossRef CAS PubMed.
- R. Mota, R. Parafita, A. Giuliani, M.-J. Hubin-Franskin, J. Lourenço, G. Garcia, S. Hoffmann, N. Mason, P. Ribeiro, M. Raposo and P. Limão-Vieira, Chem. Phys. Lett., 2005, 416, 152–159 CrossRef CAS PubMed.
- J. Behler and M. Parrinello, Phys. Rev. Lett., 2007, 98, 146401 CrossRef.
- J. Behler, Chemical Modelling: Applications and Theory, The Royal Society of Chemistry, 2010, vol. 7, pp. 1–41 Search PubMed.
- J. Behler, Phys. Chem. Chem. Phys., 2011, 13, 17930–17955 RSC.
- MATLAB, version 8.2.0.701 (R2013b), The MathWorks Inc., Natick, Massachusetts, 2013 Search PubMed.
- S. Manzhos, X. Wang, R. Dawes and T. Carrington, J. Phys. Chem. A, 2006, 110, 5295–5304 CrossRef CAS PubMed.
- M. Patel, G. Mallia, L. Liborio and N. M. Harrison, Phys. Rev. B: Condens. Matter Mater. Phys., 2012, 86, 045302 CrossRef.
- K. Juodkazis, J. Juodkazytė, E. Jelmakas, P. Kalinauskas, I. Valsiūnas, P. Miečinskas and S. Juodkazis, Opt. Express, 2010, 18, A147–A160 CrossRef CAS PubMed.
- J. Tang, J. R. Durrant and D. R. Klug, J. Am. Chem. Soc., 2008, 130, 13885–13891 CrossRef CAS PubMed.
- R. Nakamura and Y. Nakato, J. Am. Chem. Soc., 2004, 126, 1290–1298 CrossRef CAS PubMed.
- P. Saalfrank, Chem. Rev., 2006, 106, 4116–4159 CrossRef CAS PubMed.
- J. Gadzuk, L. Richter, S. Buntin, D. King and R. Cavanagh, Surf. Sci., 1990, 235, 317–333 CrossRef CAS.
- J. W. Gadzuk, Surf. Sci., 1995, 342, 345–358 CrossRef CAS.
- R. Kosloff and H. Tal-Ezer, Chem. Phys. Lett., 1986, 127, 223–230 CrossRef CAS.
- R. Heather and H. Metiu, J. Chem. Phys., 1987, 86, 5009–5017 CrossRef CAS PubMed.
- M. D. Feit and J. J. A. Fleck, J. Chem. Phys., 1983, 78, 301–308 CrossRef CAS PubMed.
- D. Menzel and R. Gomer, J. Chem. Phys., 1964, 41, 3311–3328 CrossRef CAS PubMed.
- P. A. Redhead, Can. J. Phys., 1964, 42, 886–905 CrossRef CAS.
- S. Borowski, T. Klüner and H.-J. Freund, J. Chem. Phys., 2003, 119, 10367–10375 CrossRef CAS PubMed.
- I. Mehdaoui, D. Kröner, M. Pykavy, H.-J. Freund and T. Klüner, Phys. Chem. Chem. Phys., 2006, 8, 1584–1592 RSC.
Footnote |
| † We dedicate this paper to our colleague and friend Hendrik Spieker, who passed away on October 16th, 2014 due to a tragic accident. |
| This journal is © the Owner Societies 2015 |


