
 Open Access Article
 This Open Access Article is licensed under a
 Creative Commons Attribution 3.0 Unported Licence
High-rate amorphous SnO2 nanomembrane anodes for Li-ion batteries with a long cycling life†
Xianghong
Liu
*a,
Jun
Zhang
b,
Wenping
Si
ac,
Lixia
Xi
d,
Steffen
Oswald
d,
Chenglin
Yan
*ae and
Oliver G.
Schmidt
ac
aInstitute for Integrative Nanosciences, IFW-Dresden, Helmholtzstrasse 20, 01069 Dresden, Germany. E-mail: xianghong.liu@ifw-dresden.de; Fax: +49 351 4659 782
bSchool of Materials Science and Engineering, University of Jinan, Jinan 250022, China
cMaterial Systems for Nanoelectronics, Chemnitz University of Technology, Reichenhainerstrasse 70, 09107 Chemnitz, Germany
dInstitute for Complex Materials, IFW-Dresden, Helmholtzstrasse 20, 01069 Dresden, Germany
eSchool of Energy, Soochow University, 215006 Suzhou, Jiangsu, China. E-mail: c.yan@suda.edu.cn
First published on 3rd November 2014
Abstract
Amorphous SnO2 nanomembranes as anodes for lithium ion batteries demonstrate a long cycling life of 1000 cycles at 1600 mA g−1 with a high reversible capacity of 854 mA h g−1 and high rate capability up to 40 A g−1. The superior performance is because of the structural features of the amorphous SnO2 nanomembranes. The nanoscale thickness provides considerably reduced diffusion paths for Li+. The amorphous structure can accommodate the strain of lithiation/delithiation, especially during the initial lithiation. More importantly, the mechanical feature of deformation can buffer the strain of repeated lithiation/delithiation, thus putting off pulverization. In addition, the two-dimensional transport pathways in between nanomembranes make the pseudo-capacitance more prominent. The encouraging results demonstrate the significant potential of nanomembranes for high power batteries.
1. Introduction
With increase in demand for high power lithium ion batteries (LIBs), significant efforts have been devoted towards improving their cycling life, reversible capacity and rate capability. Among the newly minted metal oxide anode materials for LIBs with high theoretical capacity and environmental benignity, SnO2 has received extensive research attention. The lithiation mechanism of SnO2 includes the reduction of SnO2 into Sn nanoparticles and the subsequent alloying of Sn with lithium to form LixSn (0 ≤ x ≤ 4.4), which can be expressed by the following equations:1,2| SnO2 + 2Li+ + 2e− → SnO + Li2O | (1) |
| SnO + 2Li+ + 2e− → Sn + Li2O | (2) |
| Sn + xLi+ + 2e− → LixSn (0 ≤ x ≤ 4.4) | (3) |
The theoretical capacity of SnO2, based on eqn (1–3), is as high as 1493 mA h g−1, which includes the reduction capacity of SnO2 (eqn (1) and (2), only partially reversible, 711 mA h g−1) and the subsequent alloying capacity of Sn (eqn (3), highly reversible, 782 mA h g−1). However, the main problem faced with SnO2 is the fast pulverization caused by the large volume expansion, which leads to a rapid capacity decay and short cycling life. As demonstrated by many researchers, this problem can be alleviated by rationally designing appropriate nanoarchitectures.3,4 Compared with the bulk counterparts, nanostructures have several advantages for applications in LIBs such as the considerably shortened diffusion paths for Li+, the large contact area between electrolyte and electrode, as well as sufficient free space to relax the strain of lithiation/delithiation.3,4 Therefore, various nanostructures of SnO2, such as ultrathin nanocrystals,5,6 nanorods,7 nanowires,1,8 nanotubes,9 nanosheets,10 hollow spheres,11,12 nanoboxes,13 SnO2 yolk–shell nanospheres,14 as well as SnO2/carbon composites,15–18 have been fabricated to improve the reversible capacity and extend the cycling life. However, it is still challenging to improve the cycling life of pure SnO2 anodes to thousand cycles with satisfactory reversible capacity.
Among various nanostructures, nanomembranes are particularly suitable for applications in electronic and energy devices because of the special electronic structure on the surface.19,20 Nanomembranes have a unique mechanical feature, which enables them to be deformed into various rolled-up, wavy and helical architectures.19,21,22 This special mechanical feature is highly advantageous for their applications in LIBs and especially expected to buffer the strain of lithiation/delithiation against pulverization.23,24 In this contribution, SnO2 nanomembranes have been investigated as anodes for LIBs, which exhibit a long cycling life of 1000 cycles and high rate capability up to 40 A g−1. This work demonstrates the significant potential of the nanomembrane structure for high-performance batteries.
2. Experimental
2.1. Material fabrication
For the fabrication of the material, photoresist AR-P 3510 as sacrificial layer was first spin-coated onto a Si wafer substrate, and then a 40 nm SnO2 film was deposited onto the sacrificial layer by electron-beam (Edwards AUTO50) with a bulk SnO2 source (Kurt J. Lesker) at the depositing rate of 2 Å s−1 in an O2 atmosphere (1.4 × 10⁻⁴ mbar). The thickness of the deposited film was controlled by a quartz crystal microbalance, and the tooling factor was calibrated by depositing a 200 nm film, the actual thickness of which was then measured by a Profilometer Dektak XT (Brucker). The nanomembranes were obtained by selectively removing the underlying sacrificial layer (photoresist) with acetone. The exfoliated nanomembranes were filtered and washed thoroughly with acetone several times, and finally dried in a critical point dryer (CPD).2.2. Material characterization
The morphology of the as-obtained SnO2 nanomembranes was observed by scanning electron microscopy (SEM, DSM 982, Zeiss). The composition was characterized by energy-dispersive X-ray spectroscopy (EDX, Bruker XFlash Detector 4010) together with scanning electron microscopy (SEM, LEO, GEMINI, 1530). Raman spectroscopy (Renishaw) was performed at a 442 nm wavelength to identify the composition and structure. The composition and oxidation state of the element was identified by X-ray photoelectron spectroscopy (SPECS, PHOIBOS 100, Mg-Kα, 12.5 kV, 300 W, 15 eV pass energy).2.3. Electrochemical measurements
Electrochemical measurements were performed with two- electrode Swagelok-type half-cells assembled in an Ar-filled glove box (H2O, O2 < 0.1 ppm, Mbraun, Germany). To prepare the working electrode, SnO2 nanomembranes were ground in mortar with conductive additive carbon black (Timcal) and sodium alginate (Aldrich) binder (7![[thin space (1/6-em)]](https://www.rsc.org/images/entities/char_2009.gif) :2:1 by weight) in water, and then the paste was coated onto a Cu foil (Goodfellow) current collector, and finally dried at 60 °C for 10 h in a vacuum oven. The dried electrode plate was punched into several discs with ϕ = 10 mm for assembly of the cells. The areal density of the active electrode material in the punched electrodes was determined to be about 0.63 mg cm−2. The battery was assembled with a punched electrode disc as the working electrode, a Li foil (ϕ = 10 mm) as the counter/reference electrode, a glass fiber membrane (Whatman) as the separator, and the solution of 1 mol L−1 LiPF6 in ethylene carbonate–dimethyl carbonate–diethyl carbonate (1:1:1, wt%, Merck), including 2 vol.% vinylene carbonate (Merck) additive, as the electrolyte. The galvanostatic discharge/charge cycling was performed with a multichannel battery-testing system (Arbin BT 2000) within 0.01–3.0 V vs. Li/Li+ at different current densities. The cyclic voltammetry (CV) at a scan rate of 0.1 mV s−1 within 0.003–3.0 V vs. Li/Li+, as well as the electrochemical impedance spectroscopy (EIS) within 100 kHz–500 μHz with a perturbation voltage of 10 mV at both a fixed potential of 3.0 V and open circuit potential were performed on a Zahner electrochemical workstation (IM6) at room temperature.
:2:1 by weight) in water, and then the paste was coated onto a Cu foil (Goodfellow) current collector, and finally dried at 60 °C for 10 h in a vacuum oven. The dried electrode plate was punched into several discs with ϕ = 10 mm for assembly of the cells. The areal density of the active electrode material in the punched electrodes was determined to be about 0.63 mg cm−2. The battery was assembled with a punched electrode disc as the working electrode, a Li foil (ϕ = 10 mm) as the counter/reference electrode, a glass fiber membrane (Whatman) as the separator, and the solution of 1 mol L−1 LiPF6 in ethylene carbonate–dimethyl carbonate–diethyl carbonate (1:1:1, wt%, Merck), including 2 vol.% vinylene carbonate (Merck) additive, as the electrolyte. The galvanostatic discharge/charge cycling was performed with a multichannel battery-testing system (Arbin BT 2000) within 0.01–3.0 V vs. Li/Li+ at different current densities. The cyclic voltammetry (CV) at a scan rate of 0.1 mV s−1 within 0.003–3.0 V vs. Li/Li+, as well as the electrochemical impedance spectroscopy (EIS) within 100 kHz–500 μHz with a perturbation voltage of 10 mV at both a fixed potential of 3.0 V and open circuit potential were performed on a Zahner electrochemical workstation (IM6) at room temperature.
3. Results and discussion
3.1. Materials characterization
The amorphous SnO2 nanomembranes were obtained via a sacrificial layer assisted exfoliation strategy, as schematically shown in Fig. 1a. The nanomembranes were exfoliated from the substrate and simultaneously driven to roll up by the released built-in strain while selectively removing the underlying sacrificial layer.21,25 The scanning electron microscopy (SEM) images in Fig. 1b and 1c show the rolled-up tubular morphology of the as-obtained SnO2 nanomembranes. The elemental composition and uniformity were first analyzed by energy-dispersive X-ray (EDX). The element mapping images in Fig. 1e and 1f were taken from the selected area of the single rolled-up nanomembrane in Fig. 1d. These mapping images clearly reveal the element composition of the SnO2 nanomembranes to be Sn and O. The amorphous feature of the SnO2 nanomembranes was determined by X-ray diffraction (XRD) analysis (Fig. S1†). Only one large broad peak can be seen in the pattern, which indicates the amorphous structure.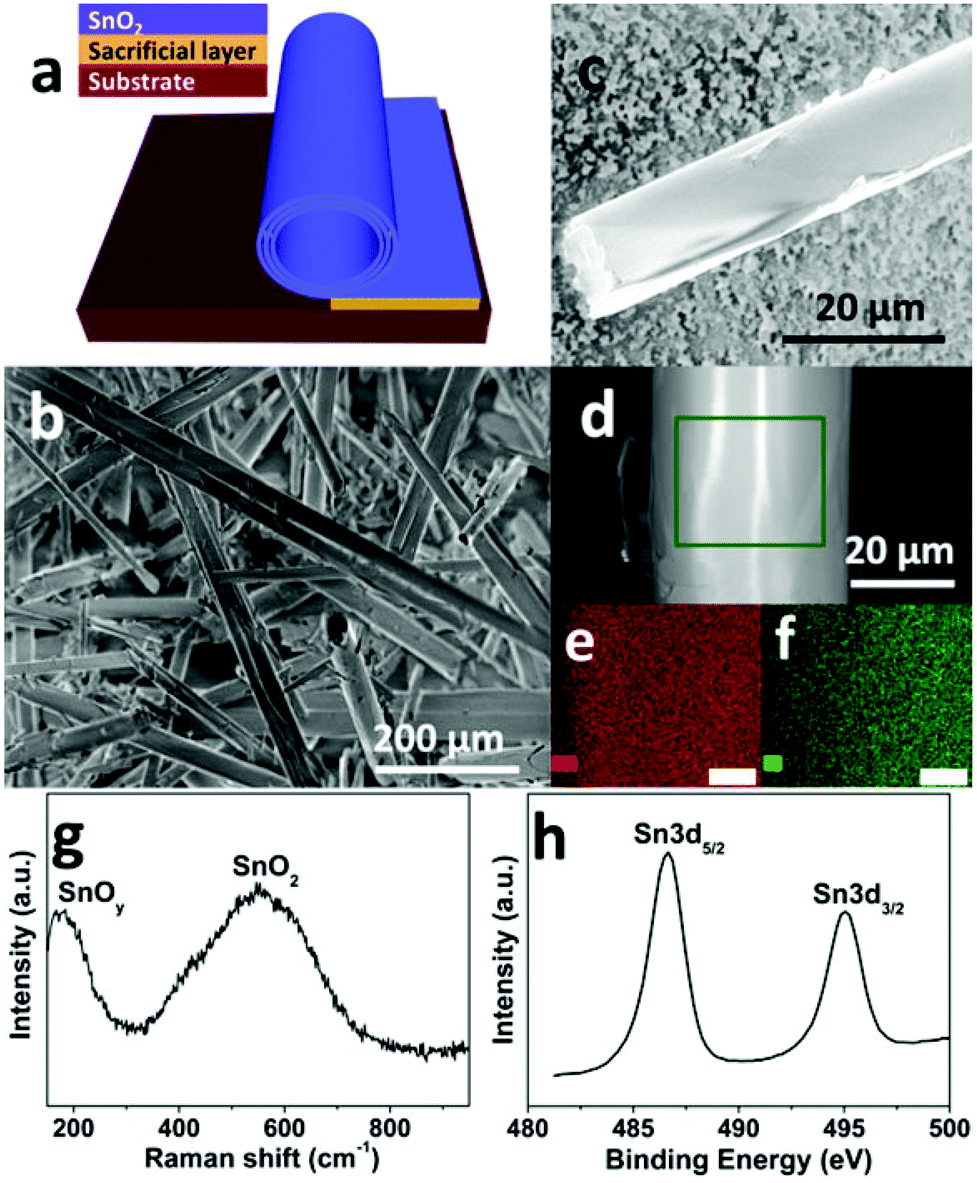 | ||
| Fig. 1 Fabrication and characterizations of the as-obtained SnO2 nanomembranes: (a) fabrication scheme, (b) overall SEM image, (c–d) a single rolled-up nanomembrane, (e) Sn and (f) O element mapping images (scale bar: 6 μm) of the selected area in (d), (g) Raman and (h) Sn 3d XPS spectrum. | ||
Raman spectroscopy was employed to further analyze the composition and structure of the SnO2 nanomembranes. As shown in Fig. 1g, the peak located at ∼170 cm−1 is assigned to the sub-stoichiometric transition oxide SnOy (1 < y < 2) phase with intermediate oxidation.26 The very broad peak in between 400 and 700 cm−1 and centred at ∼550 cm−1 is related to the SnO2 matrix. This broad peak is the typical Raman feature of amorphous SnO2, which is caused by the overlapping of various Raman modes such as the amorphous mode, the surface phonon modes of S1 (∼576 cm−1) and S2 (∼542 cm−1) band for SnO2 with a particle size of about 2–3 nm, and the amorphous tin(IV) hydrous oxide Raman band at 576 cm−1.27,28 The surface composition and element valence state of the SnO2 nanomembranes were determined by X-ray photoelectron spectroscopy (XPS) analysis. The Sn 3d spectrum in Fig. 1h exhibits two peaks at the binding energy of ∼486.6 and ∼495.1 eV with the spin–orbit splitting of 8.4 eV, assigned to the Sn 3d5/2 and 3d3/2 doublet of Sn4+.29 However, the Sn 3d5/2 and 3d3/2 doublet are both slightly asymmetric, which indicates a very small amount of Sn2+ in the SnO2 nanomembrane matrix due to nonstoichiometric oxygen deficiency during e-beam deposition. The XPS analysis agrees well with the results of the Raman characterization.
3.2. Electrochemical performance
The electrochemical properties of the SnO2 nanomembrane electrodes were evaluated by cyclic voltammetry (CV), electrochemical impedance spectra (EIS), and galvanostatic discharge/charge cycling with two-electrode Swagelok-type half-cells. The first three CV curves of the SnO2 nanomembrane electrode are shown in Fig. 2a. In the first cycle, the doublet cathodic peaks at ∼1.26 and ∼1.16 V are caused by the reduction of Sn(IV) to Sn(II) (eqn (1)), and then to Sn nanoparticles (eqn (2)). This phenomenon of cathodic doublet behaviour for the SnO2 electrode was also reported on the nanostructured SnO2 electrode with an extremely small size of the nanoparticle.2 The cathodic doublet behaviour, caused by the small size of the nanoparticle, also agrees well with the abovementioned broad Raman peak, overlapped by the small particle size effect-related surface phonon modes S1 and S2 band. The broad shoulder peak at ∼0.94 V near the doublet is related to the formation of a solid electrolyte interphase (SEI) layer.29 The two broad cathodic peaks at ∼0.44 and ∼0.14 V are assigned to the reversible alloying process of Sn with lithium to form a series of LixSn alloys (eqn (3)),2 which are accompanied by the decomposition of the kinetically activated electrolyte at low voltage to form the polymeric gel-like film.30 The two anodic peaks at ∼0.51 and ∼0.64 V are related to the dealloying process of LixSn to Sn nanoparticles. The other two anodic peaks at ∼1.05 and ∼1.74 V are ascribed to the multistep oxidation of partial Sn to Sn(II) (eqn (4)), and then to Sn(IV) (eqn (5)),31 which is enabled by the ultra-small particle size of SnO2 in the nanomembranes.18 In the subsequent cycles, the reduction peak evolves into one peak at ∼1.35 V, and the oxidation peaks shift to ∼1.16 and ∼1.82 V, whereas the alloying peaks appear as four peaks at about 0.59, 0.51, 0.30, and 0.14 V with reduced intensity, corresponding to the multistep alloying process. The dealloying peaks in the subsequent cycles still maintain the same position as that in the first cycle, indicating the high reversibility of the alloying and dealloying process.| Sn + Li2O → SnO + 2Li+ + 2e− | (4) |
| SnO + Li2O → SnO2 + 2Li+ + 2e− | (5) |
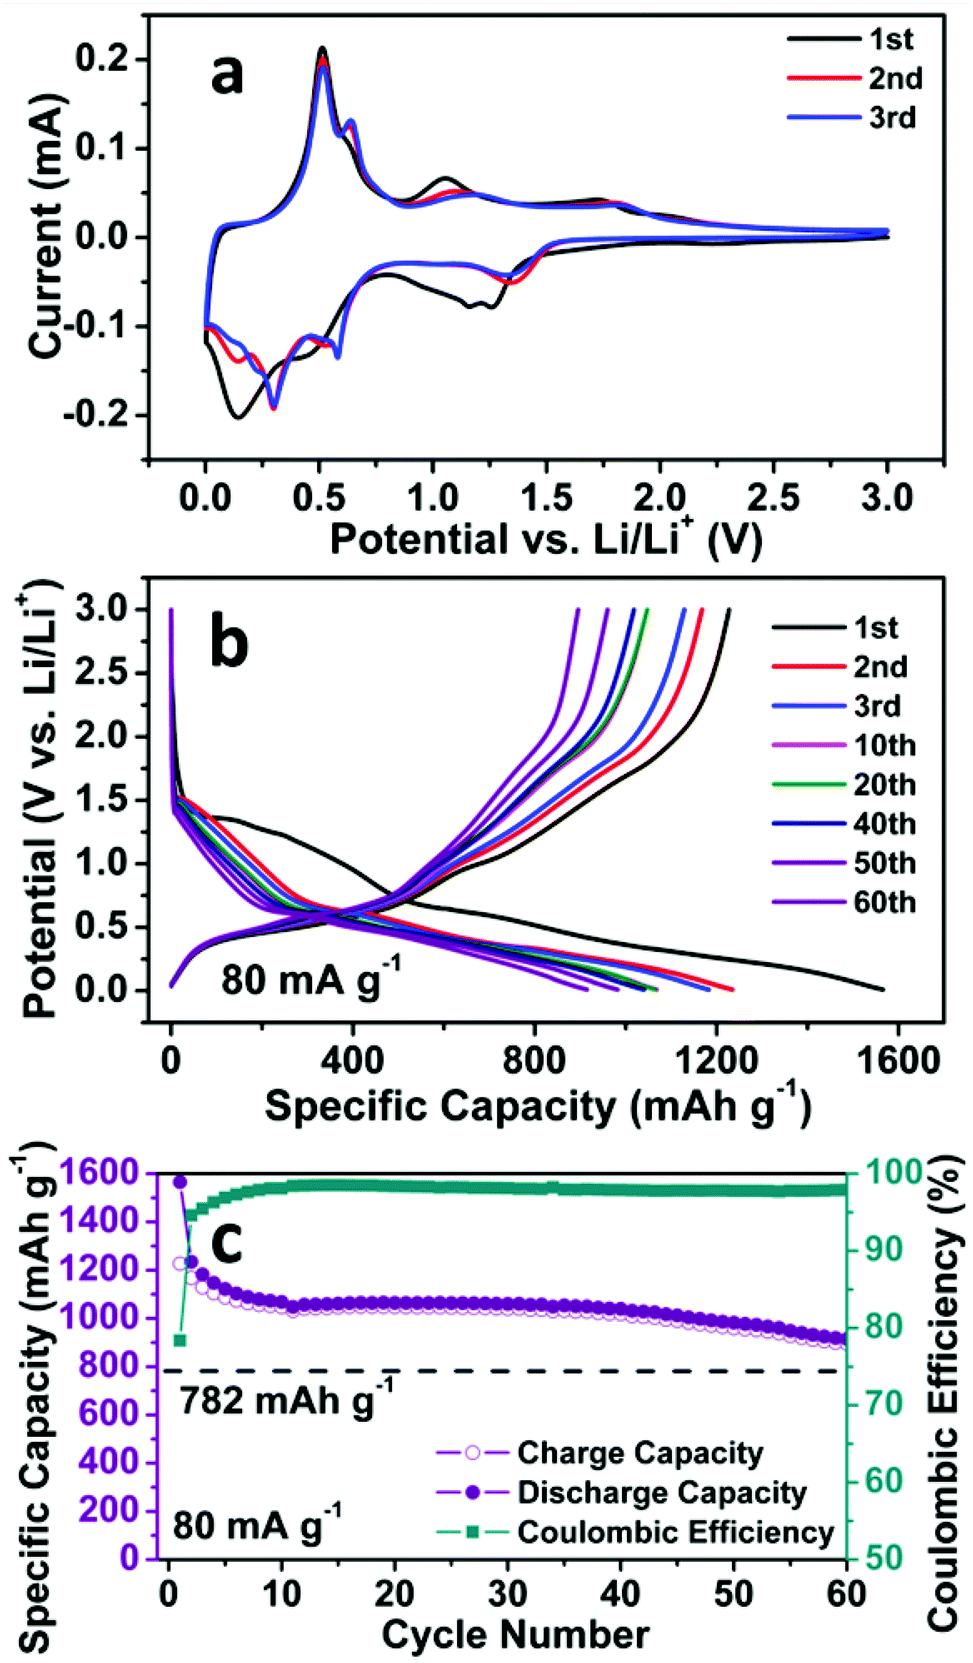 | ||
| Fig. 2 (a) CV curves, (b) Representative discharge/charge voltage curves at 80 mA g−1, and (c) Cycling performance at 80 mA g−1 of the SnO2 nanomembrane electrodes. | ||
The abovementioned electrochemical reaction process can also be confirmed by the galvanostatic discharge/charge voltage curves in Fig. 2b, which is in good agreement with the CV results. In the first cycle, during the discharge process, the two minor quasi-plateaus at ∼1.36 and ∼1.26 V, as well as the following slope, correspond to the reduction of Sn(IV) to Sn(II), then to Sn and the formation of the SEI layer. The slopes below ∼0.65 V are related to the multistep alloying of Sn to LixSn. In the charge process, the quasi-plateau at ∼0.48 V is caused by the dealloying of LixSn to Sn, whereas the slopes at ∼1.01 and ∼1.72 V are ascribed to the oxidation of partial Sn to Sn(II), and then to Sn(IV). The profile of the voltages curves in the two subsequent cycles is almost the same except the shortened reduction slope.
The cycling performance of the SnO2 nanomembrane electrode was first examined at the current density of 80 mA g−1. As shown in Fig. 2c, an initial discharge/charge capacity of 1566/1227 mA h g−1 (coulombic efficiency: 78.3%) is delivered, and then the capacity decreases gradually and maintains a stable cycling with the reversible capacity of ∼1045 mA h g−1. The reversible capacity after 60 cycles is 895 mA h g−1 (coulombic efficiency: 97.9%), which exceeds the theoretical capacity of 782 mA h g−1 based on eqn (3). This confirms that the reduction/oxidation reaction between Sn(IV) and Sn(0) is partially reversible and also contributes to the capacity. Fig. 2b shows the corresponding representative discharge/charge voltage curves at 80 mA g−1. It can be seen that the capacity decay occurs in the reduction/oxidation stage and the alloying/dealloying process as a result of the difficult solid state diffusion inside the electrode material with thicker SEI upon further cycling.
Fig. 3a shows the cycling performance of the SnO2 nanomembrane electrode at an even higher current density of 1600 mA g−1. The initial discharge/charge capacity is 1440/1137 mA h g−1 with the coulombic efficiency of 79%. The capacity decreases slightly till the 323th cycle with the reversible capacity of 611 mA h g−1. As shown in Fig. 3b, during this period, the slopes for the reduction/oxidation reaction in the discharge/charge voltage curves gradually become considerably unclear due to the difficult solid-state diffusion caused by the thick SEI layer. Later, the capacity increases gradually and maintains a stable cycling from about 600 cycles to 1000 cycles with the reversible capacity of about 880 ± 40 mA h g−1. After 1000 cycles, the reversible capacity is 854 mA h g−1 and is still higher than 782 mA h g−1. The voltage curves in Fig. 3c reveal that the capacity increases mainly in the low-voltage region (<0.5 V) together with a slight increase in the reduction/oxidation part. The increase in capacity should be caused by the cracking of nanomembranes upon considerably long cycling and new interfaces being exposed for storage. Moreover, the pseudo-capacitive type storage also contributes to the capacity for extending the cycling life. The electrochemical impedance spectroscopy (EIS) was performed to analyze the SnO2 nanomembrane electrode before and after cycling at 1600 mA g−1, and the obtained Nyquist plots are shown in Fig. 3d and 3e. In the high-frequency region, the significantly decreased diameter of the plot semicircle after cycling than that before cycling indicates the reduced charge transfer resistance.32 In the very low frequency region (Fig. 3e), the steeper slope of the fitting plots obtained at open circuit potential (OCP) after cycling than that before cycling indicates the more obvious pseudo-capacitive behaviour of the electrode, especially from the incompletely decomposed polymeric gel-like film at a fast cycling rate.30,33
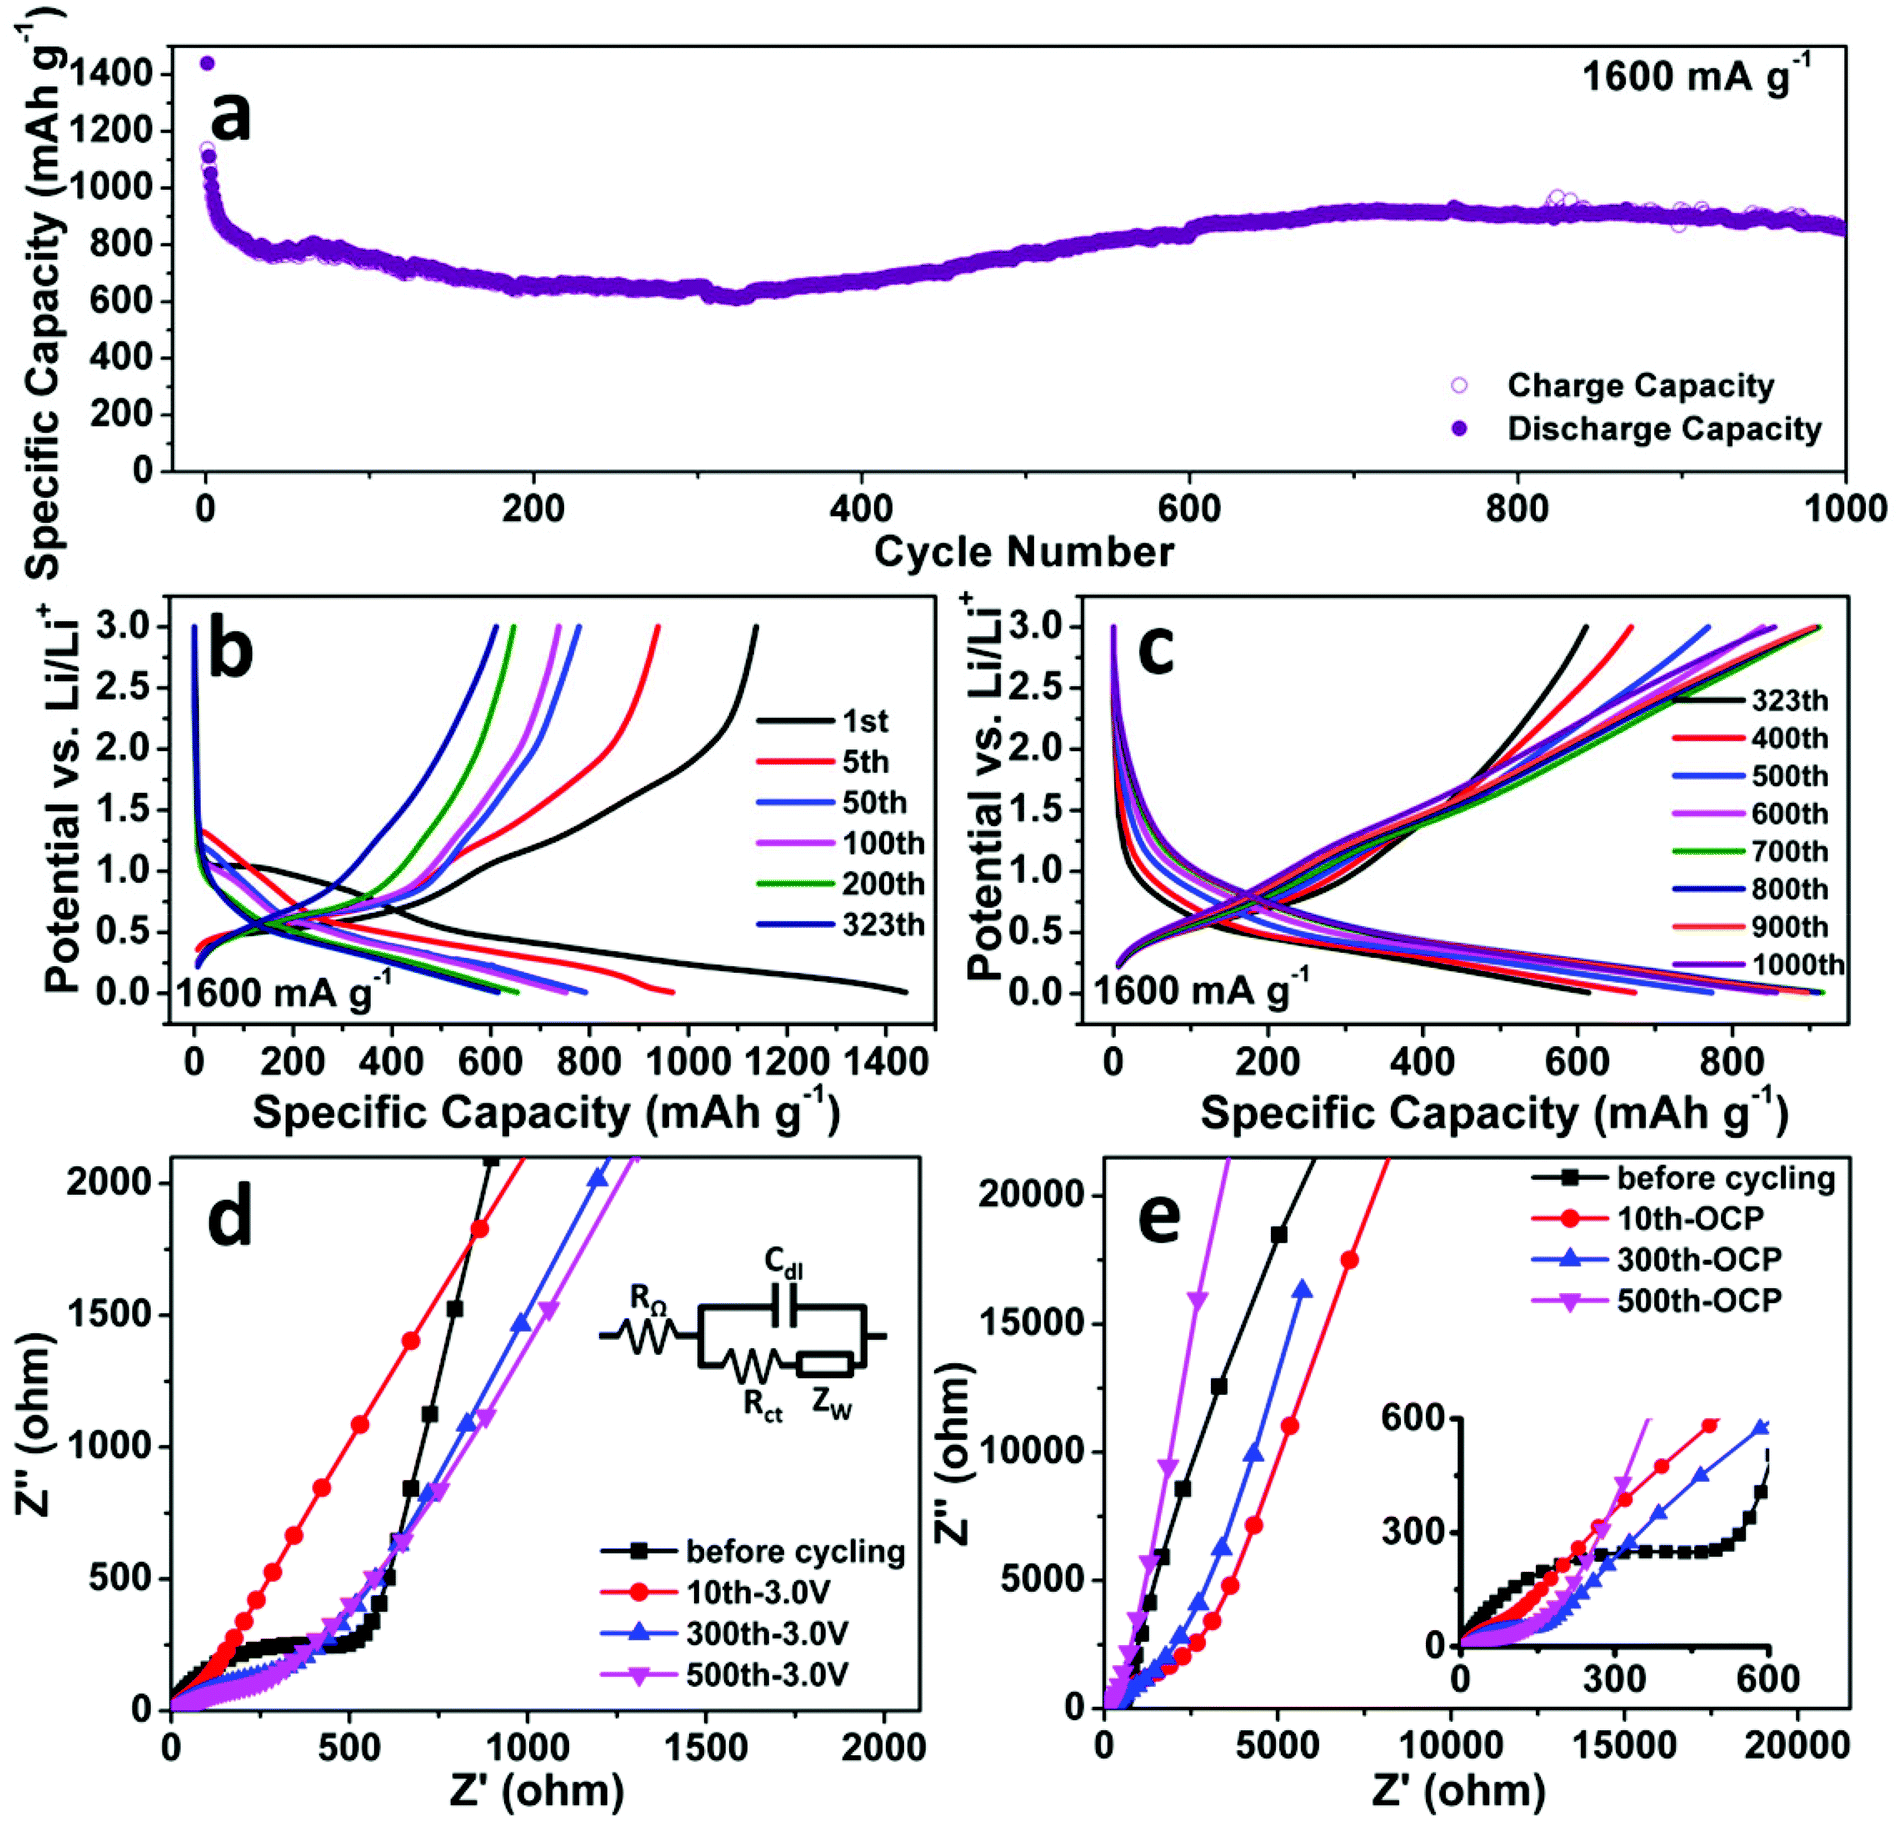 | ||
| Fig. 3 (a) Cycling performance; (b) and (c) representative discharge/charge voltage curves of the SnO2 nanomembrane electrode at 1600 mA g−1. Nyquist plots of EIS (symbols: real data, lines: fitting plots) measured before and after cycling at 1600 mA g−1 within 105–5 × 10⁻⁴ Hz at (d) fixed potential of 3.0 V and (e) OCP with a perturbation voltage of 10 mV. Inset of (d) is the simplified electrochemical system as Randles circuit (RΩ: ohmic resistance, Cdl: double-layer capacitance, Rct: charge transfer resistance, and ZW: Warburg impedance). | ||
The rate capability of the SnO2 nanomembrane electrode was measured with a stepwise current density discharge/charge program from 0.16 A g−1 to 40 A g−1. As shown in Fig. 4a, the rate capability measurement starts after the initial cycling for 30 cycles at 0.16 A g−1, and the capacity decreases gradually with an increase in the current density. The reversible capacity of the last cycle at 0.16, 0.4, 0.8, 1.6, 4, 8, 16, and 40 A g−1 is 839 (the 30th cycle), 775, 719, 663, 578, 485, 351, and 149 mA h g−1, respectively. The reversible capacity at the high rate of 16 A g−1 is 351 mA h g−1, which is almost close to the theoretical capacity of graphite. When the current rate is dramatically set back to 0.16 A g−1 from the high rate of 40 A g−1, there is no obvious capacity decrease with the reversible capacity of 688 mA h g−1 after 125 cycles. Fig. 4b exhibits the corresponding representative discharge/charge voltage curves of the last cycle at each current rate. The gradually shortened slopes reflect the decreased contribution of the reduction/oxidation reaction and the alloying/dealloying process to the capacity. Due to the difficult solid-state diffusion of Li+ inside the electrode material at higher current rate, the interfacial storage, especially the pseudo-capacitive type storage, becomes more obvious to maintain the capacity at high rate.34
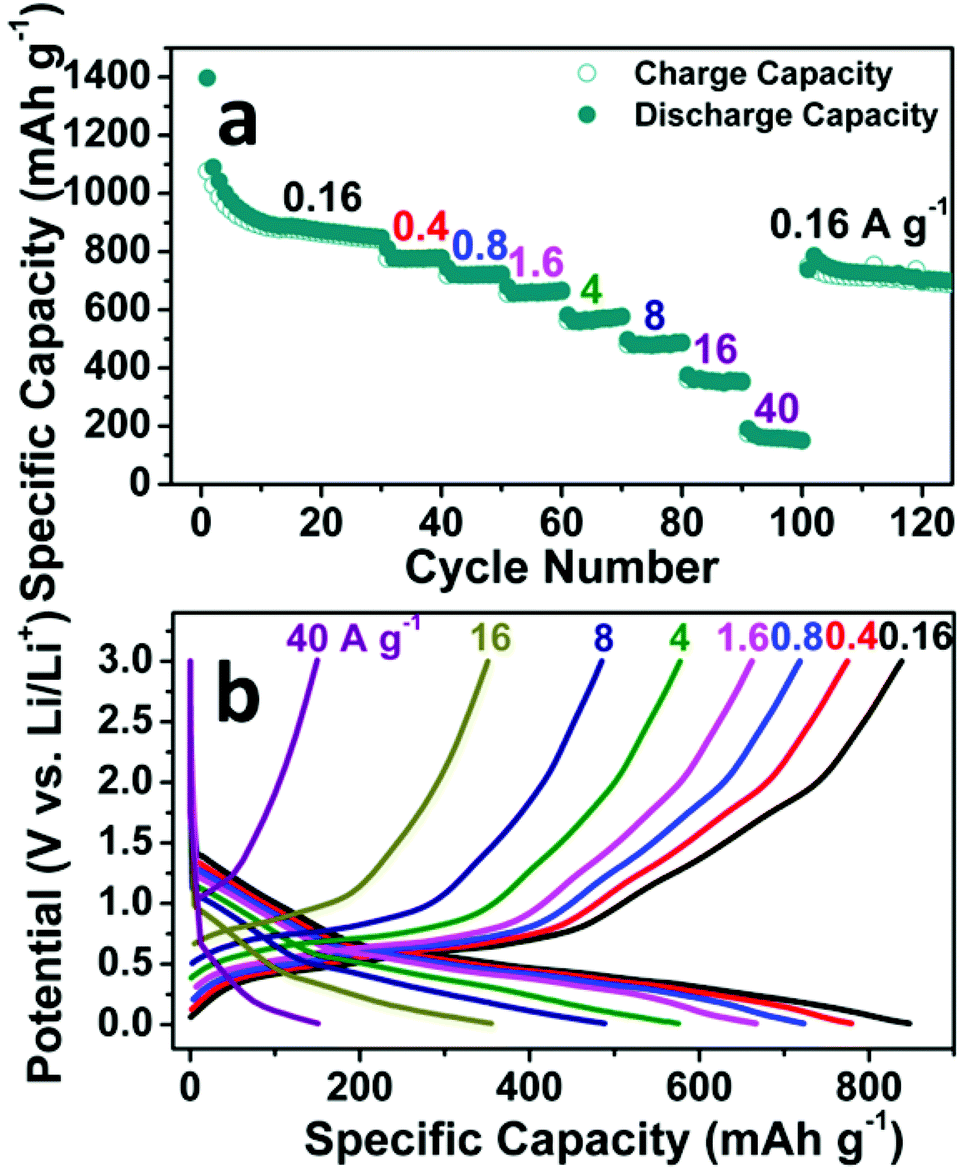 | ||
| Fig. 4 Rate capability of the SnO2 nanomembrane electrode: (a) Rate cycling performance, (b) Representative discharge/charge voltage curves at various current rates. | ||
The comparison of the electrochemical performance of the SnO2 nanomembrane anode with other SnO2 based anodes is summarized in Table S1.† The long cycling life of 1000 cycles with the reversible capacity of 854 mA h g−1 at 1600 mA g−1 and high rate capability up to 40 A g−1 is significantly improved than most of the pure SnO2 anodes, and almost comparable with some ultra-small sized SnO2/carbon composite anodes. Such excellent performance is believed to result from the structural advantages of amorphous nanomembranes. Firstly, the nanoscale thickness can facilitate the kinetics with short diffusion paths for Li+. Secondly, according to some reports,33,35,36 the amorphous structure is more effective than the crystalline structure to accommodate the strain of lithiation/delithiation, especially during initial lithiation. Therefore, the SnO2 nanomembrane electrodes have high initial coulombic efficiency. More importantly, the unique mechanical feature enables the nanomembranes to buffer the strain during cycling by deforming and wrinkling, thus delaying pulverization and extending the cycling life. This is confirmed by the SEM images of the nanomembranes before and after cycling at 1600 mA g−1. Before cycling (Fig. 5a), all the nanomembranes in the SnO2 nanomembrane electrode are parallel stacked with planar layer structure. After the first cycle (Fig. 5b), the nanomembranes become thicker with the SEI layer but still maintain the relative planar shape. After 100 cycles, the nanomembranes in the electrodes with (Fig. 5c) and without (Fig. 5d) carbon black become considerably wrinkled which is caused by the strain during repeated lithiation/delithiation; however, they still maintain the layer structure with high integrity. Even after 300 cycles (Fig. 5e), the wrinkled nanomembranes still maintain the layer morphology with thicker SEI layer, confirming the good mechanical feature to buffer the strain. After 900 cycles (Fig. 5f), some of the severely wrinkled nanomembranes become cracked with new interfaces exposed for storage, which explains the capacity increasing from ∼300 cycles to ∼600 cycles. However, further severe cracking will lead to the pulverization of the nanomembranes, which should be the reason for the decrease from ∼900 cycles to 1000 cycles. In addition, the nanomembranes can provide two-dimensional transport paths in between layers and make the pseudo-capacitance more evident, especially at high rate.
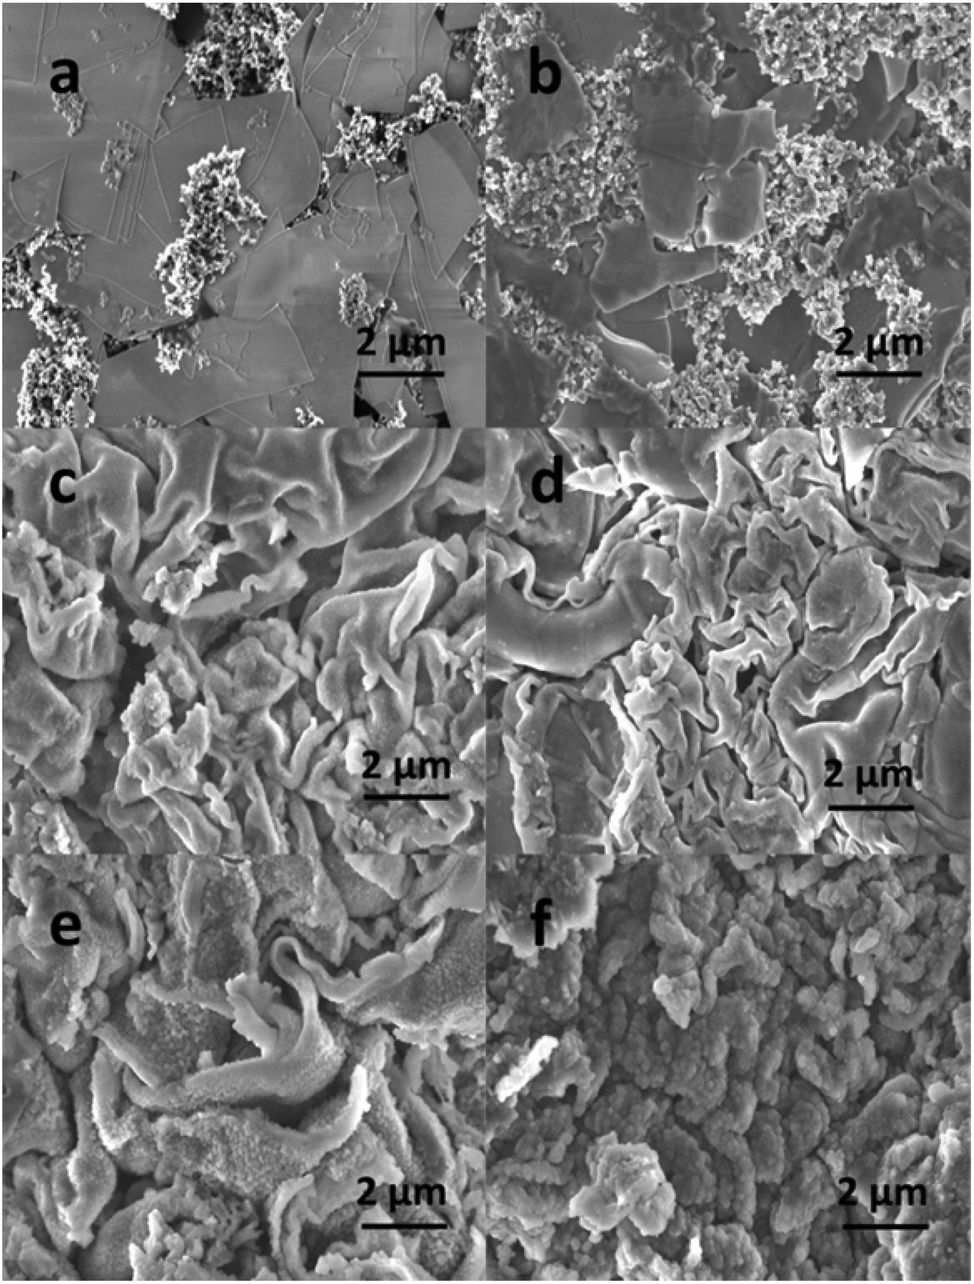 | ||
| Fig. 5 SEM images of the SnO2 nanomembrane electrodes: (a) before cycling, (b) after the 1st cycle, (c) and (d) after 100 cycles ((d): without carbon black), (e) after 300 cycles and (f) 900 cycles at 1600 mA g−1. | ||
4. Conclusions
The amorphous SnO2 nanomembranes as anodes for LIBs demonstrate a long cycling life of 1000 cycles at 1600 mA g−1 with a high reversible capacity of 854 mA h g−1 and high rate capability up to 40 A g−1. The excellent performance results from the structural advantages of the amorphous nanomembranes, such as the nanoscale diffusion paths for Li+, the amorphous structure and the mechanical feature to buffer the strain, and the two-dimensional transport pathways in between nanomembranes to promote the pseudo-capacitance. The positive results demonstrate the structural advantages of nanomembranes in improving the battery performance.Acknowledgements
This work was financially supported by the International Research Training Group (IRTG) project “Rolled-up nanotech for on-chip energy storage, G9” and the PAKT project “Electrochemical energy storage in autonomous systems, no. 49004401.” C. Yan acknowledges the support from the “Thousand Talents Program,” the Natural Science Foundation of Jiangsu Province of China (no. BK20140315) and the National Natural Science Foundation of China (no. 51402202).Notes and references
- P. Meduri, C. Pendyala, V. Kumar, G. U. Sumanasekera and M. K. Sunkara, Nano Lett., 2009, 9, 612–616 CrossRef CAS PubMed
.
- N. C. Li and C. R. Martin, J. Electrochem. Soc., 2001, 148, A164–A170 CrossRef CAS PubMed
- P. G. Bruce, B. Scrosati and J. M. Tarascon, Angew. Chem., Int. Ed., 2008, 47, 2930–2946 CrossRef CAS PubMed
- A. S. Arico, P. Bruce, B. Scrosati, J. M. Tarascon and W. Van Schalkwijk, Nat. Mater., 2005, 4, 366–377 CrossRef CAS PubMed
- L. Ding, S. He, S. Miao, M. R. Jorgensen, S. Leubner, C. Yan, S. G. Hickey, A. Eychmüller, J. Xu and O. G. Schmidt, Sci. Rep., 2014, 4, 4647 Search PubMed
- Y. Chen, J. Ma, Q. Li and T. Wang, Nanoscale, 2013, 5, 3262–3265 RSC
- C. Xu, J. Sun and L. Gao, J. Mater. Chem., 2012, 22, 975–979 RSC
- M. S. Park, G. X. Wang, Y. M. Kang, D. Wexler, S. X. Dou and H. K. Liu, Angew. Chem., Int. Ed., 2007, 46, 750–753 CrossRef CAS PubMed
- L. Li, X. Yin, S. Liu, Y. Wang, L. Chen and T. Wang, Electrochem. Commun., 2010, 12, 1383–1386 CrossRef CAS PubMed
- C. Wang, Y. Zhou, M. Y. Ge, X. B. Xu, Z. L. Zhang and J. Z. Jiang, J. Am. Chem. Soc., 2010, 132, 46–47 CrossRef CAS PubMed
- Y.-L. Ding, Y. Wen, P. A. van Aken, J. Maier and Y. Yu, Nanoscale, 2014, 6, 11411–11418 RSC
- S. Ding and X. Lou, Nanoscale, 2011, 3, 3586–3588 RSC
- Z. Y. Wang, D. Y. Luan, F. Y. C. Boey and X. W. Lou, J. Am. Chem. Soc., 2011, 133, 4738–4741 CrossRef CAS PubMed
- Y. J. Hong, M. Y. Son and Y. C. Kang, Adv. Mater., 2013, 25, 2279–2283 CrossRef CAS PubMed
- X. Liu, J. Cheng, W. Li, X. Zhong, Z. Yang, L. Gu and Y. Yu, Nanoscale, 2014, 6, 7817–7822 RSC
- A. Jahel, C. M. Ghimbeu, L. Monconduit and C. Vix-Guterl, Adv. Energy Mater., 2014, 4 DOI:10.1002/aenm.201400025
- D. Wang, J. Yang, X. Li, D. Geng, R. Li, M. Cai, T.-K. Sham and X. Sun, Energy Environ. Sci., 2013, 6, 2900–2906 CAS
- Y. Chen, B. Song, R. M. Chen, L. Lu and J. Xue, J. Mater. Chem. A, 2014, 2, 5688–5695 CAS
- J. A. Rogers, M. G. Lagally and R. G. Nuzzo, Nature, 2011, 477, 45–53 CrossRef CAS PubMed
- C. C. B. Bufon, J. D. C. Gonzalez, D. J. Thurmer, D. Grimm, M. Bauer and O. G. Schmidt, Nano Lett., 2010, 10, 2506–2510 CrossRef PubMed
- O. G. Schmidt and K. Eberl, Nature, 2001, 410, 168–168 CrossRef CAS PubMed
- D. H. Kim and J. A. Rogers, ACS Nano, 2009, 3, 498–501 CrossRef CAS PubMed
- J. Deng, H. Ji, C. Yan, J. Zhang, W. Si, S. Baunack, S. Oswald, Y. Mei and O. G. Schmidt, Angew. Chem., Int. Ed., 2013, 52, 2326–2330 CrossRef CAS PubMed
- L. Zhang, J. Deng, L. Liu, W. Si, S. Oswald, L. Xi, M. Kundu, G. Ma, T. Gemming, S. Baunack, F. Ding, C. Yan and O. G. Schmidt, Adv. Mater., 2014, 26, 4527–4532 CrossRef CAS PubMed
- H.-X. Ji, X.-L. Wu, L.-Z. Fan, C. Krien, I. Fiering, Y.-G. Guo, Y. Mei and O. G. Schmidt, Adv. Mater., 2010, 22, 4591–4595 CrossRef CAS PubMed
- K. McGuire, Z. W. Pan, Z. L. Wang, D. Milkie, J. Menendez and A. M. Rao, J. Nanosci. Nanotechnol., 2002, 2, 499–502 CrossRef CAS PubMed
- A. Dieguez, A. Romano-Rodriguez, A. Vila and J. R. Morante, J. Appl. Phys., 2001, 90, 1550–1557 CrossRef CAS PubMed
- K. Vijayarangamuthu and S. Rath, J. Alloys Compd., 2014, 610, 706–712 CrossRef CAS PubMed
- J. W. Deng, C. L. Yan, L. C. Yang, S. Baunack, S. Oswald, H. Wendrock, Y. F. Mei and O. G. Schmidt, ACS Nano, 2013, 7, 6948–6954 CrossRef CAS PubMed
- S. Laruelle, S. Grugeon, P. Poizot, M. Dolle, L. Dupont and J. M. Tarascon, J. Electrochem. Soc., 2002, 149, A627–A634 CrossRef CAS PubMed
- V. Aravindan, K. B. Jinesh, R. R. Prabhakar, V. S. Kale and S. Madhavi, Nano Energy, 2013, 2, 720–725 CrossRef CAS PubMed
- Y. M. Lin, P. R. Abel, A. Heller and C. B. Mullins, J. Phys. Chem. Lett., 2011, 2, 2885–2891 CrossRef CAS
- Y. Jiang, D. Zhang, Y. Li, T. Yuan, N. Bahlawane, C. Liang, W. Sun, Y. Lu and M. Yan, Nano Energy, 2014, 4, 23–30 CrossRef CAS PubMed
- V. Augustyn, J. Come, M. A. Lowe, J. W. Kim, P.-L. Taberna, S. H. Tolbert, H. D. Abruña, P. Simon and B. Dunn, Nat. Mater., 2013, 12, 518–522 CrossRef CAS PubMed
- X. F. Li, X. B. Meng, J. Liu, D. S. Geng, Y. Zhang, M. N. Banis, Y. L. Li, J. L. Yang, R. Y. Li, X. L. Sun, M. Cai and M. W. Verbrugge, Adv. Funct. Mater., 2012, 22, 1647–1654 CrossRef CAS
- X.-L. Wang, W.-Q. Han, H. Chen, J. Bai, T. A. Tyson, X.-Q. Yu, X.-J. Wang and X.-Q. Yang, J. Am. Chem. Soc., 2011, 133, 20692–20695 CrossRef CAS PubMed
Footnote |
| † Electronic supplementary information (ESI) available. See DOI: 10.1039/c4nr04903a |
| This journal is © The Royal Society of Chemistry 2015 |