Hierarchical TiO2 spherical nanostructures with tunable pore size, pore volume, and specific surface area: facile preparation and high-photocatalytic performance
Baoshun
Liu
a,
Kazuya
Nakata
*abc,
Munetoshi
Sakai
ab,
Hidenori
Saito
a,
Tsuyoshi
Ochiai
ab,
Taketoshi
Murakami
a,
Katsuhiko
Takagi
b and
Akira
Fujishima
*abc
aPhotocatalyst Group, Kanagawa Academy of Science and Technology, KSP Building East 412, 3-2-1 Sakado, Takatsu-ku, Kawasaki, Kanagawa 213-0012, Japan. E-mail: pg-nakata@newkast.or.jp
bOrganic Solar Cell Assessment Project, Kanagawa Academy of Science and Technology, KSP Building East 308, 3-2-1 Sakado, Takatsu-ku, Kawasaki, Kanagawa 213-0012, Japan
cResearch Institute for Science and Technology, Energy and Environment Photocatalyst Research Division, Tokyo University of Science, 1-3 Kagurazaka, Shinjuku-ku, Tokyo 162-8601, Japan. E-mail: president@admin.tus.ac.jp
First published on 31st May 2012
Abstract
Anatase TiO2 hierarchical nanostructural microspheres with tunable pore size, pore volume, and specific surface area were prepared by a facile two-step method of electrospray and hydrothermal treatment. Compared to the calcination, the hydrothermal treatment can transfer the electrosprayed TiO2 microspheres to porous hierarchical nanostructures. Adding ammonia in the hydrothermal process has a great effect on the pore structure of TiO2 microspheres. The hydrothermal-treated samples with >2.0 ml ammonia being added are composed of both big and small nanocrystals. Some of the large nanocrystals grow in the [001] direction and contain step-like {101} surfaces. The large nanoparticles are formed through the combination of small particles by dehydration, which finally leads to the change of TiO2 microspheres from mesoporous to large-porous structure. The effects of the specific surface area, the pore volume, and the pore size on the photocatalytic activity are studied. It is considered that the pores on the surface layer of TiO2 microspheres are like a door that can control the diffusion of reactants between the outside and the inside. If the size of pores on the surface is big enough to allow the fast diffusion of reactants, the photocatalytic activity will increase with the increase of specific surface area and pore volume. In addition, further calcination on the TiO2 spheres after hydrothermal treatment can increase the photocatalytic activity, which is better than the commercial P25.
Introduction
Nowadays, photocatalysis still draws increasing significant attention since its first publication in 19721 due to its attractive applications in environmental cleaning and energy conversion.2–5 Many factors, including crystalline phase, exposed surface facets, particle size, surface area, and pore structure, have important effects on the photocatalytic activity.6–9 The preparation of high-active photocatalysts is still the focus of photocatalytic studies by adjusting these factors. Among many materials, TiO2 is still one of the most studied because of its advantages of low-cost, non-toxicity, high activity, and long durability. In addition, TiO2 can also be used in dye sensitized solar cells (DSSCs) and lithium ion batteries, as a functional material.10–16Recently, the construction of TiO2 hierarchical materials with different morphologies has attracted much attention world-wide. It is reported that some new effects of the TiO2 nanostructures, for example multi-light scattering, can increase the photocatalytic activity to some extent.17 Up to now, many TiO2 nanostructural materials have been fabricated, such as TiO2 fibres, TiO2 tubes, TiO2 spheres, TiO2 arrays, and TiO2 mesoporous films.18–23 The TiO2 nanostructural spheres are one of the most studied due to their interesting structures and good properties.24–29 Many methods, for example the hydrolysis of glycolate titanium spheres, the hydrothermal treatment of sol–gel induced TiO2 spheres, the template-free hydrothermal process, and the chemical-induced self-transmutation method, can be used to make TiO2 spheres.30–34 In addition to the morphologies, the specific surface area (SBET) and pore structure are also the important features, which sometimes are decisive for photocatalytic applications. Thus, the fabrication of TiO2 spheres with high SBET and suitable pore structure is crucial in photocatalysis.16,24,29,30 The development of a simple, low-cost, easily-controlled method to make this material is still attractive for both material preparation and application.
In this research, we report a facile two-step method to make microspherical hierarchical TiO2 materials by combining the methods of electrospray and hydrothermal reactions. The SBET, the pore size, and the pore volume can be tuned by changing the ammonia amount used in the hydrothermal treatment. The effect of SBET, pore volume, and pore size on the photocatalytic activity is investigated. It is considered that the pores on the surface of TiO2 spheres are found to be important in photocatalysis because they can control the diffusion of reactants from the outside to the inside of TiO2 spheres. If the pores on the surface are big enough to allow the fast transport of reactants, the photocatalytic activity will increase with the increase of SBET and pore volume. In addition, the effect of hydrothermal time on the pore structures of the TiO2 spheres is also studied to understand the pore formation, and the effect of post-heat treatment is also studied.
Experimental section
Material preparation
0.3 g polyvinyl pyrrolidone (PVP) K30 was dissolved in 2.5 ml ethanol and 3.8 ml acetic acid while stirring. 10 minutes later, 7.0 ml titanium butoxide (TBT) monomer was added. The PVP–TBT solution was kept stirring for 1 h to form a uniform yellow sol. This sol was loaded in a syringe pump to be pumped through a small metal needle in 1.0 ml h−1 (23 G needle, □ = 0.33 mm). An aluminium target was placed ca. 35 cm under the metal needle to collect the electrosprayed (ES) materials. A 35 kV high-voltage was applied between the metal needle and the aluminium target to start the electrospray process. Several hours later, the ES materials were collected and dried in air overnight. 0.2 g ES powders were mixed with 10 ml water and 20 ml ethanol. After about 10 min stirring, different amounts of ammonia (0–4.0 ml) were added and then put in an autoclave to undergo a hydrothermal treatment at 160 °C for 24 h.Characterization
Powder X-ray diffraction (type: RINT-1500) was used to check the crystalline phase and calculate the size of nanocrystals on the TiO2 spheres after hydrothermal treatment. The material morphologies were observed using a field emission scanning electron microscope (FE-SEM, type: Hitachi S-4800). A field emission transmittance electron microscope (FE-TEM, type: EM002BF) was used to see the morphologies and size of the nanoparticles in the TiO2 spheres. N2 absorption isotherms were measured at −196 °C by using a Micromeritics system. Prior to the measurement, the samples were firstly degassed at 200 °C on a vacuum line for 1 hour. The multipoint Brunauer–Emmett–Teller (BET) was used to calculate the SBET using the absorption data. The pore size distributions were derived from the adsorption data of isotherms based on a Barrett–Joyner–Halenda (BJH) model. The pore volumes were calculated by summing from 2 nm to 100 nm. The cross-sectional morphologies were observed using a FIB-SEM-Ar ion milling equipment (type: Xvision 200TB) to check the inner structures of TiO2 spheres. The infrared absorption spectra were measured using a FTIR spectrometer (type: JASCO FT/IR-6100) to check the surface capping groups of TiO2 nanoparticles.Photocatalytic performances
(1) 0.03 g of samples were mixed with ethanol and ultrasonically dispersed in glass containers (ϕ = 90 mm) for 30 min (SEM checking shows that the TiO2 spheres are too strong to be broken by ultrasonics). The ethanol was removed by drying at 60 °C to form a thin coating of TiO2 spheres on the bottom of the glass containers. Afterwards, 30 ml 2.0 × 10⁻⁵ mol L−1 methylene blue (MB) water solution was injected, and a highly UV transparent 100 mm × 100 mm quartz glass was put on top of the glass containers to prevent evaporation. Firstly, the MB solution was kept in the dark for 80 min. The absorption spectra of the MB solution were checked using a UV-Vis spectrometer (type: Shimadzu UV-1700) to confirm the dark absorption–desorption equilibrium. After the photocatalysis starts (365 nm, 2.0 mW cm−2), the absorption of the MB solution was measured every 20 min.(2) The hydrothermal-treated TiO2 spheres were annealed at 500 °C in air for 2 h, and then the photocatalytic experiments were checked according to the procedure in (1).
(3)The hydrothermal-treated TiO2 spheres were dispersed in glass containers (ϕ = 90 mm) by ultrasonic dispersion, and then 20 ml deionization water was injected. The container was put under a UV lamp (2.0 mW cm−2, 365 nm) to undergo 2 h UV irradiation treatment to remove the surface contaminants. Afterwards, the water was removed and the sample was dried at 60 °C. The photocatalytic experiments were conducted according to (1).
In the case of a photocatalytic reaction with low concentration, the reaction rate equation can be expressed as ln(C0/C) = kt, where C0 is the initial concentration of MB, and C is the reaction concentration. The apparent rate constant k is used to evaluate the photocatalytic activity.
Results and discussion
TiO2 spheres after hydrothermal treatment
The ES materials consist of poly-dispersed spheres of several ten nm to several μm. The as-ES sample also has a dense shell-porous core structure, as reported in our previous reports.35Fig. 1 shows FE-SEM photos of the hydrothermal-treated TiO2 microspheres in water and ethanol with different amounts of ammonia being added. It can be seen that the hydrothermal treatment can transfer the TiO2 spheres to porous hierarchical nanostructures. If ammonia is not used, the TiO2 spheres are composed of many small nanoparticles. The surface layer is dense and contains many small pores (The FE-SEM photo is not shown, please check our previous research35). As ammonia was used, the sphere structure changes greatly. It was shown that using acetic acid in the hydrothermal reaction has no obvious effect on the sphere morphologies.35 The nanoparticles on TiO2 spheres become big as ammonia was used (Fig. 1(A)). If 2.0 ml ammonia is used, the TiO2 spheres show nanostructures of different morphologies, which consist of both big and small nanoparticles (Fig. 1(B–D)). The co-existence of big and small nanoparticles constructs an interconnected porous network in TiO2 spheres. The big nanoparticles are mainly long irregular nano-sheets. As labelled in Fig. 1 (B-2), some nanoparticles of closed polygons can also be seen. Although it seems that the TiO2 spheres become loose as the ammonia amount increases, even the TiO2 spheres of 4.0 ml ammonia are still stable to undergo several hour's ultrasonic dispersion because the nanoparticles are intercrossed together.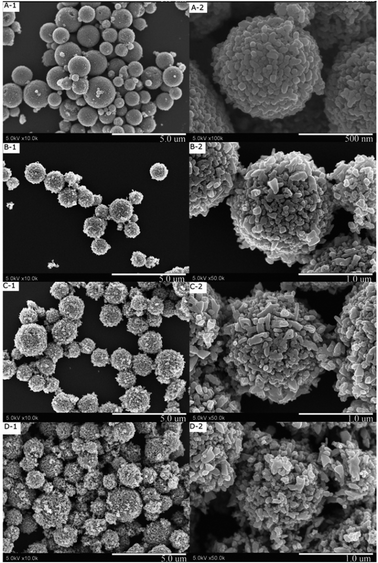 | ||
| Fig. 1 FE-SEM photos of the TiO2 spheres after hydrothermal treatment with different amounts of ammonia being used (A: 0.5 ml ammonia, B: 2.0 ml ammonia, C: 3.0 ml ammonia, D: 4.0 ml ammonia.) | ||
The inner structures of the TiO2 spheres are observed using a SEM probe on a FIB-SEM-Ar ions mining equipment. One TiO2 sphere was chosen and cut by focused Ar ions until a half is left. The cross-sectional photos are taken. Fig. 2 shows the SEM photo of a hydrothermal-treated TiO2 sphere when 2.0 ml ammonia was used. The cross-sectional SEM photo of the sphere without using ammonia was shown in a previous study.35 It can be seen that adding 2.0 ml ammonia makes the inner structure of TiO2 spheres very different. The pores become large and the small pores almost disappear. Moreover, the core and the shell combine together due to nanoparticle growth. Despite using ammonia or not, the hydrothermal treatment of ES TiO2 spheres results in the formation of nanostructures with interconnected pore networks, which can be useful materials in many photoelectrochemical applications.
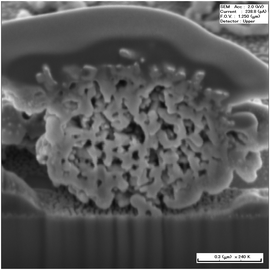 | ||
| Fig. 2 Cross-sectional SEM photo of the TiO2 sphere after hydrothermal post-treatment with 2.0 ml ammonia being used. | ||
The above analysis shows that the materials consist of many TiO2 nanoparticles of different sizes and shapes, which changes the morphologies of TiO2 spheres greatly. TEM is used to check the nanoparticle morphologies. The TiO2 spheres were grinded in ethanol solution for several hours, and then were ultrasonically dispersed. If no ammonia is used, the nanoparticles are uniform and smaller than 10 nm (Fig. 3 (A-1)). The high-magnified TEM photo in Fig. 3 (A-2) shows that the nanoparticle has three sets of lattice fringes, corresponding to the (101), (-101), and (002) facets of anatase, indicating that these crystals lie in the (010) direction. Although the nanoparticles are irregular, they still contain two exposed high-energy facets of {001} and {010}. As 2.0 ml ammonia was used, the spheres are composed of small and big particles. The high-magnified photo (Fig. 3 (B-2)) shows that the big nanoparticle also has three crystal facets of (101), (−101), and (002) of anatase, with the whole particle lying along (010) planes. This large nanoparticle grows in the [001] (c axis) direction and forms a long crystal (Fig. 3 (B-1)). Interestingly, it is also seen that the long nanoparticle contains step-like {101} facets composed of (101) and (−101) facets. It is considered that this step-like {101} surface is formed during nanoparticle growth along the c axis. The step-like surface may be more active because they contain more surface defects. The step-like {101} facets should be similar to the individual (101) or (−101) facets. The importance is that the particle size can be reduced greatly with the area of the exposed facets being almost the same, as plotted in Fig. 3 (B-1). The elongation of the TiO2 nanoparticle along the c axis can favor the formation of more step-like {101} surfaces.
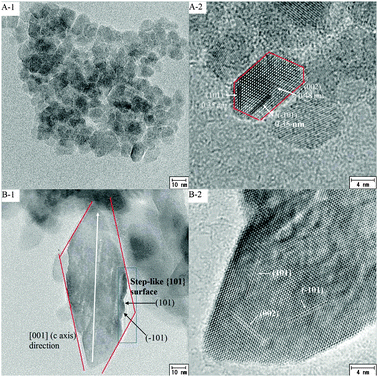 | ||
| Fig. 3 TEM photos of the TiO2 crystallites in TiO2 spheres after hydrothermal treatment with 0 ml ammonia (A) and 2.0 ml ammonia (B) being used. | ||
The appearance of big nanoparticles makes the TiO2 spheres different, as shown in FE-SEM photos. Because the nanoparticles in the hydrothermal-treated TiO2 spheres without using ammonia are small and uniform, the base environment in hydrothermal reactions is important for nanoparticle growth. Because the PVP–TBT sols contain a lot of acetic acid, the amorphous TiO2 nanoparticles of the as-ES spheres are also covered with acetic acid. The acetic acid still anchors on the nanoparticle surface after hydrothermal treatment if ammonia is not used, which will prevent the nanoparticles combination during hydrothermal reactions, so the nanoparticles are uniform for the TiO2 spheres without using ammonia. The OH− groups can replace the acetic acid ligands on the TiO2 surface during hydrothermal reactions as ammonia was used. Thus, the adjacent particles can combine to form big nanoparticles by a dehydration reaction. To support this, Fig. 4 shows the FTIR absorption spectra of the samples after hydrothermal treatment with different amounts of ammonia being used. For the sample without using ammonia, the FTIR spectrum has three IR absorption peaks at 1300 cm−1 (A, C–O single bond), 1372 cm−1 (B, symmetrical stretching vibration of COO-), and 1537 cm−1 (C, asymmetrical stretching vibration of COO.36 Based on the FTIR analysis, the carboxyl groups adhere to the TiO2 surface through bidentate combination.36 The IR peaks A, B, and C almost disappear as ammonia was used, indicating that the COO- can be replaced by OH− during the hydrothermal reaction in the presence of ammonia.
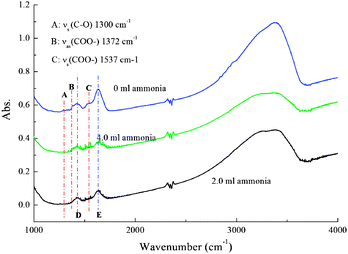 | ||
| Fig. 4 FTIR spectra of TiO2 spheres after hydrothermal treatment with 0, 2.0, and 4.0 ml ammonia being added. | ||
Fig. 5 shows the XRD patterns of the hydrothermal-treated TiO2 spheres with different amounts of ammonia being added. The crystalline phase of the TiO2 spheres is anatase. The crystallinity becomes better as ammonia is used, which is in accordance with FE-SEM and TEM results. By applying the Scherrer equation to the (101) peaks of the XRD patterns,37 the sizes of TiO2 nanoparticles can be estimated, which are 8, 15, 25, and 24 nm as 0.0, 0.5, 1.0, and 2.0 ml ammonia were used, corresponding to the crystal lengths in the [101] direction. Similarly, the crystal lengths in [001] directions are ca. 7, 15, 31, 30 nm by applying the Scherrer equation to (004) peaks. For the samples as ammonia was used, the (211) diffraction peaks become clear. The crystal thickness in the [010] direction can be calculated using the formula L(010) = 0.364L(211), where L(010) is the crystallite size in the [010] direction, and L(211) is the crystallite size obtained from the (211) diffraction peak.38 The crystal thicknesses of the TiO2 spheres as 0.5, 1.0, and 2.0 ml of ammonia were used are ca. 5, 8, and 7 nm, which are smaller than the crystal lengths in [001] and [101] directions, indicative of sheet morphology of TiO2 nanoparticles.
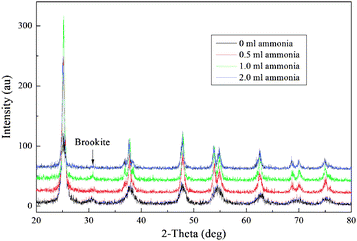 | ||
| Fig. 5 XRD patterns of the TiO2 spheres after the hydrothermal treatment with different amounts of ammonia being used. | ||
The physical data of the SBET, the pore volumes, the pore sizes, and the pore percentages of the samples are shown in Table 1. If no ammonia is used, the TiO2 spheres have a very high SBET of about 198 m2 g−1, and the pore volume is 0.67 cm3 g−1, based on which the pore percentage is calculated to be ca. 72%.35 Using ammonia in the hydrothermal reaction decreases the SBET and the pore volume. Fig. 6 shows the pore size distributions of the TiO2 spheres. As ammonia is not used, the TiO2 spheres present bimodal distribution, which changes to single distribution after ammonia was used. The pore sizes of the TiO2 spheres increase from 12 nm to 80 nm as the ammonia amount increases. The pore volumes of all of the samples are over 0.40 cm3 g−1, with the pore percentage being more than 60%.
| Ammonia amount | S BET a/m2 g−1 | V p b/cm3 g−1 | D p c/nm | P d (%) |
|---|---|---|---|---|
| a The SBET are calculated from a multiple point BET method from 0 to 0.2 of P/P0. b The pore volumes are accumulated from ca. 2 nm to 100 nm. c The average pore size deduced from the pore size distribution. d Pore percentage calculated by considering an anatase phase. | ||||
| 0 ml35 | 198 | 0.67 | 12,26 | 72% |
| 0.5 ml | 64 | 0.46 | 34 | 64% |
| 1.0 ml | 51 | 0.49 | 44 | 65% |
| 2.0 ml | 59 | 0.48 | 50 | 64% |
| 3.0 ml | 62 | 0.49 | 60 | 65% |
| 4.0 ml | 37 | 0.41 | 80 | 61% |
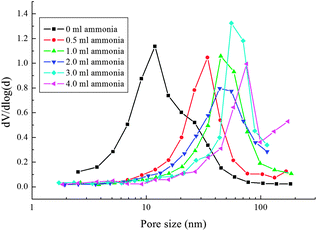 | ||
| Fig. 6 Pore size distributions of the TiO2 spheres after the hydrothermal treatment with different amounts of ammonia being used. | ||
Table 2 summaries the data of the BET analysis of the TiO2 spheres after different periods of hydrothermal treatment. The SBET and the pore volume of the ES TiO2 spheres are 60 m2 g−1 and 0.54 cm3 g−1, respectively.35 The SBET increases to ca. 336 m2 g−1 after 5 h hydrothermal treatment, while the pore volume decreases to 0.32 cm3 g−1, indicating that the spheres will shrink during hydrothermal treatment. Over 15 h hydrothermal treatment results in the sharp decrease of SBET due to the nanoparticle growth. The pore volume increases to 0.45 cm3 g−1 because the big nanoparticles can create more porous space. Fig. 7 shows the pore size distribution and the accumulated pore volumes of the TiO2 spheres after different periods of the hydrothermal process. The ES sample has a wide single-modal pore size distribution around 60 nm, which changes to bimodal distribution after 5 h hydrothermal treatment. Over 15 h hydrothermal treatment can change the pore size distribution back to the wide single mode again.
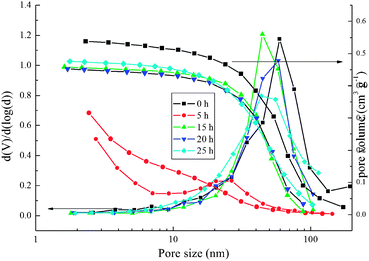 | ||
| Fig. 7 Pore size distributions of the TiO2 spheres after different times of hydrothermal reactions with 2.0 ml ammonia being used. | ||
Effect of calcination
In many cases, post-calcination is needed to remove surface contaminants of photocatalysts. To study the effect of calcination on the morphologies of hydrothermal-treated TiO2 spheres, the FE-SEM photos of the samples of 0.0 ml and 2.0 ml ammonia are shown in Fig. 8(B and C). For comparison, the FE-SEM photo of the direct-annealed sample is also shown (Fig. 8(A)). The direct-annealed sample has a smooth and dense surface. After post-calcination, the hydrothermal-treated sample without using ammonia shows different morphology.35 It can be seen that the nanoparticles on the surface are packed so tightly that the TiO2 spheres become much denser. The hydrothermal-treated sample with 2.0 ml ammonia being used still shows obvious pores after 2 h calcination. Compared to the as-prepared TiO2 sample (Fig. 1(B)), calcination can induce the shrinking of the TiO2 spheres. The data of the BET analysis are shown in Table 3. The direct-annealed ES spheres have the lowest SBET value and a very small pore volume. For the hydrothermal-treated sample as 2.0 ml ammonia is used, calcination reduces the SBET and the pore volume to about 17% and 25%, respectively. The SBET and the pore volume of the sample if ammonia is not used decrease to about 37% and 43%, respectively. Although annealing can result in the pore shrinking, the SBET and the pore volume is still much higher than in the direct annealed materials. Fig. 9 shows the pore size distributions of the hydrothermal-treated TiO2 spheres after calcination and the direct-annealed sample. It can be seen that the pore sizes are similar to that of the TiO2 spheres just after the hydrothermal process.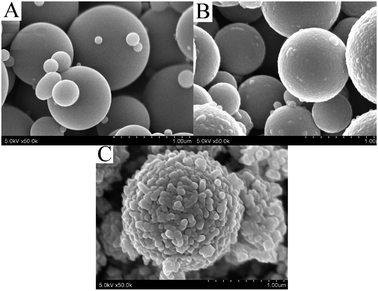 | ||
| Fig. 8 FE-SEM photos of the samples after further calcination without and with 2.0 ml ammonia, and the direct annealed ES balls. | ||
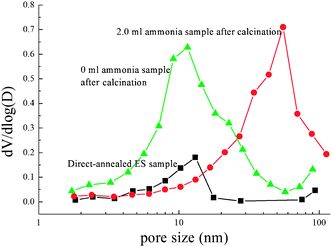 | ||
| Fig. 9 Pore size distributions of the samples after further calcination without and with 2.0 ml ammonia, and the direct-annealed ES balls. | ||
Photocatalytic performances
Fig. 10(A) shows the dependence of ln(C0/C) on the time of UV light illumination for the TiO2 spheres after hydrothermal treatment. For comparison, the direct-annealed sample and the hydrothermal-treated sample with 2.0 ml ammonia being used after UV light pre-treatment are also shown. The photocatalytic rate constants are 0.027 min−1, 0.013 min−1, and 0.011 min−1 for the samples with 0 ml, 2.0 ml, and 4.0 ml ammonia being added. According to the BET analysis, the SBET decreases from 198 m2 g−1 to 59 m2 g−1, and to 37 m2 g−1; the pore size increases from 12 nm to 50 nm, and 80 nm; the pore volume decreasing from 0.67 cm3 g−1 to 0.47 cm3 g−1, and to 0.41 cm3 g−1 as the ammonia amount increases. It can be seen that the increase of pore volume and SBET can increase the photocatalytic activity of TiO2 spheres. It can be seen from the FE-SEM photo that the surface of the sample after hydrothermal treatment without using ammonia contains small pores (∼10 nm).35 This pore size is big enough for the fast transport of MB from the outside to the inside of TiO2 spheres. Higher pore volume and SBET can allow more MB to enter into the TiO2 spheres, so the photocatalytic activity increases as the SBET and the pore volume increase. The photocatalytic rate constant of the direct annealed sample is 0.008 min−1, which is lower than the hydrothermal-treated sample because of the low SBET (32 m2 g−1) and the low pore volume (0.07 cm3 g−1). After 2 h of UV light pre-treatment, the sample has almost the same photocatalytic speed (0.014 min−1) as the sample without UV pre-treatment, indicating that the UV pre-treatment is not good to remove the surface contaminants.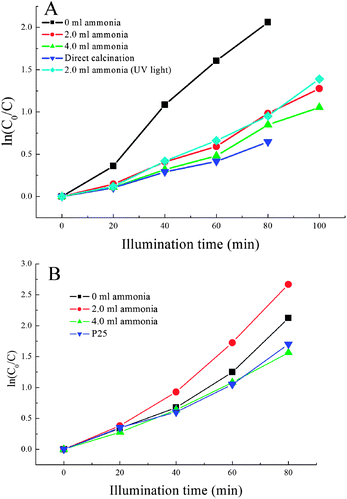 | ||
| Fig. 10 (A) Dependence of ln(C0/C) on the UV light illumination time for the sample with different amounts of ammonia being used, the direct annealed ES sample, and the sample after UV light pre-treatment (B). | ||
Fig. 10(B) shows the dependence of ln(C0/C) on the time of UV light illumination for the hydrothermal-treated samples after further calcination. For comparison, the data of the commercial P25 are also shown. The photocatalytic rate constants are 0.026 min−1, 0.033 min−1, and 0.020 min−1 for the hydrothermal-treated samples as 0 ml, 2.0 ml, and 4.0 ml ammonia were used. The photocatalytic activity of the samples with 2.0 ml and 4.0 ml ammonia being used is better than that just after hydrothermal treatment, while the photocatalytic activity of the sample without using ammonia is almost unchanged. After calcination, the SBET of the sample (2.0 ml ammonia) decreases from 59 m2 g−1 to 49 m2 g−1, and the pore volume decreases from 0.48 cm3 g−1 to 0.36 cm3 g−1, while the pore size is almost the same, so the increase of photocatalytic activity after further calcination should be due to the improvement in crystallinity and removal of surface contaminants. For the sample without using ammonia, the SBET and the pore volume both decrease, but the pore size is almost not changed. FE-SEM analysis shows that the surface of the TiO2 sphere becomes much denser after further calcination (Fig. 8(B)). Although it still has high SBET and high pore volume, the diffusion of MB from the outside to the inside is limited by the dense surface layer, hence the photocatalytic activity cannot be further increased by post-calcination. For the sample in which 2 ml ammonia was used, the pore volume is still high, and the FE-SEM analysis also shows that the sphere surface has big pores, which can allow the fast diffusion of MB. Conclusively, the pores on the surface layer of TiO2 microspheres are like a door that can control the diffusion of MB from the outside to the inside of TiO2 spheres, which plays an important role in photocatalysis. The photocatalytic rate constant of P25 is ca. 0.021 min−1, which is lower than the photocatalytic activity of the hydrothermal-treated samples after further calcination. Although the P25 has a similar SBET (ca. 50 m2 g−1) to the sample (2 ml ammonia) after further calcination, the TiO2 spheres have a pore structure. The high pore volume can allow more MB molecules to take part in the photocatalytic reaction, so the photocatalytic activity is better. In addition, the spherical morphologies of TiO2 materials can also increase the light scattering during the photocatalytic reaction, and can effectively make use of the UV light, which can further increase the photocatalytic activity.
Conclusions
A facile method, which combines electrospray and hydrothermal post-treatment, is developed to make anatase TiO2 hierarchical nanostructured spheres with tunable pore size, pore volume, and SBET. Using ammonia in hydrothermal reactions can greatly change the morphologies of hierarchical TiO2 spheres. The hydrothermal-treated spheres in which over 2.0 ml ammonia were used consist of both big and small nanoparticles. The big nanoparticles are formed by the dehydration of small nanoparticles during the hydrothermal treatment. Post-calcination of the hydrothermal-treated TiO2 spheres can lead to the shrinking of spheres, the decrease of the SBET and the pore volume, but cannot affect the pore size distributions. The pores in the surface layer may act as the door of the reactant transport from the outside to the inside of the TiO2 spheres. If the pores are big enough to allow the fast transport of the reactants, the photocatalytic activity increases as the SBET and pore volume increase. The hydrothermal-treated samples show better photocatalytic activity than the direct annealed ES samples. The photocatalytic activity of the TiO2 sample (2.0 ml and 4.0 ml ammonia) after further calcination is better than commercial P25. In other words, new TiO2 hierarchical materials with high photocatalytic activity were prepared using a simple method.B. Liu acknowledges the Japan Society for the Promotion of Science (JSPS) for a postdoctoral Fellowship for foreign Researchers. K. Nakata and A Fujishima acknowledge a Grant-in-Aid for Scientific Research (B) from the Ministry of Education, Culture, Sports, Science and Technology of Japan.
Notes and references
- A. Fujishima and K. Honda, Nature, 1972, 238, 37 CrossRef CAS.
- J. Yu, L. Qi and M. Jaroniec, J. Phys. Chem. C, 2010, 114, 13118 CAS.
- J. Tang, J. R. Durrant and D. R. Klug, J. Am. Chem. Soc., 2008, 130, 13885 CrossRef CAS.
- J. Zhang, J. H. Bang, C. Tang and P. V. T. Kamat, ACS Nano, 2010, 4, 387 CrossRef CAS.
- T. A. Kandiel, A. Feldhoff, L. Robben, R. Dillert and D. W. Bahnemann, Chem. Mater., 2010, 22, 2050 CrossRef CAS.
- G. Xiang, T. Li and J. Zhang, Chem. Commun., 2010, 46, 6801 RSC.
- Y. Li, T. Sasaki, Y. Shimizu and N. Koshizaki, J. Am. Chem. Soc., 2008, 130, 14755 CrossRef CAS.
- L. K. Tan, M. K. Kumar, W. W. An and H. Gao, ACS Appl. Mater. Interfaces, 2010, 2, 498 CAS.
- E. Formo, E. Lee, D. Campbell and Y. Xia, Nano Lett., 2008, 8, 668 CrossRef CAS.
- S. H. Nam, H.-S. Shim, Y.-S. Kim, M. A. Dar, J. G. Kim and W. B. Kim, ACS Appl. Mater. Interfaces, 2010, 2, 2046 CAS.
- B. H. Lee, M. Y. Song, S.-Y. Jang, S. M. Jo, S.-Y. Kwak and D. Y. Kim, J. Phys. Chem. C, 2009, 113, 21453 CAS.
- T.-S. Kang, A. P. Smith, B. E. Taylor and M. F. Durstock, Nano Lett., 2009, 9, 601 CrossRef CAS.
- F. Sauvage, F. D. Fonzo, A. L. Bassi, C. S. Casari, V. Russo, G. Divitini, C. Ducati, C. E. Bottani, P. Comte and M. Graetzel, Nano Lett., 2010, 10, 2562 CrossRef CAS.
- D. Kim, A. Ghicov, S. P. Albu and P. Schmuki, J. Am. Chem. Soc., 2008, 130, 16454 CrossRef CAS.
- D. Kuang, J. Brillet, P. Chen, M. Takata, S. Uchida, H. Miura, K. Sumioka, S. M. Zakeeruddin and M. Grätzel, ACS Nano, 2010, 2, 1113 CrossRef.
- H. E. Wang, L. X. Zheng, C. P. Liu, Y. K. Liu, C. Y. Luan, H. Cheng, Y. Y. Li, L. Martinu, J. A. Zapien and I. Bello, J. Phys. Chem. C, 2011, 115, 10419 CAS.
- L. Li, X. Yang, J. Gao, H. Tian, J. Zhao, A. Hagfeldt and L. Sun, J. Am. Chem. Soc., 2011, 133, 8458 CrossRef CAS.
- T. Zhao, Z. Liu, K. Nakata, S. Nishimoto, T. Murakami, Y. Zhao and L. Jiang, J. Mater. Chem., 2010, 20, 5095 RSC.
- D. Li and Y. Xia, Nano Lett., 2004, 4, 933 CrossRef CAS.
- C. Xu, J. Wu, U. V. Desai and D. Gao, J. Am. Chem. Soc., 2011, 133, 8122 CrossRef CAS.
- F. Zhuge, J. Qiu, X. Li, X. Gao, X. Can and W. Yu, Adv. Mater., 2011, 23, 1330 CrossRef CAS.
- S.-C. Yang, D.-J. Yang, J. Kim, J.-M. Hong, H.-G. Kim and I.-D. Kim, Adv. Mater., 2008, 20, 1059 CrossRef CAS.
- E. Nilsson, Y. Sakamoto and A. E. C. Palmqvist, Chem. Mater., 2011, 23, 2781 CrossRef CAS.
- W. Yang, F. Wan, Q. Chen, J. Li and D. Xu, J. Mater. Chem., 2010, 20, 2870 RSC.
- P. Z. Araujo, V. Luca, P. B. Bozzano, H. L. Bianchi, G. Soler-illia and M. A. Blesa, ACS Appl. Mater. Interfaces, 2010, 6, 1663 Search PubMed.
- T. H. Eun, S.-H. Kim, W.-J. Jeong, S.-J. Jeon, S.-H. Kim and S.-M. Yang, Chem. Mater., 2009, 21, 201 CrossRef CAS.
- H. Chen, Y. Zhen, Y. Song and L. Jiang, J. Am. Chem. Soc., 2008, 130, 7800 CrossRef CAS.
- H.-J. Koo, Y.-J. Kim, Y.-H. Lee, W.-I. Lee, K. Kim and N.-G. Park, Adv. Mater., 2008, 20, 195 CrossRef CAS.
- L. Zhong, J. Hu, L. Wan and W. Song, Chem. Commun., 2008, 1184 RSC.
- D. Chen, F. Huang, Y. Cheng and R. A. Caruso, Adv. Mater., 2009, 21, 2206 CrossRef CAS.
- H. Li, Z. Bian, J. Zhu, D. Zhang, G. Li, Y. Li, H. Li and Y. Lu, J. Am. Chem. Soc., 2007, 129, 8406 CrossRef CAS.
- J. Yu, Q. Xiang, J. Ran and S. Mann, CrystEngComm, 2010, 12, 872 RSC.
- S. Liu, J. Yu and M. Jaroniec, J. Am. Chem. Soc., 2010, 132, 11914 CrossRef CAS.
- H. Zhang, Y. Han, X. Liu, P. Liu, H. Yu, S. Zhang, X. Yao and H. Zhao, Chem. Commun., 2010, 46, 8395 RSC.
- B. Liu, K. Nakata, M. Sakai, H. Saito, T. Ochiai, T. Murakami, K. Takagi and A. Fujishima, Langmuir, 2011, 27, 8500 CrossRef CAS.
- N. T. Nolan, M. K. Seery, S. J. Hinder, L. F. Healy and S. C. Pillai, J. Phys. Chem. C, 2010, 114, 13026 CAS.
- B. Liu, X. Wang, G. Cai, L. Wen, Y. Song and X. Zhao, J. Hazard. Mater., 2009, 169, 1112 CrossRef CAS.
- C. J. Howard, T. M. Sabine and F. Dickson, Acta Crystallogr., Sect. B: Struct. Sci., 1991, 47, 462–468 CrossRef.
| This journal is © The Royal Society of Chemistry 2012 |

![[thin space (1/6-em)]](https://www.rsc.org/images/entities/char_2009.gif)