Co-promotion of fluorine and boron on NiMo/Al2O3 for hydrotreating light cycle oil
Songdong
Yao
a,
Ying
Zheng
*a,
Lianhui
Ding
a,
Siauw
Ng
b and
Hong
Yang
b
aDepartment of Chemical Engineering, University of New Brunswick, P.O. Box 4400, Fredericton, NB E3B 5A3, Canada. E-mail: yzheng@unb.ca
bCanmetENERGY, Devon, AB T9G 1A8, Canada
First published on 7th May 2012
Abstract
A hydrotreating catalyst, NiMo/Al2O3, was modified with different amounts of fluorine (F) and boron (B) through the pore-saturated impregnation method. The resulting catalysts were characterized by BET, pyridine-IR, XPS, and TEM techniques. Incorporation of fluorine and boron led to the variations in the catalyst acidity and the dispersion of active metals, causing direct impacts on the hydrotreating activities of the catalysts. The hydrodesulfurization (HDS), hydrodenitrogenation (HDN) and hydrodearomatization (HDA) activities of the catalysts were examined in an autoclave reactor using real light cycle oil as feed. The HDS activity decreased in the order NiMo/F,B-Al(5.0) > NiMo/F,B-Al(7.0) > NiMo/F,B-Al(3.5), indicating the existence of an optimum amount of F and B.
1. Introduction
Economical production of ultra-low-sulphur diesel (ULSD) to meet the stringent environmental requirements and the market demands is a huge challenge to both refiners and researchers worldwide.1–3 Different approaches, such as revamping the existing refinery facilities and development of new upgrading processes, have been undertaken to address this issue. R & D of catalysts with high activity and selectivity has been particularly emphasized as they play a key role in cost reduction, yield enhancement, and product quality improvement. Significant efforts have been made to develop novel hydrotreating catalysts. These include: (1) development of novel supports; (2) improvement of active metal components; (3) enhancement of the interaction between metal and support; (4) tuning the catalyst acidity; (5) increasing catalyst hydrogenation capability.4–11Fluorine and boron can be used as promoters to enhance the acidity of Al2O3-supported hydrotreating catalysts. It has been reported that promoter boron may change the type and strength of the acidity of alumina. With co-precipitation, boron may substitute some Al atoms to form B3+, and both Brønsted and Lewis acidic sites could be formed in the presence of H2O.12 The number of acid sites is increased with increasing boron incorporation.13 When boron was impregnated into Al2O3, H3BO3 may react with Al–OH to form B–OH or A1–O–B–O–A1.14,15 When the content of B2O3 is low (<0.8 wt%), it will form monolayer acid sites on the surface of Al2O3. This increases the strength of the acid sites but does not significantly change the total number of acid sites.14,16 When the content of B2O3 is higher than 0.8 wt%, the surface B–O–H groups will be condensed with the Al–OH groups to form B–O–Al species, increasing the strength of the acid sites.14
Introduction of fluorine can change the surface structure and acidic properties of alumina.17 Studies have shown that fluorine-doped alumina can enhance Brønsted and Lewis acid strength, and increase the number of Lewis acid sites.18–22 Meanwhile, fluorine can also improve the metal dispersion and enhance the formation of active CoMoS leading to augmented activity of the catalyst.23 However, excessive Brønsted acids induced by high content of fluorine can encourage the formation of coke, which accelerates the catalyst deactivation.23
In our previous study, the NiMo/γ-Al2O3 catalyst with simultaneous B and F modification presented a better hydrogenation activity than the individual fluorine or boron-modified catalyst.24 Synergic interactions between boron and fluorine species enhanced the performance of the catalyst. The present work focuses on the variations in the catalyst acidity with incorporation of both F and B promoters. The performances in hydrodesulfurization (HDS) and hydrodenitrogenation (HDN) of the catalysts were studied in an autoclave using light cycle oil (LCO) as feed.
2. Experimental
2.1. Catalyst preparation
Alumina (Sasol PURALOX TH100/150 pore volume of 0.96 ml g−1, surface area of 201.6 m2 g−1) was modified with different amounts of NH4F and H3BO3 (obtained from ACROS) by the pore-saturated impregnation method, and then dried at 110 °C overnight. The F/B mass ratio was kept at 6.25 for all the catalyst samples. The F,B-modified alumina was then mixed with molybdenum trioxide (MoO3), nickel nitrate hexahydrate (Ni(NO3)2·6H2O), a binder (partially acid-peptized alumina, SASOL, CAPAPAL B) and extruded to form a cylindrical shape, dried at 383 K overnight and then calcined in the air at 873 K for 4 h. The modified catalysts were denoted as NiMo/F,B-Al(3.5), NiMo/F,B-Al(5.0) and NiMo/F,B-Al(7.0), respectively. The values in the parentheses indicate the content of the fluorine. The catalyst compositions are summarized in Table 1.| MoNi/F,B-Al(3.5) | MoNi/F,B-Al(5.0) | MoNi/F,B-Al(7.0) | |
|---|---|---|---|
| Composition, wt% | |||
| MoO3 | 15 | 15 | 15 |
| NiO | 5 | 5 | 5 |
| Al2O3 | 55.9 | 54.2 | 51.9 |
| Binder Al2O3 | 20 | 20 | 20 |
| F | 3.5 | 5.0 | 7.0 |
| B | 0.56 | 0.8 | 1.12 |
| Surface area, m2 g−1 | 171 | 122 | 99 |
| Pore volume, ml g−1 | 0.48 | 0.46 | 0.45 |
| Average MoS2 slab length, nm | 6.68 | 5.95 | 5.99 |
| Average MoS2 slab layer | 2.52 | 2.31 | 2.23 |
2.2. Catalyst characterization
Survey scans were collected for binding energy from 1100 eV to 0 with analyzer pass energy of 160 eV and a step of 0.35 eV. For the high-resolution spectra the pass-energy was 20 eV and the step was 0.1 eV. The number of scans varied depending on the signal/noise ratio, from 12 for S2p to 16 for Mo3d and Mo3p and 30 for Ni2p. Note that the major molybdenum peak Mo3d overlaps with the minor sulphur peak S2s. The high resolution C1s spectra of the adventitious hydrocarbon (at 284.6 eV) on the sample surfaces were recorded before and after each measurement and used as a reference for charge correction.
2.3. Evaluation of catalyst activity
The catalyst activity was evaluated using a 1 L stirred autoclave (Autoclave Engineers Division of Snap-tite, Inc., Eze-Seal stirred reactor) with LCO as feed. Twenty grams of catalyst was loaded in the catalyst basket of the reactor which was repeatedly vacuumed and refilled with hydrogen to replace the air in the autoclave. Five millilitres of a sulfiding agent, dimethyl disulfide (DMDS), was injected into the reactor. The catalyst was sulfided in situ at 593 K for 2 hours and 633 K for another 2 hours. After sulfiding, 200 g LCO was charged into the batch autoclave reactor through a feed charging tank mounted on the top of the reactor. The reactor was pressurized to 4.83 MPa while temperature was increased to 648 K at a rate of 3 K min−1 with stirring at 1000 rpm. When the temperature reached the pre-set temperature, the hydrogen pressure was adjusted to and maintained at 8.96 MPa. The evaluation was completed when the consumption of hydrogen stopped. The liquid product was collected, weighed and analyzed for nitrogen, sulfur and aromatics using ASTM D4629 (based on oxidative combustion followed by chemiluminescence detection with 4 ppm absolute error), ASTM D4294 (energy-dispersive X-ray fluorescence spectrometry with 2.5 ppm absolute error) and ASTM D6591 (high performance liquid chromatography with refractive index detection with 0.3 wt% absolute error), respectively. The boiling ranges of LCO and liquid products were measured using ASTM D2887 (simulated distillation by GC).3. Results and discussion
3.1. The textural properties
The textural properties of the F, B promoted NiMo/Al2O3 catalysts are listed in Table 1. The catalyst NiMo/F,B-Al(3.5) incorporating the lowest amounts of F and B has a surface area and pore volume of 171 m2 g−1 and 0.48 cm3 g−1, respectively. Increasing the contents of F and B can result in an apparent decrease in the surface area. This might be due to the dissolution of the thin walls of Al2O3 micro-pores and partial blockage of micro-pores by boric acid and fluorine species.243.2 The acidity
Higher acidities of NiMo/Al2O3 catalysts can facilitate the scissions of the C–S or C–N bonds of sulfur- and nitrogen-containing compounds, further increasing HDS and HDN activities of catalysts.9–11 Conversely, augmented acidity can also lead to more severe cracking of hydrocarbons, especially paraffins, lowering the yields of the targeted products.Fig. 1 presents the pyridine IR spectra of NiMo/F,B-Al(3.5), NiMo/F,B-Al(5.0) and NiMo/F,B-Al(7.0) desorbed at 423 K, 523 K, 623 K and 723 K, respectively. There are at least 4 peaks which can be found in the pyridine IR spectra in the range of 1400–1700 cm−1. The bands at 1450 cm−1 and 1540 cm−1 are attributable to the adsorption of pyridine on Lewis and Brønsted acid sites, respectively. The peak centering at 1492 cm−1 indicates co-adsorption of pyridine on both Lewis and Brønsted acid sites. The vibration intensity of the IR bands at 1450, 1492 and 1540 cm−1 becomes weaker as desorption temperature increases. When temperature reached 723 K, the bands at 1540 cm−1 representing the Brønsted acid site nearly disappeared. The bands at 1608 cm−1 can be assigned to the adsorption of pyridine on the tetrahedral aluminum.22,24–26 The quantities of the Lewis and Brønsted acid sites of the catalysts can be calculated from the areas under the peaks centered at 1450 cm−1 and 1540 cm−1 at the desorption temperature of 423 K.
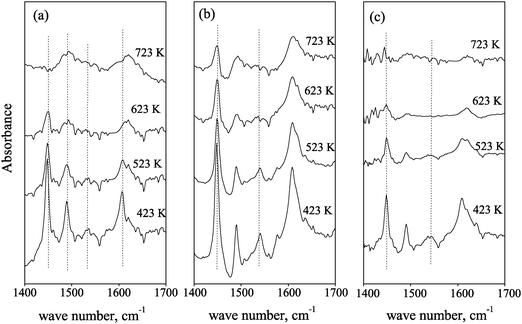 | ||
| Fig. 1 IR spectra of pyridine adsorption for catalysts. (a) MoNi/F,B-Al(3.5); (b) MoNi/F,B-Al(5.0); and (c) MoNi/F,B-Al(7.0) at 423 K, 523 K, 623 K and 723 K. | ||
Fig. 2 depicts the acidity values of Brønsted and Lewis acid sites for the three catalysts. It is noted that Lewis acidity predominated for all three catalysts. When boron content in the NiMo catalysts increased from 0.56 to 0.8, the total acidity of Brønsted and Lewis acid sites almost doubled. Higher contents of F and B, especially B, can encourage the formation of acid sites on the catalyst. This is due to the fact that boron acid tends to react with hydroxyl groups of the alumina surface to form monolayer B–O–H species.14 However, further increase in the content of B from 0.8 to 1.12 resulted in a significant drop in the total or individual acidity. Three possibilities might be responsible for this observation: (1) overloading of boron resulted in the formation of multilayer boron species which triggered a weaker interaction between the surface boron and alumina; (2) excessive addition of F resulted in the formation of a significant amount of AlF63− species, which covered the Lewis acid sites and thus reduced the acidity of the catalyst; and (3) overdosage of F replaced OH of Brønsted acid sites leading to a lower catalyst acidity.18
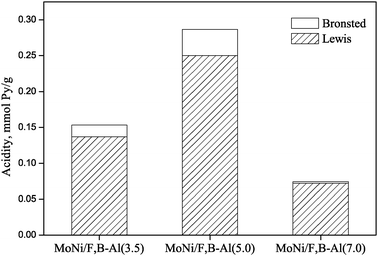 | ||
| Fig. 2 Acidities of MoNi/F,B-Al(3.5), MoNi/F,B-Al(5.0) and MoNi/F,B-Al(7.0). | ||
Increasing temperature could cause desorption of pyridine from acid sites. Strongly absorbed pyridine molecules require more energy or higher temperature to be desorbed from Lewis and Brønsted acid sites. Therefore, the absorbed pyridine at different desorption temperatures (723, 623, 523 and 423 K) was arbitrarily used as the indicator to reflect the adsorption power of the acid sites (i.e., ultra-strong, strong, medium and weak, respectively). Since Brønsted acidity was minor for all the three catalysts, detailed analysis was focused on Lewis acid sites. Fig. 3 compares the relative Lewis acidity of different strength levels for all the three NiMo/F,B-Al catalysts. It is seen that the weak Lewis acid sites decreased while ultra-strong Lewis acid sites increased as the contents of F and B are increased. F may be responsible for the increase in the strength of the Lewis acid sites.18,24
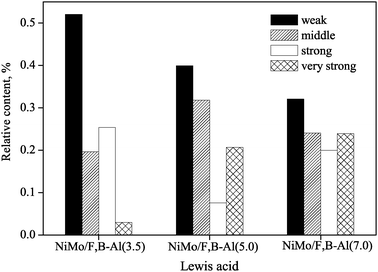 | ||
| Fig. 3 The weak, medium, strong and very strong L acid of NiMo/F,B-Al catalysts. | ||
3.3 XPS analysis
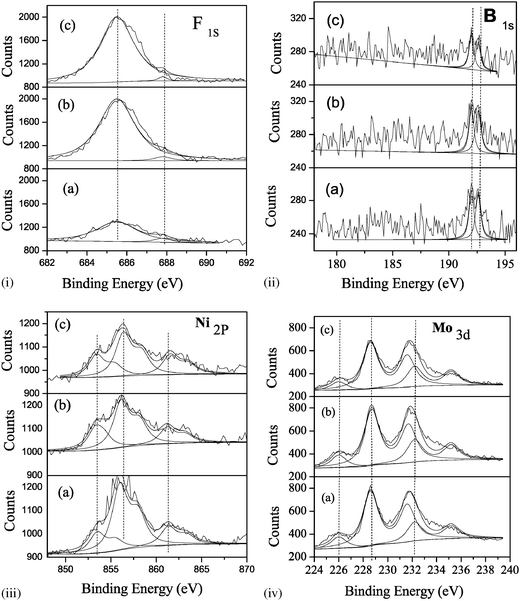 | ||
| Fig. 4 XPS spectra of the sulfided catalysts. (i) F1S; (ii) B1S; (iii) Ni2p; (iv) Mo3d; (a) NiMo/F,B-Al(3.5), (b) NiMo/F,B-Al(5.0) and (c) NiMo/F,B-Al(7.0). | ||
| MoNi/F,B-Al(3.5) | MoNi/F,B-Al(5.0) | MoNi/F,B-Al(7.0) | ||
|---|---|---|---|---|
| F1S | AlF63− | 685.5 | 685.6 | 685.5 |
| AlF3 | 687.8 | 687.9 | 687.8 | |
| B1S | B2O3 | 192.0 | 191.9 | 191.9 |
| B/Al2O3 | 192.6 | 192.6 | 192.6 | |
| Ni2p3/2 | Disulfide | 853.5 | 853.7 | 853.5 |
| — | Ni, sat | 861.4 | 862.9 | 862.6 |
| NiAl2O4/Ni2O3 | 856.0 | 856.2 | 856.1 | |
| Mo3d5/2 | MoS2 | 228.9 | 228.7 | 228.7 |
| MoOx | 232.2 | 231.8 | 232.0 | |
| S2s | S | 226.0 | 226.0 | 226.0 |
| Atomic concentration ratio, % | ||||
| F/Al | Bulk | 11.7 | 16.8 | 23.5 |
| surface | 8.7 | 20.0 | 22.6 | |
| B/Al | Bulk | 3.3 | 4.7 | 6.6 |
| surface | Trace | Trace | Trace | |
| Ni/Al | Bulk | 4.25 | 4.25 | 4.25 |
| surface | 4.79 | 4.20 | 4.19 | |
| Mo/Al | Bulk | 6.64 | 6.64 | 6.64 |
| surface | 10.60 | 9.74 | 8.30 | |
All the catalysts have similar patterns of F1s, B1s, Ni2p and Mo3d spectra. The binding energy of F1s (685.5–685.6 eV) observed in the XPS is close to that of Na3AlF6 (685.50 eV) but different from those of the NiF2 (685.1 eV) and NaBF4 (687.0 eV).27 Boorman et al. (1985) assigned this peak to the F ions replacing hydroxyl groups on the alumina surface, indicating that fluorine ions may react with the Al2O3 supports.28 A small shoulder peak of F1s (687.8–687.9 eV) may be assigned to the AlF3 (687.5 eV). The binding energy of B1s (192.0–192.6 eV) is close to that of B2O3 (192.4 eV) and (Al2O3)9(B2O3)2 (192.70 eV) as well as B/Al2O3 (192.70 eV), but slightly lower than that of H3BO3 (193.0 eV). This indicates that a small amount of boron may exist in the form of B2O3 and be bonded to the surface Al2O3. The binding energy of Ni2p3/2 indicates that Ni species are mainly in their sulfide status (853.5–853.7 eV). The Mo3d spectra can be split into some doublet peaks, corresponding to the Mo6+, Mo5+ and Mo4+ species as well as MoS2 species. This suggests that Mo species mainly exist in the form of MoOxSy, MoS2 or NiMoS phase and are not fully sulfided in the initial sulfiding step.10,11
Compared to catalyst NiMo/F,B-Al(3.5), a significant amount of F has been retained on the surface of catalyst NiMo/F,B-Al(5.0). More F species are present on the surface than in the bulk. The distribution pattern of B species remains the same, that is, only a trace amount of B can be identified on the surface of catalyst NiMo/F,B-Al(5.0). Opposite to the dispersion pattern of F species, approximately half of the active metal Ni has migrated to the bulk of catalyst NiMo/F,B-Al(5.0).
Further increase in incorporation of F and B seems to encourage the migration of F into the bulk. In catalyst NiMo/F,B-Al(7.0), F uniformly distributes on the surface and the bulk of catalyst. Similar to catalyst NiMo/F,B-Al(5.0), B and two active metals Mo and Ni exhibit similar distribution patterns in catalyst NiMo/F,B-Al(7.0).
3.4 TEM
Molybdenum disulfide has a layered hexagonal structure, where a flat molybdenum atom layer is located between two sulphur atom layers to form an S–Mo–S sandwich structure. It is generally accepted that the active sites of molybdenum sulphide clusters are positioned at the edge surface of the MoS2 layered structure. When nickel or cobalt atoms co-exist in the MoS2 structure, these promoter atoms may be located at the edges of the MoS2 hexagonal structure.29Fig. 5 shows the representative TEM images of the three sulfided catalysts. The black lines in the image were identified as the layers of MoS2 in the verticle planes (Fig. 5). The number of the parallel black lines denotes the number of the layers. Arithmetic averages of the number of layers of MoS2 slabs and layer length are calculated from more than 300 crystallites measured from the TEM images.30–32
 | ||
| Fig. 5 TEM images of NiMo/F,B-Al(3.5), NiMo/F,B-Al(5.0) and NiMo/F,B-Al(7.0). | ||
Fig. 6 and 7 show the distribution of the length and the number of stack layers of MoS2 slabs. The average length and layers of the MoS2 slabs are listed in Table 1. More than 20.6% MoS2 slabs on catalyst NiMo/F,B-Al(3.5) have length longer than 7 nm. Catalysts NiMo/F,B-Al(5.0) and NiMo/F,B-Al(7.0) have lengths about 16% longer than 7 nm. Concerning the thickness of the MoS2 slabs, about 21.2% MoS2 slabs on the NiMo/F,B-Al(3.5) catalyst are thicker than 3 layers while only 12.7% and 13.4% MoS2 slabs are thicker than 3 layers for catalyst NiMo/F,B-Al(5.0) and NiMo/F,B-Al(7.0), respectively. The results indicate that the active phase of catalyst NiMo/F,B-Al(3.5) is more aggregated than that of the other two catalysts. This is consistent with the XPS results where the surface NiMo species decreased in the same order NiMo/F,B-Al(3.5) > NiMo/F,B-Al(5.0) > NiMo/F,B-Al(7.0). Increased addition of F and B can reduce the amounts of surface Ni and Mo species and therefore lower the aggregation of the active NiMoS slabs.
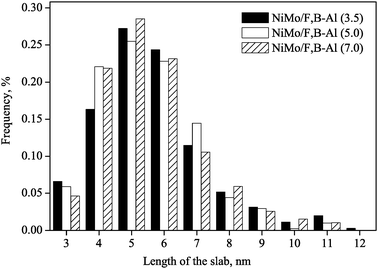 | ||
| Fig. 6 The distribution of slab length of the sulfided NiMo/F,B-Al2O3 catalysts. | ||
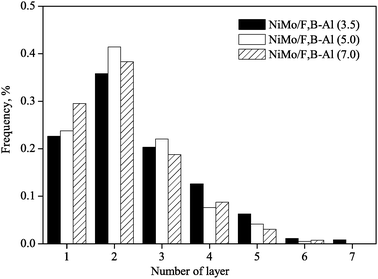 | ||
| Fig. 7 The distribution of slab layer of the sulfided NiMo/F,B-Al2O3 catalysts. | ||
3.5 Catalyst activity
It has been reported that the morphology of MoS2 clusters plays an important role in determining the catalytic activities of MoS2 catalysts. Daage and Chianelli (1994) proposed a rim–edge model in which hydrogenation reaction occurred on rim sites (the top and bottom edges) of the stacked clusters.33 By considering the stacking height of the catalysts and the hindrance of the aromatic molecules being adsorbed, the top rims of a multi-layered MoS2 cluster can have less steric hindrance than the bottom edges.31 The Mo positioned at the top rims of the MoS2 slabs can provide greater hydrogenation activity than the Mo at other positions. The amount of the top rim Mo atoms in the MoS2 slabs can be calculated by the following equations.30 | (1) |
| The amount of Mo atoms at top edges ntop(i) = 6nMo(i)− 6 | (2) |
| The amount of Mo atoms at slabs nslab(i) = (3n2Mo(i) − 3nMo(i) − 1)N(i) | (3) |
| The ratio of Mo atoms on top rim edges RatioMo = ∑ntop(i)/∑nslab(i) | (4) |
Table 3 shows the total sulfur and nitrogen contents of the feed and the hydrotreated LCO products. The HDS activities of the three catalysts decrease in the order NiMo/F,B-Al(5.0) > NiMo/F,B-Al(7.0) > NiMo/F,B-Al(3.5). HDS is generally considered taking place in two parallel reaction pathways, direct desulfurization (DDS) and hydrogenation (HYD). The former is carried out by hydrogenolysis of the C–S bond and the latter by the hydrogenation of the aromatic ring followed by hydrogenolysis of the C–S bond.1,7 The acidity of a catalyst can enhance its ability in the cleavage of the C–S bond and therefore increase the HDS activity. NiMo/F,B-Al(5.0) has the best HDS performance among the three catalysts because of its high acidity and higher hydrogenation activity.
| Feed | MoNi/F,B-Al(3.5) | MoNi/F,B-Al(5.0) | MoNi/F,B-Al(7.0) | |
|---|---|---|---|---|
| The cracking rate indicates the amounts in the products whose distillation temperature is lower than the initial boiling point of feed (133.5 °C). | ||||
| N, ppmw | 495.6 | 14.57 | 19.07 | 23.72 |
| S, ppmw | 13![[thin space (1/6-em)]](https://www.rsc.org/images/entities/char_2009.gif) 000 000 |
985 | 654 | 786 |
| Cracking rate, wt% | — | 1.36 | 0.90 | 0.44 |
In addition to the hydrogenation ability and acidity, the synergetic effect between Ni and MoS2 may also play an important role in the NiMo/Al2O3 catalysts hydrotreating.34 It is seen that the three catalysts are effective in removing nitrogen-containing compounds. Catalyst NiMo/F,B-Al(3.5) demonstrates a slightly better HDN performance than the other two catalysts with 14.57 ppm N left in the hydrotreated product. The surface distribution of NiMo species might be responsible for the HDN ability of catalyst NiMo/F,B-Al(3.5) which has a relatively higher surface Ni/Al ratio and Mo/Al ratio than the other two catalysts (Table 2). The nickel atom on the catalyst surface can not only position at the edge of the active Ni–Mo–S phase but also develop the donor phase, Ni2S3, to the acceptor MoS2. The spillover hydrogen has been reported to demonstrate mobility between the separated Ni and Mo clusters.35,36 The mobility of spillover hydrogen among the active NiMoS phase and NiSx clusters can enhance the hydrogenation and HDN ability of catalyst NiMo/F,B-Al(3.5).
Fig. 8 presents the distributions of hydrocarbon types in the final products being treated with the catalysts. After hydrogenation, more than 80% of polyaromatics and over 50% of diaromatics in the feedstock were converted—2/3 partially hydrogenated to monoaromatics and 1/3 completely hydrogenated into saturated hydrocarbons. The hydrodearomatization activity decreased in the order NiMo/F,B-Al(7.0) > NiMo/F,B-Al(5.0) > NiMo/F,B-Al(3.5). The ring opening activity (saturates from the hydrogenation of the aromatics) of the three catalysts is 14.4%, 13.1% and 11.2% respectively, which is in proportion to the ratio of top rim Mo atoms in the MoS2 slabs. Addition of F, B to the alumina support leads to variations in the distribution of NiMo species on the catalyst surface which can further affect the morphology of the active NiMoS slabs, the Mo ratio at the top rims in the NiMoS slabs and hydrogenation activity of the catalysts.
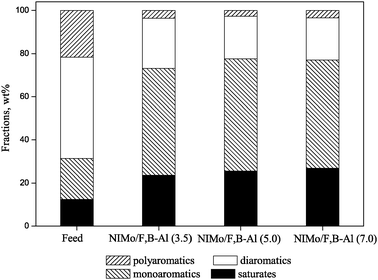 | ||
| Fig. 8 Aromatics and saturates hydrocarbon distribution on the NiMo/F,B-Al catalysts. | ||
Fig. 9 shows the distillation curves for the LCO feed and the products after the feed was hydrotreated with the F, B promoted NiMo catalysts. The cracking rate in the product can be obtained from the distillation curve, that is, the content at temperature < 133.5 °C (the initial boiling point of feed) in the product. For the NiMo/F,B-Al(3.5), NiMo/F,B-Al(5.0) and NiMo/F,B-Al(7.0) catalysts, the cracking rate is only 1.36%, 0.90% and 0.44% (listed in Table 3). The low cracking rate means that less gas products are produced and more middle distillate products can be obtained after LCO was hydrotreated. It is because F, B promoted NiMo/Al2O3 catalysts mainly formed Lewis acid sites, which contribute less to the cracking reaction.
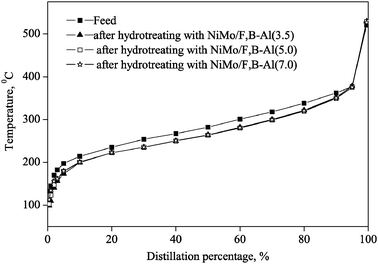 | ||
| Fig. 9 Distillation curve for the feed and the products after hydrotreating with the F, B promoted NiMo catalysts. | ||
In summary, for HDA, high hydrogenation ability of the catalyst is required. For HDN, high hydrogenation ability and suitable acidity are important for the hydrogenation of N-containing aromatic rings followed by the C–N bond cleavage. For HDS, high acidity combined with suitable hydrogenation activity is preferred, because HDS can be carried out either by hydrogenation of the aromatic ring followed by hydrogenolysis of the C–S bond or by directly hydrogenolysis of the C–S bond.
4. Conclusions
Fluorine (F) and boron (B) have been incorporated into the hydrotreating catalyst NiMo/Al2O3. Addition of F and B can promote the total acidity of Brønsted and Lewis acid sites, though there is an optimal content of F, B for best catalyst activity. Beyond the effect on catalyst acidity, incorporation of F, B can lead to the variations in distribution of Ni and Mo. Increasing the F, B content favors the migration of Ni and Mo species into the bulk. It has been observed that catalyst NiMo/F,B-Al(3.5) has the lowest content of F and B and highest surface Ni and Mo whereas catalyst NiMo/F,B-Al(7.0) having the highest content of F and B shows the opposite amount of Ni and Mo on the catalyst surface. Additionally, presence of F and B can have an impact on the morphology of the NiMoS slabs on the catalyst. Higher content of F, B can lead to aggregation of the active NiMoS slabs which can further affect the Mo ratio at the top rim of MoS2 slabs that is directly associated with the hydrogenation activity of catalysts.The overall effects of the addition of F and B are seen in the catalyst activity. The evaluation results reveal that the HDA activities of the three catalysts studied in this work decreased in the order NiMo/F,B-Al(7.0) > NiMo/F,B-Al(5.0) > NiMo/F,B-Al(3.5). The HDN activities decreased in the order NiMo/F,B-Al(3.5) > NiMo/F,B-Al(5.0) ≈ NiMo/F,B-Al(7.0) while HDS activity decreased in the order NiMo/F,B-Al(5.0) > NiMo/F,B-Al(7.0) > NiMo/F,B-Al(3.5).
Abbreviation
| n Mo(i) | The amount of Mo atoms on one side of the MoS2 slab |
| n slab(i) | The amount of Mo atoms at slabs |
| n top(i) | The amount of Mo atoms at top edges of the MoS2 slab |
| DDS | Direct desulfurization |
| DMDS | Dimethyl disulfide |
| HDA | Hydrodearomatics |
| HDN | Hydrodenitrogenation |
| HDS | Hydrodesulfurization |
| HYD | Hydrogenation |
| LCO | Light cycle oil |
Acknowledgements
The authors are grateful for the financial support provided by the NSERC and the Atlantic Innovation Fund.References
- M. Breysse, G. Djega-Mariadassou, S. Pessayre, C. Geantet, M. Vrinat, G. Perot and M. Lemaire, Deep desulfurization: reactions, catalysts and technological challenges, Catal. Today, 2003, 84, 129–138 CrossRef CAS.
- T. Fujikawa, H. Kimura, K. Kiriyama and K. Hagiwara, Development of ultra-deep HDS catalyst for production of clean diesel fuels, Catal. Today, 2006, 111, 188–193 CrossRef CAS.
- C. S. Song, An overview of new approaches to deep desulfurization for ultra-clean gasoline, diesel fuel and jet fuel, Catal. Today, 2003, 86, 211–263 CrossRef CAS.
- M. S. Rana, V. Samano, J. Ancheyta and J. A. I. Diaz, A review of recent advances on process technologies for upgrading of heavy oils and residua, Fuel, 2007, 86, 1216–1231 CrossRef CAS.
- D. Genuit, P. Afanasiev and M. Vrinat, Solution syntheses of unsupported Co(Ni)-Mo-S hydrotreating catalysts, J. Catal., 2005, 235, 302–317 CrossRef CAS.
- E. J. M. Hensen, Y. van der Meer, J. A. R. van Veen and J. W. Niemantsverdriet, Insight into the formation of the active phases in supported NiW hydrotreating catalysts, Appl. Catal., A, 2007, 322, 16–32 CrossRef CAS.
- M. Breysse, P. Afanasiev, C. Geantet and M. Vrinat, Overview of support effects in hydrotreating catalysts, Catal. Today, 2003, 86, 5–16 CrossRef CAS.
- M. Breysse, C. Geantet, P. Afanasiev, J. Blanchard and M. Vrinat, Recent studies on the preparation, activation and design of active phases and supports of hydrotreating catalysts, Catal. Today, 2008, 130, 3–13 CrossRef CAS.
- G. Perot, Hydrotreating catalysts containing zeolites and related materials – mechanistic aspects related to deep desulfurization, Catal. Today, 2003, 86, 111–128 CrossRef CAS.
- L. H. Ding, Y. Zheng, Z. S. Zhang, Z. Ring and J. W. Chen, Hydrotreating of light cycle oil using WNi/Al2O3 catalysts containing zeolite beta and/or chemically treated zeolite Y, J. Catal., 2006, 241, 435–445 CrossRef CAS.
- L. H. Ding, Y. Zheng, Z. S. Zhang, Z. Ring and J. W. Chen, HDS, HDN, HDA, and hydrocracking of model compounds over Mo–Ni catalysts with various acidities, Appl. Catal., A, 2007, 319, 25–37 CrossRef CAS.
- A. Delmastro, G. Gozzelino, D. Mazza, M. Vallino, G. Busca and V. Lorenzelli, Characterization of microporous amorphous alumina boria, J. Chem. Soc., Faraday Trans., 1992, 88, 2065–2070 RSC.
- S. A. El-Hakam and E. A. El-Sharkawy, Structural characterization and catalytic properties of aluminum borates alumina catalysts, Mater. Lett., 1998, 36, 167–173 CrossRef CAS.
- J. Ramirez, P. Castillo, L. Cedeno, R. Cuevas, M. Castillo, J. M. Palacios and A. Lopezagudo, Effect of boron addition on the activity and selectivity of hydrotreating CoMo/Al2O3 catalysts, Appl. Catal., A, 1995, 132, 317–334 CrossRef CAS.
- C. Flego and W. O. Parker, Characterization of gamma-alumina and berated alumina catalysts, Appl. Catal., A, 1999, 185, 137–152 CrossRef CAS.
- M. Lewandowski and Z. Sarbak, The effect of boron addition on hydrodesulfurization and hydrodenitrogenation activity of NiMo/Al2O3 catalysts, Fuel, 2000, 79, 487–495 CrossRef CAS.
- J. M. Lewis, R. A. Kydd and P. M. Boorman, A study of fluorided Ni-Mo/Al2O3 catalysts in cumene conversion and thiophene HDS reactions, J. Catal., 1989, 120, 413–420 CrossRef CAS.
- J. J. Lee, H. Kim, J. H. Koh, A. Jo and S. H. Moon, Performance of fluorine-added CoMoS/Al2O3 prepared by sonochemical and chemical vapor deposition methods in the hydrodesulfurization of dibenzothiophene and 4,6-dimethyldibenzothiophene, Appl. Catal., B, 2005, 61, 274–280 CrossRef CAS.
- Z. Sarbak, Acidity, cumene conversion and thiophene hydrodesulfurization over alumina and surface modified aluminas, Appl. Catal., A, 1997, 159, 147–157 CrossRef CAS.
- P. Berteau, M. A. Kellens and B. Delmon, Acid-base properties of modified aluminas, J. Chem. Soc., Faraday Trans., 1991, 87, 1425–1431 RSC.
- C. Kwak, J. J. Lee, J. S. Bae, K. Choi and S. H. Moon, Hydrodesulfurization of DBT, 4-MDBT, and 4,6-DMDBT on fluorinated CoMoS/Al2O3 catalysts, Appl. Catal., A, 2000, 200, 233–242 CrossRef CAS.
- L. M. Rodriguez, J. Alcaraz, M. Hernandez, M. Dufaux, Y. Ben Taarit and M. Vrinat, Fluorinated alumina: characterization of acid sites and relationship between acidity and activity in benzene alkylation, Appl. Catal., A, 1999, 189, 53–61 CrossRef CAS.
- Z. Sarbak and S. L. T. Andersson, Effect of metal-organic compounds on thiophene hydrodesulfurization over sulfided forms of fluoride-containing CoMo/Al2O3 catalysts, Appl. Catal., 1991, 69, 235–251 CrossRef CAS.
- L. H. Ding, Z. S. Zhang, Y. Zheng, Z. Ring and J. W. Chen, Effect of fluorine and boron modification on the HDS, HDN and HDA activity of hydrotreating catalysts, Appl. Catal., A, 2006, 301, 241–250 CrossRef.
- T. R. Hughes and H. M. White, A study of surface structure of decationized Y zeolite by quantitative infrared spectroscopy, J. Phys. Chem., 1967, 71, 2192–2201 CrossRef CAS.
- T. R. Hughes, H. M. White and R. J. White, Brønsted and Lewis acid site concentrations in fluorided alumina from infrared spectra of adsorbed pyridine species, J. Catal., 1969, 13, 58–64 CrossRef CAS.
- C. D. Wagner, et al., Handbook of X-ray photoelectron spectroscopy, Perkin-Elmer Corporation, Physical Electronics Division, Eden Prairie, Minn, 1979 (55344) Search PubMed.
- P. M. Boorman, R. A. Kydd, Z. Sarbak and A. Somogyvari, Surface-acidity and cumene conversion – 1: A study of gamma-alumina containing fluoride, cobalt, and molybdenum additives, J. Catal., 1985, 96, 115–121 CrossRef CAS.
- P. Faye, E. Payen and D. Bougeard, Influence of cobalt on a model of an MoS2 hydrodesulfurization catalyst, J. Catal., 1999, 183, 396–399 CrossRef CAS.
- M. F. Li, H. F. Li, F. Jiang, Y. Chu and H. Nie, The relation between morphology of (Co)MoS2 phases and selective hydrodesulfurization for CoMo catalysts, Catal. Today, 2010, 149, 35–39 CrossRef CAS.
- D. Ferdous, A. K. Dalai, J. Adjaye and L. Kotlyar, Surface morphology of NiMo/Al2O3 catalysts incorporated with boron and phosphorus: Experimental and simulation, Appl. Catal., A, 2005, 294, 80–91 CrossRef CAS.
- H. Shimada, Morphology and orientation of MoS2 clusters on Al2O3 and TiO2 supports and their effect on catalytic performance, Catal. Today, 2003, 86, 17–29 CrossRef CAS.
- M. Daage and R. R. Chianelli, Structure-function relations in molybdenum sulfide catalysts – the rim-edge model, J. Catal., 1994, 149, 414–427 CrossRef CAS.
- J. A. R. Vanveen, H. A. Colijn, P. Hendriks and A. J. Vanwelsenes, On the formation of Type-I and Type-II NiMo phases in NiMo/Al2O3 hydrotreating catalysts and its catalytic implications, Fuel Process. Technol., 1993, 35, 137–157 CrossRef CAS.
- B. Delmon and G. F. Froment, Remote control of catalytic sites by spillover species: A chemical reaction engineering approach, Catal. Rev. Sci. Eng., 1996, 38, 69–100 CAS.
- P. Baeza, M. S. Ureta-Zanartu, N. Escalona, J. Ojeda, F. J. Gil-Llambias and B. Delmon, Migration of surface species on supports: A proof of their role on the synergism between CoSx or NiSx and MoS2 in HDS, Appl. Catal., A, 2004, 274, 303–309 CrossRef CAS.
| This journal is © The Royal Society of Chemistry 2012 |
