Characterization of a novel calibration method for mineral density determination of dentine by X-ray micro-tomography
Wei
Zou
ab,
Jinlong
Gao
b,
Allen S.
Jones
c,
Neil
Hunter
b and
Michael V.
Swain
*ab
aBiomaterial Research Unit, Faculty of Dentistry, University of Sydney, Australia. E-mail: mswain@mail.usyd.edu.au; Fax: +61 2-9351-8375; Tel: +61 2-9351-8375
bInstitute of Dental Research, Westmead Centre for Oral Health and Westmead Millennium Institutes, Westmead, Sydney, Australia
cThe Electron Microscope Unit, University of Sydney, NSW, Australia
First published on 18th October 2008
Abstract
Laboratory micro-CT systems, although limited by beam hardening effect and instability of the source, have been utilized to measure mineral density in combination with specific image processing methods. However, few attempts have been made to accurately determine mineral density profiles in dentine due to the lack of suitable calibration standards. The aim of this study was to develop a calibration method to evaluate mineral density profiles in dentine including changes associated with dentinal caries. A series of K2HPO4 solution phantoms in a concentration range between 0 and 0.9 g cm−3-coupled to a set of water infiltrated porous solid hydroxyapatite (HA) phantoms, with mineral densities ranging from 1.52 to 2.08 g cm−3, was used in this investigation. First we evaluated the micrometer-scale homogeneity and noise in the HA phantoms using a commercial laboratory micro-CT system. Then an experimental validation was performed of the linearity over the entire density range of these two different calibration materials. The results show the HA phantoms extended the calibration curve obtained from K2HPO4 solution phantoms to densites as high as 2.08 g cm−3; the linearity remains stable at different energy levels. Finally, compared to the reference micro-CT calibration methods, the advantages of this new method are discussed. We conclude that this calibration method allows a more rational assessment of mineral density of dentine by micro-CT and has a promising potential for future studies.
Introduction
Micro-CT is an imaging technique that enables volumetric X-ray attenuation measurements for non-destructive evaluation of materials.1 It visualizes the internal structure of an object and provides the basis for complete three-dimensional reconstruction.2–4 Apart from this, micro-CT allows comparison of the sample before and after an experimental procedure.1,5–7 In the last few years, micro-CT has been utilized for investigating the dynamic processes of demineralization and remineralizaiton in dental caries, including enamel,8–12 and dentine.2,5,7,10Determination of mineral density profiles is based on changes in X-ray attenuation. It has been shown that a linear relationship between the X-ray attenuation coefficient and the mineral density exists, and the grey levels of the reconstructed micro-CT slices correspond directly to a map of attenuation coefficients within a sample.13–15 This method has been widely used in the studies of demineralization and remineralization of calcified tissues.2,9,13,16 However, calibrating a laboratory micro-CT system for mineral density determination of dentine remains a major challenge.
Dentine, comprising 70 wt% inorganic materials, 20 wt% organic matrix and 10 wt% water, has been described using both single and two phase models. The contributions of water and organic material within dentine have been previously considered to be negligible.2,7,10 Thus, the calibration problem was simplified to a single phase model. In models taking two phases into account, with one phase representing the higher density compounds like the mineral and the other representing the tissue matrix, the contributions of water and the organic phase were generally considered to be constant.15,17,18 Commonly used two phase phantoms are made of a soft-tissue equivalent resin with different mineral concentrations,15,18–21 for instance provided in a range from 0–0.8 g cm−3 [QRM GmbH, Möhrendorf, Germany]. Unfortunately the phantoms appear non-homogeneous at the resolution scale used for micro-CT imaging (∼10 µm) and the non uniform distribution of the powder, presumably occurring during the mixing and resin curing reaction, results in the granular nature of the images.22 Also, standards made by the various manufacturers have already shown to be different due to variations in the compositions of the resin, filler and calcium hydroxyapatite components.18
Dipotassium hydrogen phosphate (K2HPO4) dissolved in water (liquid) standards have been frequently used for calibrating quantitative computed tomography (QCT) measurements of bone mineral density15,18,23,24 as its X-ray attenuation properties are very similar to those of HA, and it represents a two-phase mixture. However, the main problem is that K2HPO4 has a limited concentration range of up to 1 g cm−3; higher values of mineral densities have to be extrapolated. Previously, Nuzzo et al.15 confirmed a linear relationship between the linear attenuation coefficients of the K2HPO4 solutions and the salt concentrations for a fixed energy, both in theory and practice, where the contribution of water to the linear attenuation coefficient of the solution was a constant value. Inspired by their reasoning process,15 we hypothesized that the linear relationship between grey value (linear attenuation coefficient) and mineral density should be valid as long as mineral is evenly distributed in a matrix.
In a solid form pure HA can be used to represent the mineral phase in calcified tissues.8,15,17,25 While solid HAphantoms have proven to be spatially homogeneous,8,25,26 and were capable of spanning the highest and lowest density in enamel, a lack of phantoms with densities below 1.4 g cm−3 remains due to manufacturing limitations.26 Most recently, fusion of pure HA with Li2B4O7 was used to achieve mineral concentrations ranging between 0.12 and 0.74 g cm−3.25 However the combined calibration curve was obtained after subtracting the absorption caused by the mass fraction of Li2B4O7 matrix. The contributions of organic phase and water were again not considered.
Presently, there is no suitable two-phase calibration standard available for dentine studies by polychromatic micro-CT scanner, which should have similar composition to dentine and cover a representative range of mineral densities. In this study, we explored the possibility of expanding the calibration curve obtained from K2HPO4 solutions at different concentrations by using a second set of standards, prepared by vacuum-assisted infiltration of water into solid homogeneous porous HA phantoms. In this proposed model, hydroxyapatite is spatially distributed evenly in a water matrix. The aim of this work was to prepare and characterize a new two-phase calibration standard for micro-CT investigations using two different materials, K2HPO4 solutions and water-saturated solid porous HA phantoms and to validate this calibration procedure at different energy levels.
Results and discussion
Micrometer-scale homogeneity and noise characterization of HA phantoms
Validation of the micrometer-scale homogeneity of water infiltrated HA phantoms has been carried out in this study. Table 2 shows the measured grey values and noise in five ROIs (Fig. 1) within all individual water infiltrated porous solid HA phantoms. The average differences in grey values between the peripheral and the central regions were 0.6873, 0.5950, 0.7050 and 1.3460 for HA1, HA2, HA3 and HA4 respectively. The differences in HA phantoms were not significant (p = 0.5). As expected, the average standard deviation (SD) in grey values increased with increasing density in HA phantoms, indicating higher system bias such as noise, scattering, beam hardening effect at higher densities. Coefficient of variance (CV) remained less than 2.3% for all phantoms. Fig. 1 shows a typical reconstructed horizontal slice from a HA phantom (HA4) showing a uniform distribution of HA at the applied spatial resolution. The radial signal profiles (Fig. 2) illustrate all the HA phantoms were essentially uniform at a resolution of 10 µm, with the slight non-uniformity reflected by the fluctuations in the signal profiles. However, the average differences in grey values between center and periphery were all much less than one standard deviation of the measured grey values for all phantoms.| Sample | Sintering Temperature (°C) | Bulk Density/g cm−3 (%)a | Open Porosity (%) | Closed Porosity (%) |
|---|---|---|---|---|
| a A theoretical density of 3.15 g cm−3 for HA was assumed. b The small negative values may be attributed to experimental errors. | ||||
| HA1 | 800 | 1.52 (46.5) | 53.5 | −0.1b |
| HA2 | 900 | 1.63 (51.8) | 47.1 | 1.1 |
| HA3 | 1000 | 1.85 (59.2) | 40.3 | 0.5 |
| HA4 | 1100 | 2.08 (66.2) | 33.8 | −0.1b |
| HA1 | HA2 | HA3 | HA4 | |||||
|---|---|---|---|---|---|---|---|---|
| Grey Value | SD | Grey Value | SD | Grey Value | SD | Grey Value | SD | |
| Top | 117.5280 | 2.639 | 121.3850 | 2.714 | 138.6850 | 2.816 | 158.2130 | 3.051 |
| Bottom | 117.5590 | 2.47 | 124.7730 | 2.732 | 141.1030 | 2.72 | 155.9150 | 3.062 |
| Left | 118.6870 | 2.563 | 122.7530 | 2.758 | 138.1950 | 2.892 | 157.1220 | 3.095 |
| Right | 118.3830 | 2.779 | 124.8690 | 2.91 | 141.4650 | 2.871 | 158.6900 | 3.011 |
| Centre | 117.3520 | 2.768 | 124.0400 | 3.15 | 140.5670 | 3.155 | 158.8310 | 3.86 |
| Average difference from the centre | 0.6873 | 0.5860 | 0.5950 | 1.6850 | 0.7050 | 1.6610 | 1.3460 | 1.2350 |
| Average SD | 2.6438 | 2.8628 | 2.8908 | 3.2158 | ||||
| Average grey value | 118.5018 | 123.5640 | 140.0030 | 157.7542 | ||||
| Coefficient of Variation (%) | 2.24 | 2.30 | 2.21 | 2.20 | ||||
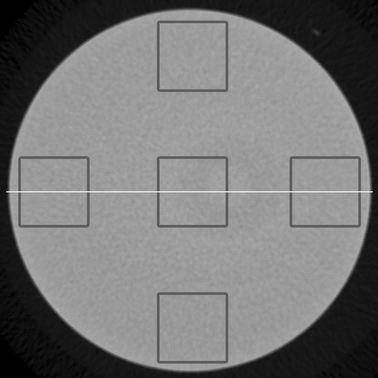 | ||
| Fig. 1 A typical reconstructed horizontal slice from HA4, indicating the locations of the square-shaped Regions of Interest (ROIs) with a size of 2 × 2 mm2 and from where the signal profiles were taken. | ||
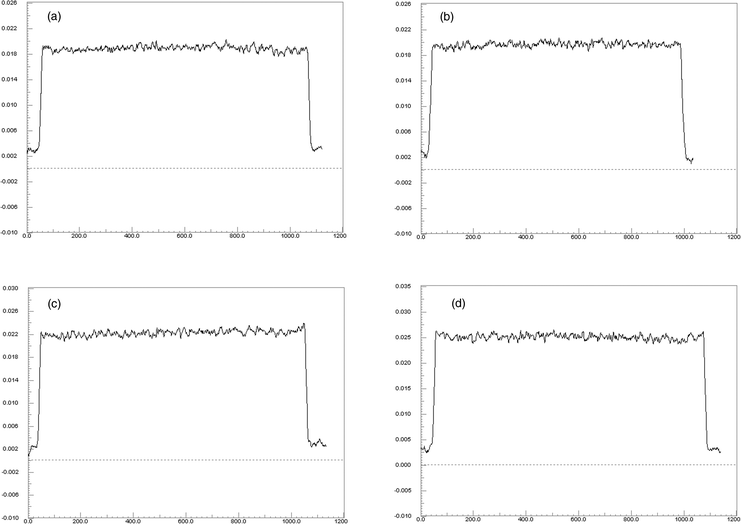 | ||
| Fig. 2 Signal profiles taken through the center of the water infiltrated porous HA phantoms (a: HA1, b: HA2, c: HA3, d: HA4). All profiles were obtained from the central reconstructed slice. The mineral densities show an even distribution at the spatial resolution of 10 µm. Horizontal axis: number of voxels. Vertical axis: Linear attenuation coefficient in 1 mm−1. | ||
Despite micro-CT systems with 2D detectors such as the SkyScan-1172 system being highly sensitive to slight differences in the sensitivity of adjacent detector elements, ring artefacts become an important problem when high contrast resolution is required.27 A common approach to reduce ring artefacts is known as flat-field correction. This was achieved in the present study by obtaining an image without placing a sample in the X-ray beam as a flat-field reference prior to each scanning. However ring artefacts were not completely removed by the flat-field correction (Fig. 1). This was attributed to non-uniformities in the incident X-ray beam, a response of the scintillator and the CCD detector. Frame averaging, which also can reduce noise in each projection, was set at 4 in our study. More image frames could have been averaged per projection to increase the signal-to-noise ratio (SNR); however this would increase the scan time.
As the use of micro-CT for quantitative mineral density measurement becomes increasingly prevalent, several methods have been proposed to improve signal-to-noise ratio. An approach for the design of a dual-CCD configuration was presented to improve the overall SNR and extend the dynamic range of an imaging system.28 Most commercial micro-CT systems use analytic reconstruction such as the Feldkamp algorithm. However, iterative reconstruction such as the maximum likelihood algorithm is better able to reduce noise.19 Post processing methods were also investigated to reduce noise,8, 27 but it is always preferable to record the original scans by means of equipment modification rather than post processing solutions.
Construction of a calibration curve
The average grey levels of K2HPO4 solutions and water infiltrated porous solid HA phantoms were measured by image J, and plotted against the known mineral densities. The linear relationship between grey level and mineral density was generated. As shown in Fig. 3, mineral densities of both phantoms correlates to grey values very well in a linear relationship, which yields two similar calibration equations. Fig. 3a is a typical curve of best fit, displaying the linear relation between the grey values and the mineral densities for K2HPO4 solutions. A linear fit to the data yields a correlation coefficient (R2) of 0.9992. The grey values of the HA phantoms also show a linear dependence of the mineral densities with the regression R2 value of 0.9995 (Fig. 3b). Fig. 4 shows a combined calibration graph for all samples prepared in this study. Despite the different compositions and manufacturing procedures, the correlation of the measured grey values with both K2HPO4 concentrations and HA densities is very high (R2 = 0.9996). According to these results, the HA phantoms, after careful mixture with water under a vacuum device for 1 hour, extended the calibration curve obtained from K2HPO4 solution phantoms to densities as high as 2.08 g cm−3; the K2HPO4 solution phantoms in turn validated a homogeneous structure in the two-phase mixture of porous solid HA phantom and water, that is, the HA crystals were evenly distributed in the matrix of water.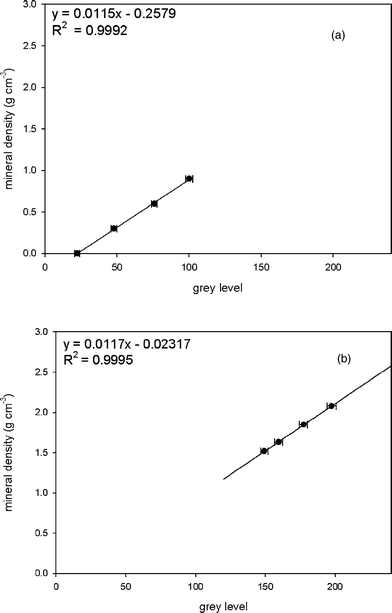 | ||
| Fig. 3 Calibration curves and equations for K2HPO4 solution phantoms (a) and water infiltrated porous solid HA phantoms (b). Error bars correspond to one standard deviation of the grey values for each phantom respectively. | ||
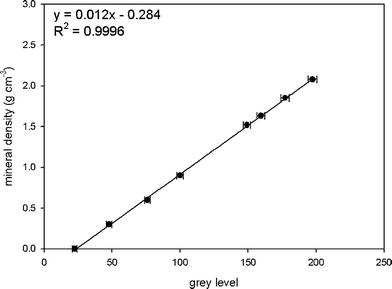 | ||
| Fig. 4 Combined calibration curve and equation for all samples. Error bars indicate one standard deviation of the individual results. | ||
Some problems concerning the use of K2HPO4 solution phantoms are air bubble formation and the evaporation of water through imperfect seals.18,25 The bubbles are said to form at a rate of about 500 µl/year, and do not change the concentration of the solutions.18 Meanwhile, they can be removed from the solutions and therefore are of minor importance. Regarding the matter of evaporation, the problem has been solved by regular replenishments or replacements.
Accuracy of the calibration method at different energy levels
The accuracy of our calibration method was investigated at different energy levels. All the samples were scanned at 100 µA with the tube voltage varying from 50 to 100 kV. The K2HPO4 solution phantoms and HA1, 2, 4 were utilized to establish a calibration equation, by which the measured grey value was converted to an estimated mineral density. Table 3 shows the selected regression data. The grey values retain linearity as a function of increasing mineral densities, independent of the compositions of the calibration standards and the energy level applied. The linear regression R2 values in all instances are higher than 0.99. HA3 was used to evaluate the accuracy of the calibration equations obtained from different energy levels. The true value of this phantom is 1.85 g cm−3. A comparison of accuracy is shown in Table 4. The estimated mean densities of HA3 showed high accuracy, as the relative error values between the true value and the estimated ones were less than 1% from different scans operated at different voltages, except for the scan at 50 kV where low signal-to-noise ratio probably affected results (Fig. 5a). Accuracy improved in images at high energy levels, for instance, the mean error achieved was 0.25% at 100 kV, corresponding to a difference in mineral density of 0.0047 g cm−3 from the true value.| Voltage | Slope | Intercept | R2 |
|---|---|---|---|
| Note the R2 values in all instances (except for 50 kV) are higher than 0.99. | |||
| 50 kV | 0.0152 | −0.1070 | 0.9849 |
| 60 kV | 0.0132 | −0.0702 | 0.9986 |
| 70 kV | 0.0121 | −0.2315 | 0.9997 |
| 80 kV | 0.0121 | −0.2315 | 0.9997 |
| 90 kV | 0.0119 | −0.2628 | 0.9996 |
| 100 kV | 0.0120 | −0.0283 | 0.9996 |
| Voltage | Estimated MD/g cm−3 | SD/g cm−3 | CV (%) | Mean Error (%) |
|---|---|---|---|---|
| Note the true value of HA3 is 1.85 g cm−3. | ||||
| 50 kv | 1.7733 | 0.27 | 15.47 | 4.10 |
| 60 kv | 1.8626 | 0.17 | 9.20 | 0.68 |
| 70 kv | 1.8616 | 0.11 | 5.96 | 0.63 |
| 80 kv | 1.8566 | 0.075 | 4.02 | 0.36 |
| 90 kv | 1.8552 | 0.062 | 3.37 | 0.28 |
| 100 kv | 1.8453 | 0.058 | 3.15 | 0.25 |
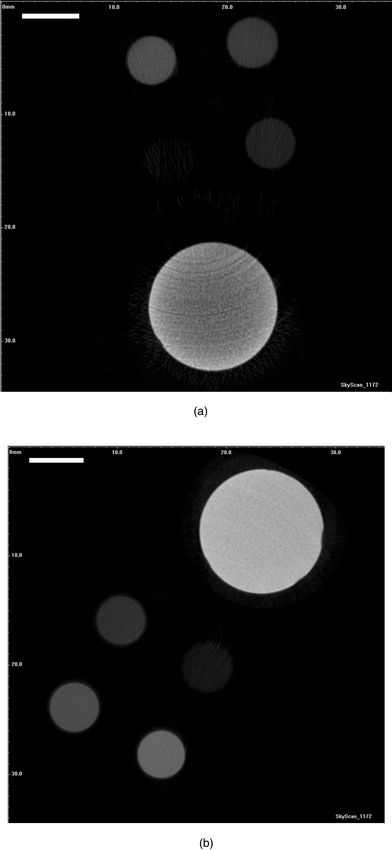 | ||
| Fig. 5 Phantoms scanned at the tube voltage of (a) 50 kV and (b) 100 kV, with the tube current fixed at 100 µA, using a 1180 ms exposure time. The different grey levels correspond to different K2HPO4 concentrations and HA3. Notice the beam hardening effect clearly visible within (a). (Scale bar: 6 mm). | ||
Noise, expressed as standard deviation of the estimated mineral density, varied at different energy levels. The energy spectrum is related to the capacity of X-ray photons to penetrate, so noise is expected to increase when energy level declines as low energy or soft X-rays are scattered and penetrate less efficiently than hard X-rays. Fig. 6 plots the measured coefficient of variation (CV%) in HA3 as a function of the voltage applied or X-ray energy. The CV% has been fitted with nonlinear power law regression expression y = 526391.5x−2.6703. The CV reduced from 15.47% at 50 kV to 3.15% at 100 kV. Further increase in tube voltage would appear to diminish in its ability to significantly reduce the noise. Fig. 5 shows two reconstructed horizontal slices through HA3 and K2HPO4 phantoms at 50 kV and 100 kV. Beam hardening effects are clearly visible as cupping artifacts resulting in an apparent denser surface and less dense core at 50 kV.
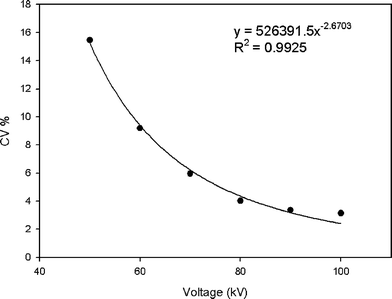 | ||
| Fig. 6 Measured CV in HA 3, expressed as average standard deviation of the measured grey level plotted as function of increased applied voltage or energy level. The tube current used was 100 mA, with the tube voltage was varied from 50–100 kV, using a 1180 ms exposure time. | ||
The X-ray intensity directly affects the signal-to-noise ratio and thus image clarity.29 The difference in measured mineral density in dentine as reported in the literature5–8,10–12,17,25,30 can partially result from the different operating scanner voltages and currents. High energy penetrates more efficiently, but can be less sensitive to changes in material density and composition; low energy enhances the noise in reconstructed images, and thus affects low-contrast detection ability too. While the linear attenuation coefficient or grey level is dependent on the energy level, the mineral density is not, hence measurements at different energy levels should yield the same mineral concentration. In terms of accuracy, our calibration method has shown excellent reliability upon which an accurate estimation of the mineral density of an object was obtained. Although different levels of noise were present in the micro-CT images, the estimated density was the mean of ROIs, which was not affected by random noise. We also compared the coefficient of variation (CV%) values within HA3 at different energy levels, which was found to fit with nonlinear regression to the equation: y = 526391.5×−2.6703. This finding is important as further increase in tube voltage limited further reduction of noise as anticipated.
Comparison of our calibration method and the reference method
It has been shown that a linear relationship between the X-ray attenuation coefficient and mineral density exists, and the grey levels of the reconstructed micro-CT slices correspond directly to a map of attenuation coefficients within a sample.13–15 Several micro-CT studies have directly calibrated the scanning system for linear attenuation coefficients in calcified tissues. A pure aluminium (Al) wire has been placed longitudinally next to the object as a reference material that could be visible in every slice.5,7,10–12,30 As Al has an atomic number not far away from the effective atomic number of HA,13 the linear attenuation coefficient (LAC) of the calcified tissue could be expressed as the LAC of Al at the applied photon energy. For each image, the mean LAC was standardized using the ratio of the published LAC data31,32 for Al at that certain energy level to the measured value. This method facilitates calibrating ideally when the attenuation versus energy characteristics of the specimen matches those of Al. However, many uncertainties and variations in the composition of sound and carious dentine limit the accuracy of the determination of mineral concentration from the linear attenuation coefficient. On the other hand, the X-ray beam consists of bremsstrahlung and characteristic radiation resulting in a broad continuous spectrum of frequencies making it polychromatic.33 To give one single energy number as an ‘effective’ energy may not be able to fully describe all the properties of the beam; the instability and aging of the source alter the estimation of an accurate effective energy level further. As attenuation coefficients are very dependent on X-ray energy, the altered energies of a polychromatic beam lead to different attenuations of the same material.13 From this point of view, the use of reconstructed grey values from calibration standards with different mineral concentrations8,15,17,25 to construct a linear calibration curve is of advantage as it helps to compensate for measurement bias induced by variation of the X-ray energies.13 In addition, our two-phase calibration method takes the contributions of water and organic material within dentine into account. It has also for the first time introduced a two-phase calibration standard, where the range of mineral densities covers the highest and lowest density values found in dentine, thus avoiding extrapolating the calibration curve obtained from low density K2HPO4 solution phantoms or high density HA phantoms towards the actual mineral density values in dentine, and enabling a more rational mineral density calibration.Finally, several points should be emphasized concerning the applicability of the results of this study. Experiments were only performed with phantoms; hence the accuracy depends upon the extent to which the phantoms simulate the X-ray attenuation properties of human dentine. Carious dentine consists of decomposed dentine, demineralised dentine, translucent dentine, sound dentine and secondary dentine in which the proporiton of the organic, inorganic and water component of the dentine varies at different locations within the lesion and also between different carious lesions due to caries activity status. Concerning this matter, it is reassuring that negligible difference in grey values was obtained from mixtures of water and collagen at different ratios in our preliminary study. This finding is in agreement with Dowker's study.9 Disregarding the subtle difference, we consider dentine as a two-phase mixture, in which the organic phase could be modeled as water.
Experimental
Manufacturing procedure of HA phantoms:
The manufacturing procedure and SEM analysis of porous solid HA phantoms used in this study has been described in detail elsewhere.8,26 Briefly, commercially high-purity HA powder (E. Merck, D-6100 Darmstadt, Germany) was used as the starting material in this study. This powder was shown to consist of agglomerates of nanometre-sized primary particles (∼50–100 nm diameter) with open pores between the primary particles. The HA powder was pressed at 100 MPa in a hardened-steel die using a hydraulic press to form disks, each nominally 12.8 mm diameter and 3 mm thick. Pressed disks were sintered at 800 °C-1100 °C for 2 h in an electric muffle furnace to produce a range of bulk densities. The phantoms were then inserted into deionized water under a vacuum device for 1 hour, which resulted in the displacement of air with water within the HA pores. Finally, all the water infiltrated HA phantoms were stacked vertically and maintained in a deionized water-filled tube (diameter = 14 mm), and subjected to micro-CT characterization. Based on previous SEM and physical investigations,26HA phantoms showed a homogeneous structure with all having open porosity. The measured density and porosity data of the HA disks are listed in Table 1.Manufacturing procedure of K2HPO4 solutions
K2HPO4 solutions were prepared in the following concentrations: 0, 0.3, 0.6, and 0.9 g cm−3. For construction of a calibration curve for mineral densities, a set of K2HPO4 solutions were filled in 4 cylindrical tubes (diameter = 4 mm) to accomodate the limited field of view generated by the cone beam. After experimentations, the concentration values were confirmed by chemical microanalysis.Experimental Micro-CT
Statistical analysis
For the analysis of micro-scale homogeneity of HA phantoms, mean differences in grey values between peripheral and central ROIs were compared using one way ANOVA, with significance accepted for p < 0.05. For the analysis of linearity, linear regression was performed and a linear relationship between the grey value and the mineral density was determined at the 0.001 level. All statistical analyses were performed with a commercial software application (SPSS 10.0 for Windows, Microsoft, USA).Conclusions
In the present study, a new two-phase calibration standard was developed to convert the reconstructed grey value to a specific density of mineralization for polychromatic micro-CT investigations. By taking the contribution of water and organic material within dentine into account, a new two-phase calibration method is proposed to expand the calibration curve obtained from water solutions at different concentrations of K2HPO4 by using a second set of standards, prepared by vacumm-assisted infiltration of water into solid homogeneous porous HA phantoms with different densities. The new materials have similar composition to dentine and cover a representative range of mineral densities. Results from this study suggest that our calibration method provides a critical basis to assess mineral changes in carious dentine. This method has promising potential for future quantitative studies.Appendix
1. The conversion of reconstruction results to the grey-scale images. All cross sections were reconstructed as the arrays of float-point numbers at first. A dynamic range was selected to convert a floating-point cross-section image to an 8-bit bitmap image with linear conversion to 256-grades of grey inside the selected density interval. The minimum level was corresponding attenuation coefficient for the minimum grey value (0), while maximum level was corresponding attenuation coefficient for the maximum grey value (255). Values out of range are assigned 0 (if below lower limit) or 255 (if above maximum limit). In this study, a preview reconstruction was performed to find the “automatic” range before every reconstruction.| Scans | Dynamic range/mm−1 | |
|---|---|---|
| Minimal level (Min) | Maximum level (Max) | |
| Homogeneity and noise characterization in HA phantoms | 0.0007 | 0.04 |
| 100 kV | 0.000293 | 0.032050 |
| 90 kV | 0.0008 | 0.040978 |
| 80 kV | 0.001085 | 0.05 |
| 70 kV | 0.001678 | 0.078291 |
| 60 kV | 0.002208 | 0.103032 |
| 50 kV | 0.00352 | 0.163415 |
2. The conversion of pixel value from grey-level to its physical unit: linear attenuation coefficient in 1 mm−1 A pixel in a CT image represents the linear attenuation coefficient of the matter at that location for the X-ray spectrum used, although the value obtained is often biased by noise, scattering, beam-hardening etc. The linear attenuation coefficient here means the raw value obtained from the reconstruction program, in the unit of 1 mm−1. For the standard output 8-bit BMP file format, the pixels are grey values, converted from the raw floating-point values. To convert the grey value back to the attenuation coefficient for dataset created by NRecon, which is the manufacturer's reconstruction software, the following pseudo-code is provided: Attenuation coefficient = GreyValue × (Max − Min)/255 + Min. Finally multiply the result by 2PI = 2 × 3.1415926, a factor omitted in NRecon. (Reference: NRecon user's manual, version 1.4.4, Skyscan, Aartseelar, Belgium.)
Acknowledgements
Financial support for this research was provided by NIH grant (DE015272) and NHMRC grant (512524). The first author wishes to acknowledge Dr. Owen Standard for the HA phantom preparation and density determinations of the phantoms, and Dr. Tiffany Huang for technical assistance. The authors also thank Dr. Greg Cohen and other staff for scientific and technical assistance in addition to the facilities in the NANO Major National Research Facility at the Electron Microscope Unit, University of Sydney.References
- G. R. Davis and F. S. Wong, Physiol. Meas., 1996, 17, 121–146 CrossRef CAS.
- J. H. Kinney, G. W. Marshall, Jr. and S. J. Marshall, Scanning Microsc., 1994, 8, 197–204 CAS ; discussion 204–195.
- F. S. Wong, N. S. Willmott and G. R. Davis, Int. J. Paediatr. Dent., 2006, 16, 419–423 CrossRef CAS.
- T. Hildebrand, A. Laib, R. Muller, J. Dequeker and P. Ruegsegger, J. Bone Miner Res., 1999, 14, 1167–1174 CrossRef CAS.
- N. S. Willmott, F. S. Wong and G. R. Davis, Caries Res., 2007, 41, 129–134 CrossRef CAS.
- S. K. Hahn, J. W. Kim, S. H. Lee, C. C. Kim, S. H. Hahn and K. T. Jang, Caries Res., 2004, 38, 75–78 CrossRef.
- T. N. Clementino-Luedemann, A. Dabanoglu, N. Ilie, R. Hickel and K. H. Kunzelmann, Dent. Mater. J., 2006, 25, 675–683.
- T. T. Huang, A. S. Jones, L. H. He, M. A. Darendeliler and M. V. Swain, J. Dent., 2007, 35, 737–743 CrossRef CAS.
- S. E. Dowker, J. C. Elliott, G. R. Davis, R. M. Wilson and P. Cloetens, Caries Res., 2004, 38, 514–522 CrossRef CAS.
- T. N. Clementino-Luedemann and K. H. Kunzelmann, Dent Mater J, 2006, 25, 113–119 CAS.
- F. S. Wong, P. Anderson, H. Fan and G. R. Davis, Arch. Oral Biol., 2004, 49, 937–944 CrossRef CAS.
- F. S. Wong, J. C. Elliott, G. R. Davis and P. Anderson, J. Anat., 2000, 196(Pt 3), 405–413 Search PubMed.
- J. C. Elliott, F. S. Wong, P. Anderson, G. R. Davis and S. E. Dowker, Connect Tissue Res., 1998, 38, 61–72 CrossRef CAS ; discussion 73–69.
- S. Nuzzo, M. H. Lafage-Proust, E. Martin-Badosa, G. Boivin, T. Thomas, C. Alexandre and F. Peyrin, J. Bone Miner Res., 2002, 17, 1372–1382 CrossRef CAS.
- S. Nuzzo, F. Peyrin, P. Cloetens, J. Baruchel and G. Boivin, Med. Phys., 2002, 29, 2672–2681 CrossRef.
- J. J. Ten Bosch and B. Angmar-Mansson, J. Dent Res., 1991, 70, 2–14 CAS.
- A. A. Postnov, A. V. Vinogradov, D. Van Dyck, S. V. Saveliev and N. M. De Clerck, Physiol. Meas., 2003, 24, 165–178 CrossRef CAS.
- M. M. Goodsitt, Bone Miner, 1992, 19, 145–158 CrossRef CAS.
- H. S. Chueh, W. K. Tsai, H. M. Fu and J. C. Chen, Comput. Med. Imaging Graph., 2006, 30, 349–355 CrossRef.
- Y. Zheng, W. W. Lu, Q. Zhu, L. Qin, S. Zhong and J. C. Leong, Spine, 2000, 25, 353–357 CrossRef CAS.
- J. C. Cheng, L. Qin, C. S. Cheung, A. H. Sher, K. M. Lee, S. W. Ng and X. Guo, J. Bone Miner Res., 2000, 15, 1587–1595 CrossRef CAS.
- U. Bonse, F. Busch, O. Gunnewig, F. Beckmann, R. Pahl, G. Delling, M. Hahn and W. Graeff, Bone Miner, 1994, 25, 25–38 CrossRef CAS.
- H. K. Genant and D. Boyd, Invest. Radiol., 1977, 12, 545–551 CAS.
- C. E. Cann and H. K. Genant, J. Comput. Assist. Tomogr., 1980, 4, 493–500 CAS.
- S. Schweizer, B. Hattendorf, P. Schneider, B. Aeschlimann, L. Gauckler, R. Muller and D. Gunther, Analyst, 2007, 132, 1040–1045 RSC.
- L. H. He, O. C. Standard, T. T. Huang, B. A. Latella and M. V. Swain, Acta Biomater., 2007 Search PubMed.
- J. Sijbers and A. Postnov, Phys. Med. Biol., 2004, 49, N247–253 CrossRef.
- H. Liu and G. Wang, Med. Phys., 2000, 27, 2435–2437 CrossRef CAS.
- C. Chappard, A. Basillais, L. Benhamou, A. Bonassie, B. Brunet-Imbault, N. Bonnet and F. Peyrin, Med. Phys., 2006, 33, 3568–3577 CrossRef.
- F. S. Wong, J. C. Elliott, P. Anderson and G. R. Davis, Calcif Tissue Int., 1995, 56, 62–70 CrossRef CAS.
- G. R. Davis, J. C. Elliott, P. Anderson, in X-ray Microscopy III, eds. A. G. Michette, G. R. Morrison and C. J. Buckley, Springer Verlag, Heidelberg, Editon edn, 1992, pp. 458-460 Search PubMed.
- J. H. Hubbell, S. M. Seltzer, Tables of X-Ray Mass Attenuation Coefficients and Mass-Energy Absorption Coefficients 1 keV to 20MeV for Elements Z = 1 to 92 and 48 Additional Substances of Dosimetric Interest Report NISTIR 5632 National Institute of Standards and Technology, Gaithersburg, 1995 Search PubMed.
- H. J. D. Wildenschild, C. M. P. Vaz, M. L. Rivers, D. Rikard and B. S. B. Christensen, J. Hydrol., 2002, 267, 285–297 CrossRef.
- D. L. L. A. Feldkamp and J. W. Kress, J. Opt. Soc. Am. A, 1984, 1, 612–619 Search PubMed.
- D. D. v., E. van de Casteele, J. Sijbers and E. Raman, J. X-Ray Sci. Technol., 2004, 12, 53–57.
| This journal is © The Royal Society of Chemistry 2009 |
