The study of the distribution of melamine in rat renal tissues by imaging mass spectrometry
Huan-Yao
Wang
a,
Li-Hua
Lo
a,
Yu-Chang
Tyan
bc,
Hung-Chun
Chen
d,
Ming-Hui
Yang
ac,
Tzu- Yin
Chen
d,
Hay-Yan J.
Wang
*ce and
Jentaie
Shiea
*acf
aDepartment of Chemistry, National Sun Yat-Sen University, Kaohsiung, 80424, Taiwan. E-mail: jetea@mail.nsysu.edu.tw; Fax: +886-7-5253933; Tel: +886-7-5253933
bDepartment of Medical Imaging and Radiological Sciences, Kaohsiung Medical University, Kaohsiung, Taiwan
cNational Sun Yat-Sen University—Kaohsiung Medical University Joint Research Center, Taiwan
dDepartment of Renal Care, Kaohsiung Medical University, Kaohsiung, Taiwan
eDepartment of Biological Sciences, National Sun Yat-Sen University, Kaohsiung, 80424, Taiwan. E-mail: hyjwang@gmail.com; Fax: +886-7-5252000-3611; Tel: +886-7-5252000-3611
fCancer Center, Kaohsiung Medical University Hospital, Taiwan
First published on 13th October 2010
Abstract
The recent tainting events of milk and pet foods with melamine and melamine-related compounds (MRCs), in attempts to elevate the total nitrogen content, have led to many cases of acute renal failure in infants and domestic pets. In this study, we employed matrix-assisted laser desorption ionization/time-of-flight (MALDI-TOF) mass spectrometry-based imaging mass spectrometry (IMS) technique to visualize the distribution of melamine in renal tissue. For rats orally administered with melamine alone, the protonated melamine ion at m/z 127 was detected only in the papilla. No melamine signal was detected in the kidney of rats receiving cyanuric acid alone. Melamine was accumulated in kidney only when the rats received high dose of melamine (100 mg day−1) together with cyanuric acid for 3 days. Under such regimen, the molecular signal was visible in both cortex and medulla, with an accumulation in renal papilla. Our IMS results for rat renal tissue are consistent with previous reports and histological observations. Nonetheless, there was no difference between the lipid distributions on the renal tissues of the control rats and those administered with melamine/cyanuric acid.
Introduction
The World Health Organization has declared food safety as “an essential public health issue in this new millennium”. As is generally known, in certain circumstances, hazardous chemicals have been intentionally adulterated into food to elevate assay results for protein matter. A well-publicized example is the recent outbreak of infant renal failure in China caused by the adulteration of nitrogen-rich chemical compound melamine and melamine-related compounds (MRCs) such as cyanuric acid, in milk powder in attempts to enrich their protein-like nitrogen contents using Kjeldahl testing.1–3The melamine molecule consists of six nitrogen, hydrogen, and carbon atoms (C6H6N6, M.W. = 126 g mol−1). The nitrogen content in melamine is more than 66 percent by weight (84/126). The compound is used widely in the production of plastics, fire retardants, and pesticides.4 Cyanuric acid (C3H3N3O3, M.W. = 129 g mol−1) is often added into swimming pools as a stabilizer to minimize the decomposition of hypochlorous acid.5 Crude melamine usually contains some cyanuric acid, a byproduct of its synthesis. The adulterated melamine and MRCs were first detected in wheat gluten added in pet food to increase the total nitrogen contents in Kjeldahl testing.6 Since then, the United States Department of Agriculture has banned the adulteration of melamine and MRCs in imported animal fertilizers. Although the oral administration of melamine in large quantities to sheep may cause their death,7 there are no other reports on the deaths of other species of animals by melamine ingestion. However, some reports have shown that the presence of melamine and cyanuric acid in pet foods can cause acute renal failure, showing hematuria, calculi, or cancer in the urinary bladder of the animals consuming the adulterated food.7,8
Melamine and cyanuric acid form a hydrogen-bonded complex as they meet together.9–12 Due to its low solubility, this complex will be easily precipitated out, once it enters the kidney tubules where the water reabsorption occurs. Although the toxicity of individual melamine or MRCs is low, it is suspected that blockage of renal tubules by the calculi from co-precipitation of melamine and cyanuric acid is the main cause of kidney failure, especially for newborns.3
The most widely used analytical methods to characterize melamine in fertilizers, and dairy products are solvent extraction, concentration, followed by gas chromatography/mass spectrometry (GC-MS) or liquid chromatography/mass spectrometry (LC/MS) and LC/MS/MS analyses.13–15 Recently, desorption electrospray ionization (DESI) and extractive electrospray ionization (EESI) have been applied to rapidly characterize trace melamine in milk and milk powder.16,17 Although melamine and its metabolites—ammeline, ammelide, and cyanuric acid can be detected using the above techniques, direct evidence for the accumulation and spatial distribution of melamine and MRCs in kidneys is still absent.
Matrix-assisted laser desorption/ionization time-of-flight (MALDI-TOF) mass spectrometry is known for its ease of operation, automation, and high sensitivity for the analyses of many small organic or large biochemical compounds such as drugs, lipids, peptides, and proteins from various sources.18–24 This type of instrument employs a focused laser beam to desorb and ionize the sample, which typically comprises of an analyte surrounded by a large amount of the organic matrix. One recent report described the use of MALDI-TOF for the rapid characterization of melamine in urine.25
Because of the innate spatial resolution of a laser beam, the MALDI-TOF apparatus can be used to study the distribution of particular chemicals or biochemical compounds on solid samples. This method, known as imaging mass spectrometry (IMS), is an ideal approach for the determination of the distribution of molecules of interest directly from tissues without additional extraneous sample handling. Moreover, unlike other imaging techniques such as fluorescence imaging or magnetic resonance imaging, IMS does not require prior knowledge of the sample before analysis. IMS does depend, however, on even matrix coating and successful tissue pretreatment processes which result in even crystallization on the tissue. The combination of MALDI-TOF and IMS has been used in a wide variety of applications.26–29 In a recent report, Kim et al. used IMS to investigate the distribution of melamine on the kidney tissue of the rat fed with a mixture of melamine and cyanuric acid.30 It was found that when a high dose of melamine/cyanuric acid was ingested by the rat, melamine-related renal crystals were formed in the kidney.
However, no study on the effects of melamine and cyanuric acid alone on the formation of renal crystal in the rat kidney was performed. In this study, we employed MALDI-TOF-based IMS to visualize the distribution of melamine in rat kidney sections. The samples were obtained from the kidneys of three groups of rats fed with high doses of melamine alone, cyanuric acid alone, and a mixture of melamine and cyanuric acid, respectively. Histological staining including von Kossa and H&E stain were performed to confirm the results of the MALDI-TOF-based IMS analysis. In addition, lipid imaging of rat kidney tissue was obtained and used to study the relationship between the formation of melamine-related calculi and lipid distribution.
Experimental
Chemicals
All HPLC-grade solvents were purchased from Merck (KGaA, Darmstadt, Germany) and used without further purification. The MALDI matrices 2,5-dihydroxybenzoic acid (2,5-DHB) and sinapinic acid (SA) were obtained from Fluka (Schnelldorf, Germany); 4-hydroxy-α-cyanocinnamic acid (α-CHC) and the cyanuric acid were obtained from KASEI (TCI, Tokyo, Japan). The melamine standard was purchased from HSE Pure Chemicals (Kaohsiung, Taiwan). Trifluoroacetic acid (TFA) was purchased from Merck (Schuchardt, Hohenbrunn, Germany). Gill's hematoxylin and eosin (H&E) was purchased from Muto Pure Chemicals (Tokyo, Japan).Animals
Sprague–Dawley rats (weight: ca. 600 g) were acquired from Kaohsiung Medical University (Kaohsiung, Taiwan). Food and drinking water were provided ad libidum throughout the experimental period. All chemicals fed to the rats were dissolved in olive oil. The control rat was orally fed with olive oil (10 mL day−1) for 3 days (O3). Melamine (M3) and cyanuric acid (C3) were individually fed to the rats at 100 mg day−1 for 3 days. A mixture of melamine and cyanuric acid was fed to the rats via gavage feeding at 100 mg day−1 for each chemical for 3 days (MC3).Tissue preparation
Rats were euthanized at 16 h after the final dosing regimen by an overdose of isoflurane. The kidneys were rapidly dissected, frozen in isopentane pre-chilled at −80 °C for 10 to 15 s, wrapped in aluminium foil, and stored at −80 °C until required. The kidneys were cut into 16 μm sections by a cryostat (Leica 3050, Nossloch, Germany), thaw-mounted onto the stainless steel target inserts, and then stored at −80 °C until needed. Prior to matrix deposition, the tissue was placed in a −20 °C freezer for 30 min, then transferred to a desiccator for 1 h for drying and equilibrating to room temperature.Matrix application
An air brush (RICH series, AB-200, Taiwan) propelled with nitrogen was used to spray the matrix solution onto the tissue. A homemade sample carrier was used to position the stainless steel MALDI target plates containing the tissue sections. For imaging experiments, the matrix solution was made of 2,5-DHB (50 mg mL−1) in 50% acetonitrile containing 0.1% TFA. For profiling experiments, SA, 2,5-DHB, or α-CHC were used as the MALDI matrices. All the matrix solutions (20 mg mL−1) for profiling were prepared in 70% acetonitrile containing 0.1% TFA.Mass spectrometry
All imaging results were acquired using an Autoflex III TOF/TOF instrument (Bruker Daltonics, Billerica, MA) equipped with a solid state Smartbeam laser (355 nm; 3 ns pulse duration) operating at 200 Hz. The mass spectrometer was operated under positive reflectron mode at an acceleration voltage of 19 kV. Spectra were recorded over m/z 100–1000 range. A total of 500 spectra were acquired for each spot. The profiling spectra were collected in 1000 shots at 100 Hz. The lateral resolution of the tissue was set at 150 μm for both the horizontal and vertical direction. The results were visualized and analyzed using the proprietary imaging software FlexImaging 2.0. (Bruker Daltonics).Histological staining of the tissue
Von Kossa and Hematoxylin and Eosin (H&E) stains were performed to observe the calculi accumulated in the renal tissues. For von Kossa stain, the tissues were deparaffinized and hydrated in distilled water, then incubated in 5% silver nitrate for 60 min. The slides were rinsed in water, followed by incubation in sodium thiosulfate for 2 min. Thereafter, the slides were rinsed with distilled water again, and counterstained with Nuclear-Fast Red for 5 min. Dehydration was performed sequentially in 95% and 100% ethanol. For H&E stain, fresh tissue sections were placed on a glass plate and rinsed in 95% ethanol for 30 s. The tissue sections were incubated in the hematoxylin for 30 s and then rinsed in water for 1 min, followed by soaking in eosin solution for 10s, then rinsed sequentially in 95% and 100% ethanol.Results and discussion
In previous studies, calculi have been found in rat kidneys whose food has been adulterated with melamine.11,31 In this study, we examined the kidney sections stained with von Kossa and H&E staining method, respectively. Von Kossa stain is commonly used to demonstrate deposits of calcium or calcium salt on tissue. Tissue sections are treated with silver nitrate solution, the calcium is reduced by the strong light and replaced with silver deposits, visualized as metallic silver. H&E stain is used to observe melamine-related crystals in the renal tissues. In this technique, positively charged metal-hematein complexes bind to the negatively charged phosphate remains of the cell nucleus-DNA in an acid milieu. This colors nuclei of cells and a few other objects blue.32,33Fig. 1 shows the photomicrograph of kidney section from rats fed with vehicle, melamine, cyanuric acid, and the mixture of melamine and cyanuric acid, for three days. We observed calculi only in the kidney section of rats that had been fed with a mixture of melamine and cyanuric acid. (Fig. 1d). No obvious kidney damage was noticed in other treatment groups. Our histological examination indicated that oral consumption of melamine or cyanuric acid alone did not induce the formation of calculi in rat kidney within the testing period of this study. This finding is consistent with those in previous reports.10,11,34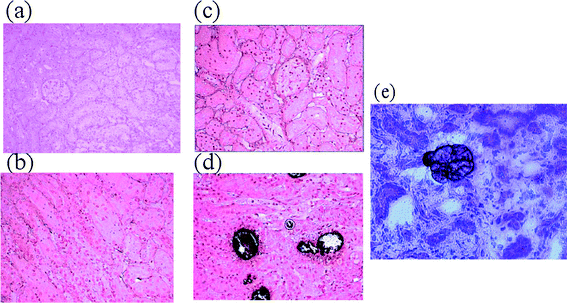 | ||
| Fig. 1 Photomicrographs of rat kidney sections. (a)-(d): von Kossa stain, (e): H&E stain. Rat was fed with (a) vehicle (O3), (b) melamine (M3), (c) cyanuric acid (C3), (d) a mixture of melamine and cyanuric acid (MC3), for 3 days; and (e) H&E stain of a kidney section from the rat orally fed with MC3. Rat kidneys were collected 16 h after final dosing. The dark particles shown in (d) and (e) indicated the calculi and melamine-related crystals, respectively. | ||
In addition to the detection of calculi (see dark particles in Fig. 1d), we observed severe interstitial edema and hemorrhages in the kidney section of rats that had been fed with a mixture of melamine and cyanuric acid (Fig. 1d), suggesting that the presence of calculi in the distal tubules would induce peritubular inflammation. The H&E-stained sections from the same kidney further confirmed the inflammatory state of the kidney, based on the observation of cell morphology similar to the interstitial cells of renal tissue (Fig. 1e). The presence of interstitial cells on tissues has been used previously as an indication of inflammation in physiological studies.35
To determine a suitable matrix for characterizing melamine, we accessed the suitability of three different MALDI matrices, SA, 2,5-DHB, and α-CHC, for the profiling and imaging tasks. It was found when clear solutions of melamine and cyanuric acid were mixed together, numerous suspended crystallites were formed and the solution became turbid. Such a solution was then used to determine the best matrix for MALDI/TOF analysis in the positive-ion mode. No melamine ion signal was detected when using SA as the matrix (Fig. 2a). However, the molecular ion of melamine (MH+, m/z 127) was detected when using α-CHC or 2,5-DHB as the matrix. Noticeably the intensity of this ion signal was three times stronger on the mass spectra using 2,5-DHB as matrix than that of α-CHC (by comparing Fig. 2b with c). Since 2,5-DHB has also been reported as an effective MALDI matrix for the analysis of melamine in urinary samples and lipids from various biological samples, including kidneys;22,35,36 we then choose it as the matrix for subsequent IMS analysis in this study. In addition, we also detected cyanuric acid ions in the negative-ion mode using 2,5-DHB as the matrix. (MH−, m/z 128; Fig. 2d). No melamine/cyanuric acid cluster ions were detected either in positive- or negative-ion modes.
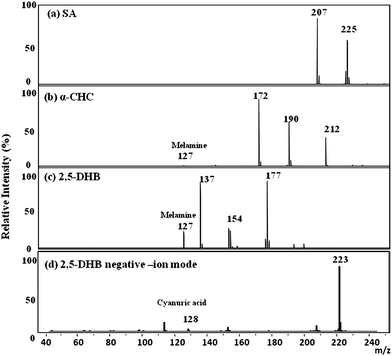 | ||
| Fig. 2 Positive-ion MALDI mass spectra of a mixture of melamine and cyanuric acid (10−5 M each) and a MALDI matrix: (a) SA, (b) α-CHC, and (c) 2,5-DHB containing 0.1% TFA (m/z 127, MH+ of melamine). (d) Negative-ion MALDI mass spectrum of cyanuric acid (10−5 M) using 2,5-DHB as the MALDI matrix (m/z 128, MH− of cyanuric acid). | ||
A profiling study was first performed on the kidney sections from a rat fed with melamine/cyanuric acid mixture for 3 days. Regions of sampling was randomly decided, and spotted with 2,5-DHB. (Fig. 3a). The predominant ion signals located between m/z 100 to 1000 arose mainly from the fragments or clusters of the matrix-related ions. An expanded view of the mass spectrum across m/z 100 to m/z 150 clearly reveals the signal of the melamine-like ions (Fig. 3b). A heme B ion signal (m/z 616) is evident on the mass spectrum in Fig. 3c since the residual blood in the vessels was not removed or washed out by perfusion. A series of lipid-like ion signals is also present in the MALDI mass spectrum in Fig. 3c. The identities of those ions have been reported elsewhere.37
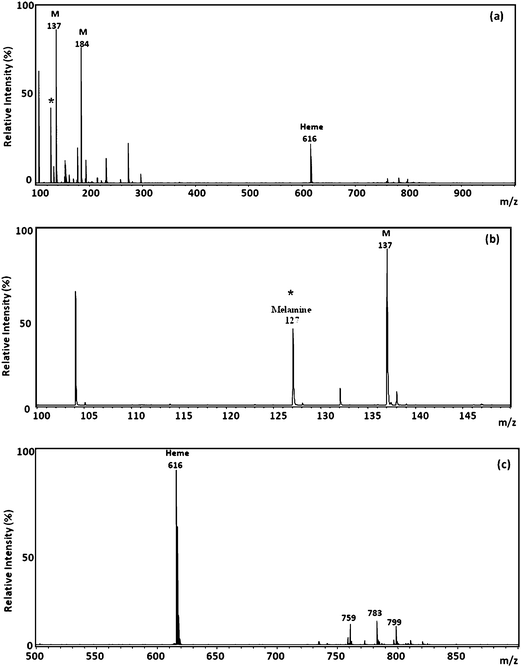 | ||
| Fig. 3 (a) Positive-ion MALDI mass spectra of kidney samples from rats that had been orally administered with a mixture of melamine and cyanuric acid for 3 days. (b) Partial MALDI mass spectra (m/z 100–150). (c) Partial MALDI mass spectra (m/z 500–900). M: matrix ion. | ||
To further confirm the assignment of the ion signal at m/z 127, we compared the MS/MS spectra of the m/z 127 precursor from the kidney section and that from the melamine standard. Fig. 4 shows the MS/MS spectrum of m/z 127 ion detected from the melamine standard, normal control renal section deposited with 0.5 μL melamine standard solution (10−5 M), and the kidney section of rats fed with melamine/cyanuric acid, respectively. All three spectra show two common fragment ions at m/z 111.4 and m/z 84.8, which confirm the identity of the m/z 127 signal to be from melamine ion. The structures of these fragments have been proposed previously by Heller et al.38
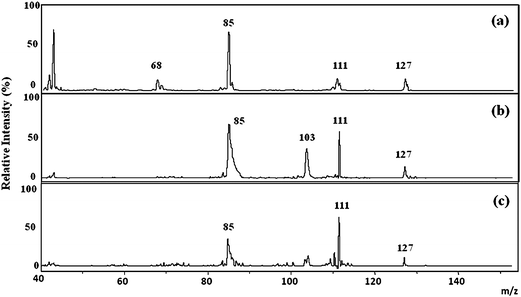 | ||
| Fig. 4 MS/MS spectra of m/z 127 signal from (a) the 10−5 M melamine standard solution, (b) the control renal tissue spiked with the melamine standard solution, and (c) the renal tissue from a rat that had been orally fed with a mixture of melamine and cyanuric acid for 3 days. | ||
To determine the limit of detection (LOD) of melamine in tissue, we first spiked various concentrations of melamine solution (10−2–10−7 M) on the tissue sections collected from a normal rat. 2,5-DHB was then applied to the tissue after air-drying. Such melamine-spiked sections were then examined using MALDI/TOF/TOF. We only detected melamine molecular signal when the concentration of the spiked melamine solution is greater than 1.0 × 10⁻⁶ M (Fig. 5b–e). Thus, the LOD for melamine on the rat kidney section was estimated to be below 1.0 × 10⁻⁶ M by MALDI/TOF/TOF technique.
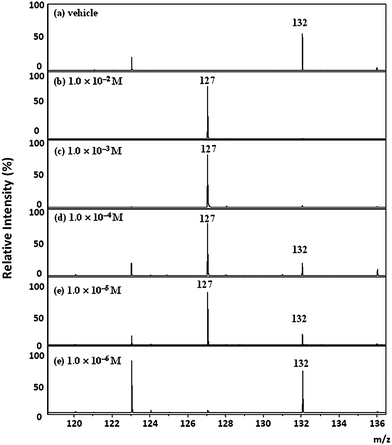 | ||
| Fig. 5 MALDI spectra of the normal renal tissue spiked with vehicle and melamine solutions. (a) Vehicle, (b) 1.0 × 10⁻² M, (c) 1.0 × 10⁻³ M, (d) 1.0 × 10⁻⁴ M, (e) 1.0 × 10⁻⁵ M, (f) 1.0 × 10⁻⁶ M. | ||
Fig. 6 and 7 display the results of the molecular imaging of the renal tissues collected from rats fed with melamine and/or cyanuric acid. Fig. 6a presents a photograph of a sectional view of a kidney. To ensure that the MALDI mass spectra were of good quality throughout the IMS analysis, one of the matrix ion signals at m/z 177 ([2,5-DHB + Na]+) was monitored continuously. Fig. 6b–e display the images obtained from the signal at m/z 177 for various renal tissue samples. Strong signals for the ion at m/z 177 were always obtained outside the tissue, as indicated by the bright white ring surrounding the tissue in these molecular images. The intensity of the ions at m/z 177 recorded from the inside of the tissue was much weaker than that outside of the tissue, as indicated by the darker color in these regions. We suspect that the molecules of the matrix 2,5-DHB did not crystallize as well when applied within the tissue as they did outside the tissue area. The formation of appropriate matrix crystals within the tissue might have been inhibited either by the presence of large amounts of hydrophobic lipids on the tissue or by the nature of the uneven and rough tissue surface structure. The only tissue area exhibiting a strong signal for the ion at m/z 177 was renal papilla, presumably because it induced the formation of suitable 2,5-DHB crystals.
![(a) Photograph of a rat kidney (b–e). IMS images generated from the signal at m/z 177 [matrix + Na]+ for renal samples from (b) a control rat, (c) a rat orally administered with melamine for 3 days, (d) a rat orally administered with cyanuric acid for 3 days, and (e) a rat orally administered with a mixture of melamine and cyanuric acid for 3 days. A color scale ranging from 0 to 30% is presented on the left of (e). The scale is obtained by comparing the intensity of the ion peak with the base peak on the MALDI mass spectrum.](/image/article/2010/AY/c0ay00266f/c0ay00266f-f6.gif) | ||
| Fig. 6 (a) Photograph of a rat kidney (b–e). IMS images generated from the signal at m/z 177 [matrix + Na]+ for renal samples from (b) a control rat, (c) a rat orally administered with melamine for 3 days, (d) a rat orally administered with cyanuric acid for 3 days, and (e) a rat orally administered with a mixture of melamine and cyanuric acid for 3 days. A color scale ranging from 0 to 30% is presented on the left of (e). The scale is obtained by comparing the intensity of the ion peak with the base peak on the MALDI mass spectrum. | ||
![IMS images generated from the signal at m/z 127 [melamine + H]+ for renal samples from (a) a rat fed with vehicle (olive oil), (b) a rat fed with melamine for 3 days, (c) a rat fed with cyanuric acid for 3 days, and (d) a rat fed with a mixture of melamine and cyanuric acid for 3 days.](/image/article/2010/AY/c0ay00266f/c0ay00266f-f7.gif) | ||
| Fig. 7 IMS images generated from the signal at m/z 127 [melamine + H]+ for renal samples from (a) a rat fed with vehicle (olive oil), (b) a rat fed with melamine for 3 days, (c) a rat fed with cyanuric acid for 3 days, and (d) a rat fed with a mixture of melamine and cyanuric acid for 3 days. | ||
The rat kidney comprises three parts: the cortex, medulla, and papilla (Fig. 6a). Initial renal filtrate is formed at Bowman's capsule. The filtered substance in the filtrate is reabsorbed along the ductal system of the nephrons that expand across cortex and medulla. Wastes and water are eliminated into renal pelvis through renal papilla and finally to the bladder. We expect the cortex to be the most sensitive region to the effects of the toxicant since it receives approximately 90–95% of the blood flow to kidneys. The imaging of melamine ions (MH+, m/z 127) revealed strong signals in the renal tissues collected from the rats that had been fed with melamine (Fig. 7b) and melamine/cyanuric acid (Fig. 7d). In contrast, only trace amounts of m/z 127 signal was seen in the renal tissues collected from the normal controls (Fig. 7a) and from the rats administered orally with cyanuric acid (Fig. 7c). The results suggest that no crystal will be formed in the kidney if melamine or cyanuric acid alone is ingested by the rat. It is only when the rat is orally administered with a large does of melamine/cyanuric acid mixture, renal crystal will be induced. The results agree well with several previous studies.7,8,30
In addition, the distribution of melamine ions in tissues of the rats orally administered with melamine alone was obviously different from that of the rats orally administered with melamine/cyanuric acid. Because renal excretion occurs from the cortex to the papilla through glomerular filtration, the tissues of the rats orally administered with melamine revealed that the melamine ions were located mostly in the papilla region (Fig. 7b), thereby indicating that the melamine molecules had moved from the cortex to the papilla and would soon pass through the ureter to the bladder. This finding is consistent with prior reports stating that melamine is excreted unchanged from rats within 24 h of oral administration.39 In contrast, we observed strong signals for melamine ions in the papilla, cortex, and medulla regions of the tissues of rats orally administered with melamine/cyanuric acid (Fig. 7d), indicating that melamine had accumulated throughout the rat kidney. This result is consistent with a recent report testifying that melamine appeared diffusely throughout the renal cortex and medulla, and melamine related crystals were formed along the osmotic gradient of the kidney.30 Because we observed calculi in the renal tissue (Fig. 1d), we suspect that melamine and cyanuric acid combined to form fine precipitates (or calculi) during the reabsorption of water in the cortex and medulla. Excretion of melamine/cyanuric acid precipitates from the kidneys is much more difficult than that of melamine alone. Nevertheless, we still detected a stronger melamine ion signal in the papilla than in the cortex or medulla (Fig. 7d), indicating that some soluble melamine molecules were transferred to the bladder for further metabolism.
Using this approach, we also obtained MALDI images based on other ion signals such as those from lipids. For instance, the images obtained after detecting at m/z 741, 798, and 820 revealed that different lipids were abundant in different regions. Because the calculi formed in the renal tubules would block the nutrition pathway, they might also disturb the metabolism of the kidney cells. Nevertheless, comparison of the images (Fig. 8) generated from the renal tissues of the normal controls with those of the rats orally administered with melamine/cyanuric acid revealed that the distribution of the various lipids on the tissues were very similar, regardless of their distribution in the cortex (m/z 798), medulla, or pelvis (m/z 820 and 741). These imaging results suggest that there is no direct relationship between renal calculi and lipids.
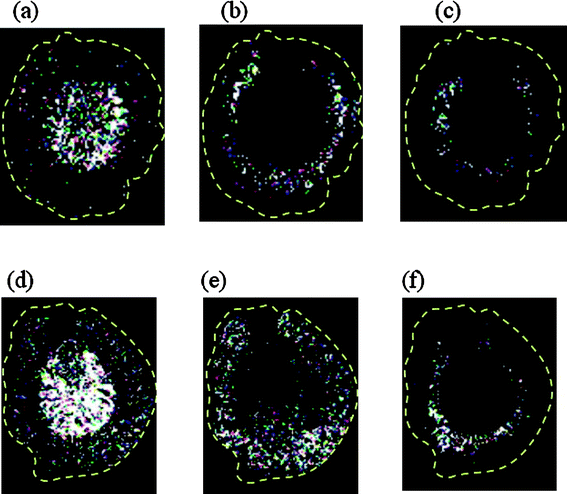 | ||
Fig. 8 IMS images generated from rat renal samples from the control (a–c) and MC3 (d–f) groups with detected at (a, d) m/z 798 (PC34:1 + K), (b, e) m/z 820 (PC 36![[thin space (1/6-em)]](https://www.rsc.org/images/entities/char_2009.gif) : :![[thin space (1/6-em)]](https://www.rsc.org/images/entities/char_2009.gif) 4 + K), and (c, f) m/z 741 (SM 16 4 + K), and (c, f) m/z 741 (SM 16![[thin space (1/6-em)]](https://www.rsc.org/images/entities/char_2009.gif) : :![[thin space (1/6-em)]](https://www.rsc.org/images/entities/char_2009.gif) 0 + K). 0 + K). | ||
Conclusion
In this study, we demonstrate that MALDI-TOF is a useful tool for detecting the distributions of melamine on renal tissues from rats administered orally with melamine and cyanuric acid under various conditions. We found that melamine accumulated only in the kidneys of rats that had been orally administered with high doses of melamine/cyanuric acid for 3 days. The MALDI imaging of the renal tissue revealed that melamine was evenly distributed in the cortex and medulla, but a relatively intense melamine ion signal appeared from the papilla, indicating that the calculi formed by melamine and cyanuric acid might block their elimination from the kidneys. Our imaging results for these rat renal tissues are consistent with prior reports and histology observations. For rats orally administered with melamine alone, we detected melamine ion signals only in the papilla, indicating the elimination of melamine via the kidneys. No melamine ion signals were detected in the kidneys of rats orally administered with cyanuric acid alone. We observed no differences between in the lipid distributions in the renal tissues of the control rats and those administered with melamine/cyanuric acid, suggesting that the presence of calculi might not affect lipid growth.Acknowledgements
The authors would like to thank the National Science Council of Taiwan, National Sun Yat-Sen University—Kaohsiung Medical University Joint Research Center, and Cancer Center, Kaohsiung Medical University Hospital for financial support of this study.References
- S. L. Rovner, Chem. Eng. News., 2008, 86, 41–43.
- B. N. Tran, R. Okoniewski, R. Storm, R. Jansing and K. M. Aldous, J. Agric. Food Chem., 2010, 58, 101–107 CrossRef CAS.
- Y. He, G. P. Jiang, L. Zhao, J. J. Qian, X. Z. Yang, X. Y. Li, L. Z. Du and Q. Shu, World Journal of Pediatrics, 2009, 5, 118–21 Search PubMed.
- J. S. Chen, Chin. Med. J., 2009, 122, 243–244 Search PubMed.
- B. P. Arcement and H. N. Levy, J. Assoc. Off. Anal. Chem., 1988, 71, 611 CAS.
- C. J. Downes, J. W. Mitchell, E. S. Viotto and N. J. Eggers, Water Res., 1984, 18, 277–280 CrossRef CAS.
- R. Clark, J.S. Afr. Vet. Med. Assoc., 1966, 37, 349–351 Search PubMed.
- A. K. C. Hau, T. H. Kwan and P. K. T. Li, J. Am. Soc. Nephrol., 2009, 20, 245–250 CrossRef CAS.
- C. A. Brown, K. S. Jeong, R. H. Poppenga, B. Puschner, D. M. Miller, A. E. Ellis, K. I. Kang, S. Sum, A. M. Cistola and S. A. Brown, J. Vet. Diagn. Invest., 2007, 19, 525–531 Search PubMed.
- R. E. Cianciolo, K. Bischoff, J. G. Ebel, T. J. Van Winkle, R. E. Goldstein and L. M. Serfilippi, J. Am. Vet. Med. Assoc., 2008, 233, 729–737 CrossRef CAS.
- R. L. M. Dobson, S. Motlagh, M. Quijano, R. T. Cambron, T. R. Baker, A. M. Pullen, B. T. Regg, A. S. Bigalow-Kern, T. Vennard, A. Fix, R. Reimschuessel, G. Overmann, Y. Shan and G. P. Daston, Toxicol. Sci., 2008, 106, 251–262 CrossRef CAS.
- R. Reimschuessel, C. M. Gieseker, R. A. Miller, J. Ward, J. Boehmer, N. Rummel, D. N. Heller, C. Nochetto, G. K. H. de Alwis, N. Bataller, W. C. Andersen, S. B. Turnipseed, C. M. Karbiwnyk, R. D. Satzger, J. B. Crowe, N. R. Wilber, M. K. Reinhard, J. F. Roberts and M. R. Witkowski, Am. J. Vet. Res., 2008, 69, 1217–1228 CrossRef CAS.
- R. A. Yokley, L. C. Mayer, R. Rezaaiyan, M. E. Manuli and M. W. Cheung, J. Agric. Food Chem., 2000, 48, 3352–3358 CrossRef CAS.
- J. V. Sancho, M. Ibáñez, S. Grimalt, J. Pozo and F. Hernández, Anal. Chim. Acta, 2005, 530, 237–243 CrossRef CAS.
- S. F. Michael, R. T. Elizabeth, H. P. Robert, A. A. Linda and P. Birgit, Rapid Commun. Mass Spectrom., 2007, 21, 4027–4032 CrossRef CAS.
- L. Zhu, G. Gamez, H. Chen, K. Chingin and R. Zenobi, Chem. Commun., 2009, 559–561 RSC.
- G. Huang, Z. Ouyang and R. G. Cooks, Chem. Commun., 2009, 556–558 RSC.
- M. Karas and F. Hillenkamp, Anal. Chem., 1988, 60, 2299–2301 CrossRef CAS.
- T. Koichi, W. Hiroaki, I. Yutaka, A. Satoshi, Y. Yoshikazu, Y. Tamio and T. Matsuo, Rapid Commun. Mass Spectrom., 1988, 2, 151–153 CAS.
- A. K. Su, J. T. Liu and C. H. Lin, Talanta, 2005, 67, 718–724 CrossRef CAS.
- B. Fuchs and J. Schiller, Eur. J. Lipid Sci. Technol., 2009, 111, 83–98 CrossRef CAS.
- L. H. Lo, L. T. Huang and J. Shiea, Rapid Commun. Mass Spectrom., 2009, 23, 589–598 CrossRef CAS.
- J. Shiea, Y. T. Cho, Y. H. Lin, C. W. Chang, L. H. Lo, Y. C. Lee, H. L. Ke, W. J. Wu and D. C. Wu, Rapid Commun. Mass Spectrom., 2008, 22, 3754–3760 CrossRef CAS.
- S. Y. Lin, S. H. Shih, D. C. Wu, Y. C. Lee, C. I. Wu, L. H. Lo and J. Shiea, Rapid Commun. Mass Spectrom., 2007, 21, 3311–3316 CrossRef CAS.
- H. W. Tang, K. M. Ng, S. S. Y. Chui, C. M. Che, C. W. Lam, K. Y. Yuen, T. S. Siu, L. C. L. Lan and X. Che, Anal. Chem., 2009, 81, 3676–3682 CrossRef CAS.
- D. H. Kristen, R. O. Stacey and M. C. Richard, Semin. Nephrol., 2007, 27, 597–608 CrossRef.
- R. M. Caprioli, T. B. Farmer and J. Gile, Anal. Chem., 1997, 69, 4751–4760 CrossRef CAS.
- S. Khatib-Shahidi, M. Andersson, J. L. Herman, T. A. Gillespie and R. M. Caprioli, Anal. Chem., 2006, 78, 6448–6456 CrossRef CAS.
- M. R. Groseclose, A. Malin, M. H. William and M. C. Richard, J. Mass Spectrom., 2007, 42, 254–262 CrossRef.
- C. W. Kim, J. W. Yun, I. H. K. Bae, H. J. Kang, K. M. Joo, H. J. Jeng, J. S. Lee, J. H. Chung, Y. H. Park and K. M. Lim, Chem. Res. Toxicol., 2010, 23, 220–227 CrossRef CAS.
- M. E. Thompson, M. R. Lewin-Smith, V. F. Kalasinsky, K. M. Pizzolato, M. L. Fleetwood, M. R. McElhaney and T. O. Johnson, Vet. Pathol., 2008, 45, 417–426 CrossRef CAS.
- V. Kossa, Path. Anat, 1901, 29, 163–202 Search PubMed.
- H. Puchtler, S. N. Meloan and F. S. Waldrop, Histochemistry, 1986, 85, 353–364 CrossRef CAS.
- B. Puschner, R. H. Poppenga, L. J. Lowenstine, M. S. Filigenzi and P. A. Pesavento, J. Vet. Diagn. Invest., 2007, 19, 616–624 Search PubMed.
- J. Schiller, R. Suss, B. Fuchs, M. Muller, M. Petkovic, O. Zschornig and H. Waschipky, Eur. Biophys. J. Biophys. Lett., 2007, 36, 517–527 Search PubMed.
- S. Shimma, Y. Sugiura, T. Hayasaka, N. Zaima, M. Matsumoto and M. Setou, Anal. Chem., 2008, 80, 878–885 CrossRef CAS.
- E. Astigarraga, G. Barreda-Gomez, L. Lombardero, O. Fresnedo, F. Castano, M. A. T. Giralt, B. A. Ochoa, R. Rodriguez-Puertas and J. A. Fernandez, Anal. Chem., 2008, 80, 9105–9114 CrossRef CAS.
- N. H. David and B. N. Cristina, Rapid Commun. Mass Spectrom., 2008, 22, 3624–3632 CrossRef CAS.
- R. W. Mast, A. R. Jeffcoat, B. M. Sadler, R. C. Kraska and M. A. Friedman, Food Chem. Toxicol., 1983, 21, 807–810 CrossRef CAS.
| This journal is © The Royal Society of Chemistry 2010 |
