Multivariate curve resolution of voltammetric data for Ni-tartarate complexation system with both labile and inert behaviour
Karim
Asadpour-Zeynali
* and
Javad
Vallipour
Department of Analytical Chemistry, Faculty of Chemistry, University of Tabriz, Tabriz, 51666 16471, Iran. E-mail: asadpour@tabrizu.ac.ir; k.zeynali@gmail.com; Fax: +98 411 3340191; Tel: +98 411 3393113
First published on 12th October 2010
Abstract
The complexation between Ni2+ and tartarate, in TRIS buffer, which forms successive complexes, was studied by differential pulse polarography (DPP) and multivariate cure resolution (MCR). This system shows both electrochemically inert and labile attribute. It is very difficult, if not impossible, to analyze such systems by conventional and classical methods. Experimental data were obtained by DPP for different metal-to-ligand ratio at pH = 7.5. This procedure was done by adding appropriate volume of tartarate solution to a metal ion solution with constant concentration of Ni2+. The complex formation constants obtained by resolving the data matrix by soft modeling approach and those obtained by conventional method were compared, and there was no significant difference between them. Although the condition of linearity of the current data with respect to the concentrations is not totally fulfilled, but the results show the variation from linearity for the studied system is small and can be neglected. Thus, the MCR provided good estimations for the stability constants of complexation process, and is suitable for use as a complementary tool on the study of systems with both successive inert and labile complexes.
Introduction
Tartaric acid is a white crystalline diprotic organic acid. It occurs naturally in many plants, particularly grapes, bananas, and tamarinds, and is one of the main acids found in wine. It is added to other foods to give a sour taste, and is used as an antioxidant. Salts of tartaric acid are known as tartrates. It is a dihydroxy derivative of succinic acid.1–3 Tartaric acid, tartarate salts and many tartarate derivatives are widely used in chemical science and food industries, which consist of preparation of chiral phases for chromatographic purposes,4–6 electrochemical processes,7–10 application as an additive in beverage industries1–3 and some other uses.11–14 So study of their reactions and their chemical characteristics may be valuable. Use of complexation reactions for determination of species concentration, masking and extraction is usual in chemical procedures, and needs sufficient knowledge about their thermodynamic and kinetic properties. The stability constants of complexes play an important role in a chemist's interpretations about the chemical systems. Most of the conventional methods of calculating the stability constants involve fitting data on a physicochemical model,15–18 which are known as hard modeling methods, notwithstanding the ways that data are obtained, like potentiometric, spectroscopic or polarographic methods. The soft modeling approaches, which are sometimes named model free methods, are another group of methods which have been used broadly in several chemical procedures in recent years. These methods do not need information about the chemical or mathematical model of the chemical procedures.19 In the last two decades a noticeable amount of the use of soft modeling approaches in the chemical or biochemical systems with complexation reactions were reported.Study of the interactions between metal ions and ligands has been done by different techniques, voltammetric techniques are one of the widely used methods for this purpose. The investigations consist of a variety of ligands, especially those of environmental interests such as humic acids, polycarboxylic acids, or some polysaccharides.15–18 Voltammetric techniques, such cyclic voltammetry, linear sweep voltammetry, differential pulse voltammetry and polarographic methods, can yield helpful information about the physicochemical properties of the metal complexes. Furthermore, some sensitive voltammetric techniques, such as differential pulse polarography (DPP), are reliable at very low concentrations, much lower than those used in classical spectrophotometric and potentiometric investigations.
Tauler et al.20 proposed a soft modeling method, multivariate curve resolution (MCR), as a tool to get as much information as possible from any data sets which were very difficult, if not impossible, to interpret in the past. This procedure is based on the use of a family of computational and statistical techniques which are based on factor analysis (FA) and concerned with the resolution of the sources of variation in an experimental data set. The use of multivariate curve resolution-alternating least square (MCR-ALS) for spectroscopic21–25 data and chromatographic peaks26–30 were considered widely. The application of this method to voltammetric data was also developed in the last few years.31–34
The Ni-tartarate complexation system, which forms both inert and labile (i.e., the association–dissociation kinetic of the complex is much faster than the voltammetric measurement) complexes, was investigated in this work. Because of the nature of this system and limits of conventional methods, only the first stability constant of this complexation system was calculated by a conventional method, whilst the soft modeling approach yields two successive complexation constants. The results obtained by MCR-ALS were compared with those achieved by the conventional method.15 Regarding the technical problems for applying conventional methods to complexation systems with a complicated nature, the soft modeling approaches could be appropriate complementary methods for conventional ones and more researches in this field were purposed.
Theory and data treatment
The conventional method for investigation of an inert complexation process is very simple and consists of the evaluation of the variation in peak heights of polarograms and relates them to the concentration of each species and finally calculates the stability constants by mass action law.15–17 | (1) |
In this equation I0 and I are the currents recorded in the absence and presence of ligand in solution, respectively. Brackets show each species concentration and β, M, L denote the complex formation constant, metal ion and ligand, respectively.
For totally labile systems, the DeFord-Hume method15,17 is one of the widely used methods. It is based on the effect of complexation on the voltammograms.
 | (2) |
For complexation systems with complicated behaviors (same as the case, studied in this work) two mentioned methods are unable to determine all stability constants and usually some of them can be calculated.
In this work the MCR-ALS was used for the bilinear decomposition of experimental data matrix, D, to obtain a product of two abstract matrices, C and ST denoted as pure concentration profiles and unitary signals, respectively, for a preselected number of components which contribute to the measured signal.
| D = CST + E | (3) |
Fig. 1. shows the procedure of applying the MCR-ALS for voltammometric data, which was used in this work. Each step is explained in the following details.
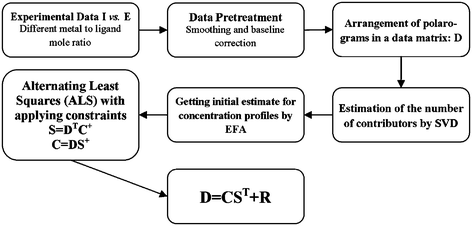 | ||
| Fig. 1 Flow chart for soft-modeling method applied to voltammetric data obtained by titration of metal solution with ligand solution in TRIS buffer media with pH = 7.5. D: experimental data matrix, C: concentration matrix of the individual species, and S: voltammetric matrix of the individual species. | ||
Some homemade programs were used for smoothing and baseline correction. In order to smooth the voltammograms, the running mean smoother and running polynomial smoother methods (Savitzki-Golay) were applied.35 Baseline correction was done by a point-by-point subtraction of the background current (obtained for supporting electrolyte) from the total currents (obtained in the presence of the studied system). This charging current subtraction assumes that the electrode double-layer capacitance does not change greatly in the presence of the test compound.
To use the MCR-ALS, signals should be linearly related to the concentration of analytically active species present in the investigated system (bilinearity). This condition is poorly observed in labile complexation systems, yet there are many papers that neglected the nonbilinearity condition in the data,36,37 so we follow this assumption during data analysis.
Detection of the number of components is a main step in the soft modeling approach which affects the final results of each analysis. The magnitude of singular values and the ratio of two successive singular values were used to decide about the number of chemical contributions. To select an appropriate number of components, the magnitude of residuals, expressed as a percentage of lack of fit (lof), after a particular number of principal components is calculated; also percent of variance (R2) is calculated according to the following expressions:
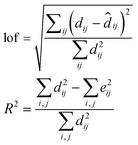 | (4) |
An initial estimation of concentration profiles was obtained by evolving factor analysis (EFA)38 which can provide an overview about the structure of data along the experiment, and the data matrix decomposition was carried out using an alternating least squares (ALS) optimization. Constrained ALS optimization was started with initial estimation for concentration profiles to try to recover the correct set of concentration profiles and pure individual voltammetric responses.
In this process the best least squares estimation of the voltammetric contributions is estimated from:
| S = DTC+ | (5) |
Experimental
Reagents
All reagents were of analytical grade and obtained from Merck. Stock solution of Ni2+ with the concentration of 0.1mol l−1 was prepared by dissolving NiCl2·6H2O in distilled water, respectively. Working solution (with the concentration of 1 × 10⁻⁵mol l−1) was prepared by successive dilutions of corresponding stock solution by distilled water and finally by TRIS buffer solution. Tartarate solution was prepared directly by dissolving appropriate weight of tartaric acid in buffer solution. Buffer solution with the pH = 7.5 and 0.1mol l−1 ionic strength was prepared by dissolving appropriate weights of TRIS (tris(hydroxymethyl)aminomethane) and TRIS-HCl in distilled water. This pH value was considered to avoid formation of metal hydroxides and to lessen interference of protons on tartarate.Apparatus
In this work, polarographic measurements were carried out with a metrohm 757 VA computrace stand connected to a personal computer using metrohm software. The reference electrode and the counter-electrode were Ag-AgCl (3mol l−1, Metrohm) and Pt (Metrohm), respectively. A Dropping mercury electrode (DME) was used as working electrode for polarography. Initial oxygen purging was done for 300s by nitrogen in each titration. DPP was done with drop time of 0.8s, scan rate of 12mV s−1, pulse time of 40ms and pulse amplitude of −50mV. Potential was swept between −0.6 to −1.3 V in negative direction. A Metrohm glass cell was used in all polarographic measurements.Software
All data analysis was done in Matlab. The user friendly program of MCR-ALS39 was used and in other cases like data smoothing and EFA some homemade programs were applied.Results and discussion
Polarographic titration of 1 × 10⁻⁵mol l−1 Ni2+ with tartarate solution at pH = 7.5 and ionic strength of 0.1mol l−1 was done and data were recorded in potential range of −0.6 to −1.3V. During the titration process the total concentration of ligand was varied between 1 × 10⁻⁵–6.90 × 10⁻³mol l−1. Fig. 2 shows recorded polarograms for this complexation process. A decrease in the height of first peak in polarograms and appearance of another peak in more negative potentials after each addition of tartarate solution demonstrate formation of an electrochemically inert complex. The formation constant of such complex can be determined easily by seeking the peak height variations and connecting them to the species concentrations. So, the stability constant of the first complex (ML) can be calculated by the conventional method. When the formation of complexes with 1:n (n > 1) stoichiometry is started, the main problem occurs, and the negative shift in second peak position take place. This phenomenon makes this system very complicated to be analyzed by conventional hard modeling. MCR-ALS as a soft modeling approach that can be used for such systems. For this purpose the number of signal contributors should be denoted. According to the magnitude of singular values (SV) and the ratio of two successive SVs (Fig. 3) and the value of lof% (10.61, 3.94, 2.53 and 1.97% for two to five components, respectively) (Fig. 4b) and also the value of explained variances with different numbers of contributors (Fig. 4a), three components were selected for this system.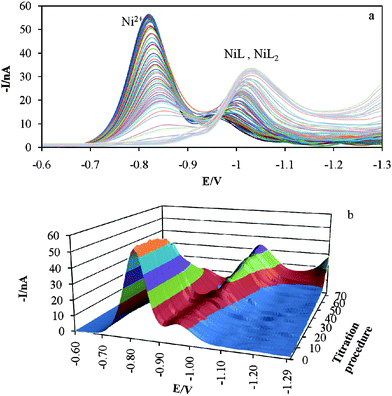 | ||
| Fig. 2 Differential pulse polarograms obtained for the titration of a 10−5mol l−1 Ni2+ solution by tartarate at pH = 7.5 and 0.1mol l−1 ionic strength (a) two dimensional and (b) three dimensional plot. | ||
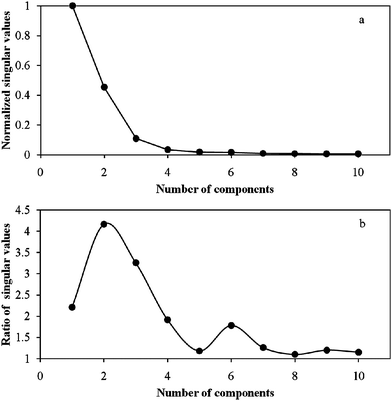 | ||
| Fig. 3 (a) Normalized singular values, (b) the ratio of two successive singular values for Ni-tartarate system data. | ||
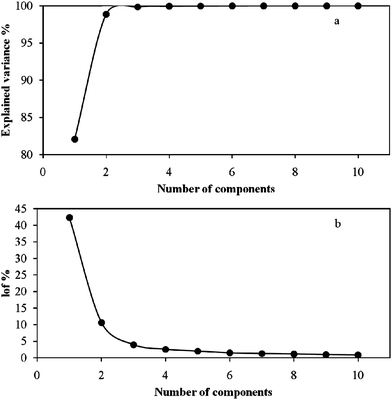 | ||
| Fig. 4 (a) Explained variance %, (b) the lof % values by considering a different number of components for Ni-tartarate system data. | ||
Data matrix was analyzed by MCR-ALS, and several constraints were applied, but the best results were obtained by applying the following constraints: non-negativity constraint for concentration profiles and pure voltammograms, unimodality and closure for concentration profiles, and equality constraint for the first row of concentrations (where the tartarate was not added to the solution and only free metal was present in the solution). Despite our theoretical and empirical knowledge about individual voltammograms, applying unimodality to them did not improve the results of analysis.
One of the resolved voltammograms (Fig. 5b) has two distinguishable maxima which can be because of non-bilinearity in data set which is in contrast to the linearity assumption in MCR-ALS method. Though, the value of forth SV is small enough and the non-bilinearity can be neglected. Thus, analysis of data by MCR-ALS can provide only an approximation for the real formation constants of Ni2+-tartarate complexes. Considering the inefficiency of hard modeling for such systems (by conventional method, only the first formation constant can be determined), achievement to an estimation for complexation parameters is useful.
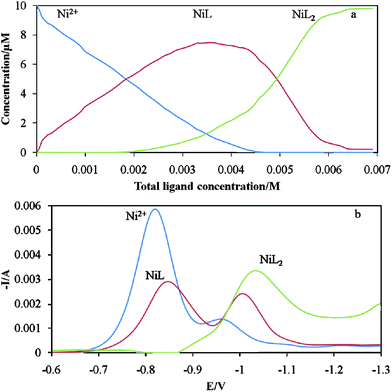 | ||
| Fig. 5 Results of resolving the data matrix (a) concentration profiles of three species during titration process (b) three unitary voltammograms. | ||
The concentration profiles obtained by ALS optimization were illustrated in Fig. 5a. These profiles were used to calculate the stability constants of formed complexes in the experiment condition. The results obtained by these two methods were reported in Table 1. These results show there are no significant differences between the two methods.
| MCR-ALS | Conventional method | |
|---|---|---|
| logβ1 | 2.7517 ± 0.1454 | 2.6586 ± 0.1301 |
| Logβ2 | 4.8822 ± 0.1873 | — |
Conclusions
The application of MCR-ALS provides good estimations for the concentration profiles and stability constants of complexation reactions. The ability of this method to analyse complicated complexation process, which conventional methods were incapable to analyze them, makes it an appropriate complementary method for conventional approaches. It should be considered according to the non-bilinearity in many data sets, the soft modeling approach only may be used as initial analysis and to get primary information about the complexation model.Acknowledgements
The authors acknowledge the financial support offered by the Research Affairs of the University of Tabriz.References
- M. Ash and I. Ash, Handbook of Food Additives, 3rd edn, Synapse Information Resources, Inc., 2008 Search PubMed.
- A. L. Branen, P. M. Davidson, S. Salminen and J.H.T. III, Food Additives, 2nd edn, Marcel Dekker, Inc., New York-Basel, 2002 Search PubMed.
- V. Emerton and E. Choi, Essential Guide to Food Additives 3rd edn, Leatherhead Food International Ltd., 2008 Search PubMed.
- E. Heldin, K. J. Lindner, C. Pettersson, W. Lindner and R. Rao, Chromatographia, 1991, 32, 407–416 CAS.
- O. Gyllenhaal and A. Karlsson, J. Biochem. Biophys. Methods, 2002, 54, 169–185 CrossRef CAS.
- Y. Cai, Z. H. Yan, M. Zi and L. M. Yuan, J. Liq. Chromatogr. Relat. Technol., 2007, 30, 1489–1495 CrossRef CAS.
- G. T. K. Fey, V. Subramanian and C. Z. Lu, Solid State Ionics, 2002, 152, 83–90 CrossRef.
- S. S. Abd El Rehim, A. A. Zaky and N. F. Mohamed, J. Alloys Compd., 2006, 424, 88–92 CrossRef CAS.
- R. K. Kvaratskhelia and E. R. Kvaratskhelia, Russian Journal of Electrochemistry, 2008, 44, 230–233 Search PubMed.
- M. Curioni, P. Skeldon, E. Koroleva, G. E. Thompson and J. Ferguson, J. Electrochem. Soc., 2009, 156, C147–C153 CrossRef CAS.
- Q. H. Sun and Y. L. Deng, Mater. Lett., 2008, 62, 1831–1834 CrossRef CAS.
- V. K. Gupta, S. Singh, H. R. Patil, M. V. Birajdar and N. P. Lad, Synth. React. Inorg., Met.-Org., Nano-Met. Chem., 2005, 35, 579–582 Search PubMed.
- V. B. Taxak, S. P. Khatkar, S. D. Han, R. Kumar and M. Kumar, J. Alloys Compd., 2009, 469, 224–228 CrossRef CAS.
- H. Gomez and O. Ozcan, Materials Science and Engineering a-Structural Materials Properties Microstructure and Processing, 2008, 475, 20–22 Search PubMed.
- D. R. Crow and J. V. Westwood, Polarography, Methuen and Co. Ltd., London, 1968 Search PubMed.
- J. Inczedy, Analytical Applications of Complex Equilibria, John Wiley & Sons Inc., 1976 Search PubMed.
- A. E. Martell and R. J. Motekaitis, Determination and Use of Stability Constant, 2nd edn, VCH Publishers Inc., 1992 Search PubMed.
- M. R. Wright, An Introduction to Aqueous Electrolyte Solutions, John Wiley & Sons Ltd., 2007 Search PubMed.
- S. D. Brown and R. S. Bear Jr., Crit. Rev. Anal. Chem., 1993, 24, 99–131 CAS.
- R. Tauler, B. Kowalski and S. Fleming, Anal. Chem., 1993, 65, 2040–2047 CrossRef CAS.
- J. Blobel, P. Bernado, D. I. Svergun, R. Tauler and M. Pons, J. Am. Chem. Soc., 2009, 131, 4378–4386 CrossRef CAS.
- N. Fillipan, E. Bezemer, J. Burke and S. C. Rutan, Appl. Spectrosc., 2004, 58, 1187–1194 CrossRef CAS.
- J. Ghasemi, S. Ahmadi, A. I. Ahmad and S. Ghobadi, Appl. Biochem. Biotechnol., 2008, 149, 9–22 CrossRef CAS.
- C. A. Holden, S. S. Hunnicutt, R. Sanchez-Ponce, J. M. Craig and S. C. Rutan, Appl. Spectrosc., 2003, 57, 483–490 CrossRef CAS.
- A. Kudrev, R. Gargallo, A. Izquierdo-Ridorsa, R. Tauler and E. Casassas, Anal. Chim. Acta, 1998, 363, 119–132 CrossRef CAS.
- M. Hasani, M. Shariati-Rad and H. Abdollahi, Anal. Chim. Acta, 2009, 636, 175–182 CrossRef CAS.
- M. Shamsipur, R. Ghavami, B. Hemmateenejad, H. Sharghi, K. Alizadeh and K. Niknam, Polish Journal of Chemistry, 2008, 82, 1621–1638 CAS.
- F. Berbel, E. Kapoya, J. M. Diaz-Cruz, C. Arino, M. Esteban and R. Tauler, Electroanalysis, 2003, 15, 499–508 CrossRef CAS.
- S. Mas, G. Fonrodona, R. Tauler and J. Barbosa, Talanta, 2007, 71, 1455–1463 CrossRef CAS.
- E. Pere-Trepat and R. Tauler, J. Chromatogr., A, 2006, 1131, 85–96 CrossRef CAS.
- E. Chekmeneva, J. M. Diaz-Cruz, C. Arino and M. Esteban, J. Electroanal. Chem., 2009, 629, 169–179 CrossRef CAS.
- E. Chekmeneva, J. M. Diaz-Cruz, C. Arino and M. Esteban, Electroanalysis, 2010, 22, 177–184 CrossRef CAS.
- A. M. Garrigosa, J. M. Diaz-Cruz, C. Arino and M. Esteban, Electrochim. Acta, 2008, 53, 5579–5586 CrossRef CAS.
- R. Gusmao, C. Arino, J. M. Diaz-Cruz and M. Esteban, Analyst, 2010, 135, 86–95 RSC.
- K. R. Beebe, R. J. Pell and M. B. Seasholtz, Chemometrics: A Practical Guide, John Wiley & Sons Inc., New York, 1998 Search PubMed.
- M. Fernandez, C. Arino, J. M. Diaz-Cruz, R. Tauler and M. Esteban, Electroanalysis, 2001, 13, 1405–1410 CrossRef CAS.
- M. Fernandez, C. Arino, J. M. Diaz-Cruz, R. Tauler and M. Esteban, J. Electroanal. Chem., 2001, 505, 44–53 CrossRef CAS.
- M. Maeder, Anal. Chem., 1987, 59, 527–530 CrossRef CAS.
- J. Jaumot, R. Gargallo, A. de Juan and R. Tauler, Chemom. Intell. Lab. Syst., 2005, 76, 101–110 CrossRef CAS.
| This journal is © The Royal Society of Chemistry 2010 |
