 Open Access Article
Insights into the synthesis of NHC-stabilized Au nanoclusters through real-time reaction monitoring†
Junliang
Liu‡
a,
Yusuke
Sato‡
a,
Viveka K.
Kulkarni
 bc,
Angus I.
Sullivan
 bc,
Wenyu
Zhang
 a,
Cathleen M.
Crudden
 *bcd and
Jason E.
Hein
 *aef
*aef
aDepartment of Chemistry, The University of British Columbia, Vancouver, BC V6T 1Z1, Canada. E-mail: jhein@chem.ubc.ca
bDepartment of Chemistry, Queen's University, Kingston, ON K7L 3N6, Canada. E-mail: cruddenc@chem.queensu.ca
cCarbon to Metal Coatings Institute, Queen's University, Kingston, ON, Canada
dInstitute of Transformative Bio-Molecules (WPI-ITbM), Nagoya University, Nagoya 464-8602, Japan
eAcceleration Consortium, University of Toronto, ON, Canada
fDepartment of Chemistry, University of Bergen, N-5007, Bergen, Norway
First published on 7th September 2023
Abstract
Atomically precise gold nanoclusters (AuNCs) are interesting nanomaterials with potential applications in catalysis, bioimaging and optoelectronics. Their compositions and properties are commonly evaluated by various analytical techniques, including UV-vis spectroscopy, NMR spectroscopy, ESI mass spectrometry, and single-crystal X-ray diffraction. While these techniques have provided detailed insights into the structure and properties of nanoclusters, synthetic methods still suffer from a lack of in situ and real-time reaction monitoring methodologies. This limits insight into the mechanism of formation of AuNCs and hinders attempts at optimization. We have demonstrated the utility of HPLC-MS as a monitoring methodology in the synthesis of two NHC-protected gold nanoclusters: [Au13(NHC)9Cl3]2+ and [Au24(NHC)14Cl2H3]3+. Herein we show that HPLC coupled with mass spectrometry and 13C NMR spectroscopy of labelled derivatives enables new insight into critical reaction dynamics of AuNCs synthesis and rapid reaction optimization.
Introduction
Atomically precise gold nanoclusters (AuNCs) are a unique type of nanomaterial1,2 that can be isolated as monodisperse species with defined molecular formulae.3,4 They possess molecule-like properties such as discrete absorption bands, and can be characterized by molecular techniques.2,5 Among reported AuNCs, those protected by N-heterocyclic carbenes (NHCs) have gained increasing attention due to their remarkable quantum yields, high stability, and catalytic activity.6–10 Analytical techniques including excitation–emission fluorescence spectroscopy,11 ultraviolet-visible (UV-vis) spectroscopy,12 single crystal X-ray diffraction (SCXRD)13,14 and nuclear magnetic resonance (NMR) spectroscopy15 have been employed to provide detailed descriptions of the structure of NHC-stabilized AuNCs.In the wider realm of thiolate-stabilized AuNCs, the use of process analytical technology (PAT) to monitor synthetic reactions in real time has been employed but remains challenging due to the lack of a single, observable starting material, the complexity of AuNC reaction mixtures and the evolving nature of the AuNCs.4,16,17 When synthesizing thiolate-stabilized AuNCs, UV-vis18 and mass spectrometry19,20 are typically employed. These methods can provide ensemble measurements of the mixture of materials in the reaction media but require spectral deconvolution to identify individual species that may be present. This can limit the granularity with which the cluster formation mechanisms can be studied and hinders the ability to optimize synthetic conditions.21
Reverse phase HPLC (RP-HPLC) has been used to effectively separate AuNC mixtures stabilized by various ligands22,23 and to provide information about product and side-product compositions with high deconvolution capabilities.24,25 Despite this, HPLC methods are still limited to end-point analysis or preparative purposes in the field of NCs synthesis, even though the ability to monitor a process as it occurs yields far more information.26–28
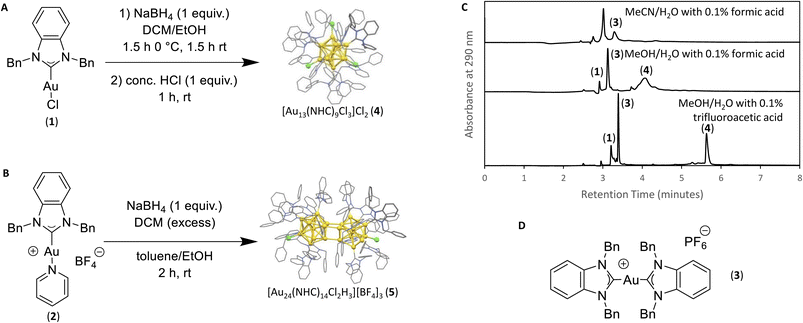
We report herein the use of continuous reaction monitoring in the synthesis of NHC-protected AuNCs by HPLC-MS and the introduction of a regional analysis methodology for nanocluster synthesis. We chose to study the preparation of two nanoclusters previously (Fig. 1) reported by Crudden et al. because of the importance of the Au13 core structure, the stability of the clusters and the potential to see interconversion between different species.29,30 The effect of temperature, HCl etching and reductant dosing rate are all explored using LC-MS and analysed using a regional analysis methodology by defining small, medium and large m/z regions of HPLC chromatograms. The use of NHC ligands isotopically enriched at the carbene carbon enabled added insight through 13C NMR spectroscopy. These techniques allowed us to identify previously unknown intermediates and provided valuable mechanistic insights.
Results and discussion
Nanocluster synthesis
Following previous reports from Crudden et al., starting materials 1 and 2 were prepared for use in the synthesis of the desired clusters.7,30 Known by-product [NHC–Au(I)–NHC]+ (3), was synthesized via an adapted literature procedure, namely reaction between the [NHC][PF6] salt, 1 equiv. of base, and starting material (1).7,30,31 Cluster 4 ([Au13(NHC)9Cl3]Cl2) was synthesized by dissolving NHC–Au–Cl (1) in DCM followed by the addition of 1 equiv. NaBH4 dissolved in EtOH. The reaction mixture was stirred at 0 °C for 1 hour, followed by two hours at room temperature. After this time, 1 equiv. HCl was added, and the resulting mixture was purified by column chromatography (1![[thin space (1/6-em)]](https://www.rsc.org/images/entities/char_2009.gif) :
:![[thin space (1/6-em)]](https://www.rsc.org/images/entities/char_2009.gif) 10 MeOH/DCM). To prepare cluster 5, ([Au24(NHC)14Cl2H3][BF4]3), [NHC–Au–Py]BF4 (2) was dissolved in toluene and 1 equiv. NaBH4 dissolved in EtOH was added. The reaction was stirred at 0 °C and allowed to warm to room temperature over 7 hours. The resulting mixture was purified by column chromatography (1
10 MeOH/DCM). To prepare cluster 5, ([Au24(NHC)14Cl2H3][BF4]3), [NHC–Au–Py]BF4 (2) was dissolved in toluene and 1 equiv. NaBH4 dissolved in EtOH was added. The reaction was stirred at 0 °C and allowed to warm to room temperature over 7 hours. The resulting mixture was purified by column chromatography (1![[thin space (1/6-em)]](https://www.rsc.org/images/entities/char_2009.gif) :
:![[thin space (1/6-em)]](https://www.rsc.org/images/entities/char_2009.gif) 12 MeOH/DCM). These methods were adapted for the preparation of HPLC scale reactions (see ESI Section 3.2†).
12 MeOH/DCM). These methods were adapted for the preparation of HPLC scale reactions (see ESI Section 3.2†).
HPLC and analytical method development§
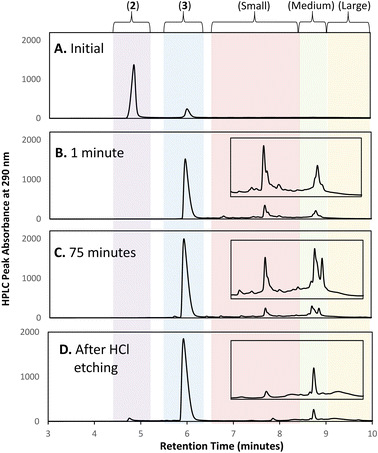
Initial efforts to develop an HPLC method to monitor cluster formation focused on [Au13(NHC)9Cl3]Cl2 (4) as the major product7 and 1 and 3 (Fig. 1D) as known by-products in the cluster synthesis. Three different HPLC mobile phases were tested to separate these three components using a solvent gradient in which the percentage of water was changed from 5% to 100% over 2.3 minutes (Fig. 1C). The addition of 0.1% trifluoroacetic acid (TFA) to the H2O/MeOH resulted in good resolution of 1, 3, and 4 with sufficiently short elution time enabling frequent sampling over the length of AuNC synthesis (Fig. 1C).We then moved to the analysis of actual reaction mixtures, taking samples at various stages of cluster formation7 (Fig. 2). After the addition of NaBH4, several new species were observed indicating the formation of various AuNCs and larger amounts of 3 (Fig. 2B and C). The addition of concentrated HCl decreased the intensity of most of the peaks with the exception of cluster 4 (Fig. 2D), supporting the occurrence of a “size-focusing” process as proposed in the literature, and the inherent stability of the Au13 cluster.¶10,29
Regional analysis method development
To simplify the analysis, we employed a regional methodology, splitting the chromatogram into five size regions. This approach was based on reports that RP-HPLC can separate AuNCs by molecular weight:22,23 species with a lower mass-to-charge ratio (m/z) have shorter retention times, and those with larger m/z ratios have longer retention times. These suppositions were confirmed by mass spectrometry of the species present in the three nanocluster areas (ESI, Fig. S3–S36†). HRMS was used to confirm the isotope pattern of the identified clusters and compare with the theoretical pattern of the species supporting the presence of a previously unidentified, Au14-based nanocluster (ESI, Section S8.4†).The small m/z region of the chromatogram was defined to include species with retention times of 6.5 to 8.5 minutes (m/z 1000–2600), the medium m/z region, contains (4) and other by-products and extends from 8.5 to 9 minutes (m/z 2600–3000), and the large m/z region contains all species with retention times > 9 minutes (m/z > 3000) (Fig. 2).||
Reaction monitoring during synthesis of [Au13(NHC)9Cl3]Cl2 (4)
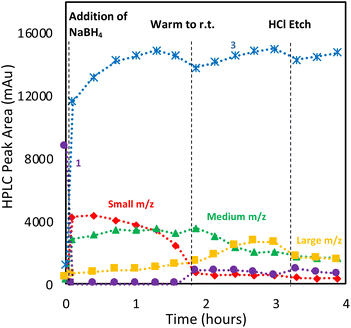
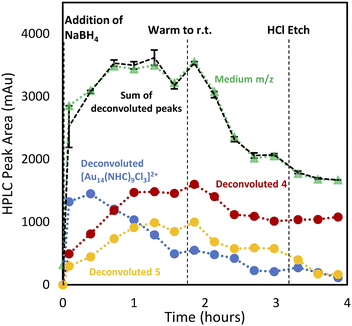
With the analytical method in hand, the synthesis of 4 was affected following the literature procedure (Fig. 1A) with continual sampling and MS analysis.7 The addition of NaBH4 results in complete consumption of 1 by the time the first data point is acquired after NaBH4 addition (1 min). At this point, the amount of 3 has increased dramatically, and clusters are already obvious in the small and medium m/z region (Fig. 3). The appearance of 3 concurrent with the formation of clusters suggests that it is a sink for NHCs released during cluster formation. Structurally related complexes are also observed as by-products in thiolate-protected AuNC synthesis.20Over the next 1.5 hours, the growth rate of the medium m/z region slowed, and the total peak area representing species in the small m/z region gradually diminished. This was coupled with the slow growth of AuNCs in the large m/z region. These results provide evidence that the formation of large AuNCs occurs through smaller intermediates.
After 1.5 hours at 0 °C, the reaction was warmed to room temperature, at which point transformations between clusters in different size regimes appeared to accelerate. In the first 30 minutes after warming, the peak area of clusters in the small m/z region decreased rapidly, while the medium m/z region remained unchanged. Signals attributed to the large m/z region grew, and some amount of 1 was reformed. After the full consumption of the small-sized species, clusters in the large m/z region began forming more rapidly. Interestingly, the consumption of medium-sized clusters only occurs at this point. These results support the possibility that clusters grow sequentially from the small to medium to large species. The re-emergence of 1 is attributed to the decomposition of more thermally unstable intermediates as the temperature is increased.
These observations were confirmed by 13C{1H} NMR spectroscopy employing a 13C labelled isotopologue of 3 (ESI, Fig. S52 and S53†). Conditions used in the LC-MS experiments were replicated in an NMR tube and 13C{1H} NMR confirmed immediate consumption of 13C-1, slow formation of 13C-3, and reformation of 13C-1 after the reaction mixture was warmed to room temperature.
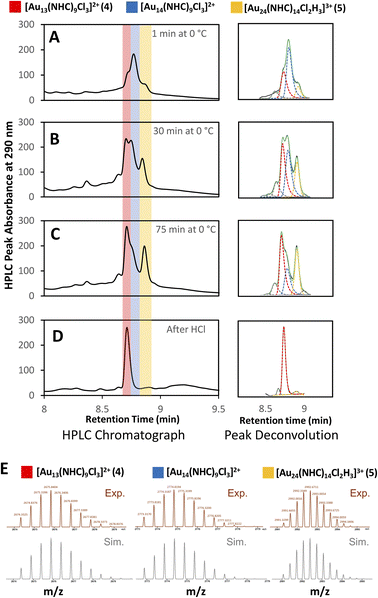
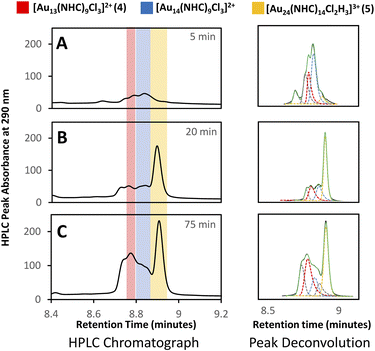
Clusters that appeared in the medium m/z region appear to be the critical zone under examination, chiefly because the targeted Au13 cluster (4) resides within this section, along with 5, and a novel cluster characterized by an m/z of 2774 (Fig. 4E). HRMS analysis suggests that this gold nanocluster has the formula [Au14(NHC)9Cl3]2+.
A more detailed analysis of signals in this region is complicated by the presence of overlapping peaks. Since changes to the chromatographic conditions, including a wide survey of new solid and liquid phases, did not yield improved separation, we formulated a peak-deconvolution algorithm specifically designed to prevent overfitting32 (ESI, Section S2.4†) (Fig. 4). This enables us to create a semiquantitative interpretation of the change in species by integrating each peak more accurately within this region as shown in Fig. 5.
Using this analysis, the predominant peak in the medium region after NaBH4 addition is the Au14 cluster (Fig. 5). After 30 minutes at 0 °C, signals attributed to species 4 and 5 increase, while that of Au14 decrease. As the reaction progresses at 0 °C, a continuous decline in Au14 is observed, coupled with a rise in 4 and 5. When the reaction is warmed to room temperature, all three peaks decline in peak area, consistent with the appearance of clusters in the “large” region (Fig. 3).
Following the introduction of concentrated HCl, both Au14 and 5 decrease almost completely while the amount of cluster 4 present remains constant. This analysis confirms the role of HCl as an etchant that degrades less stable gold nanoclusters, leaving the more stable Au13 as the predominant product.
Examination of the reaction performed with 13C-labeled 1 by 13C{1H} NMR spectroscopy 1 minute after the addition of NaBH4 supported the suggestion that new clusters were produced within the minimum time need to acquire an NMR scan after hydride addition (202.2 ppm and 205.2 ppm, Fig. S47†). When the reaction was stopped after 30 minutes of stirring, only cluster 4 was observed, supporting HPLC/MS data that show loss of the Au14 species and the formation of 4 as the reaction progresses (ESI, Fig. S49†). These results are consistent with the Au14 cluster being a kinetic product that is quickly converted to more stable species.
Reaction monitoring during synthesis of [Au24(NHC)14Cl2H3][BF4]3
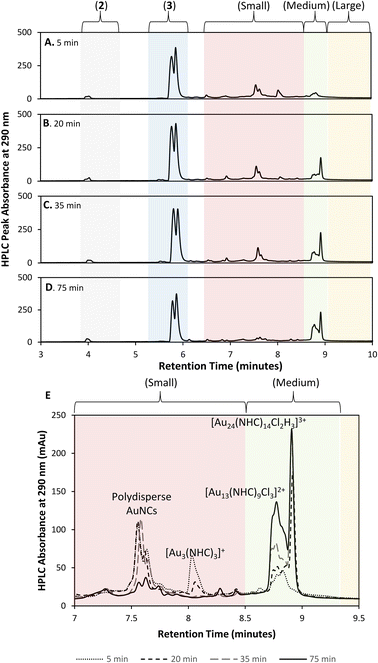
Having demonstrated the utility of LC/MS monitoring in the reduction of NHC–Au–Cl (1) to 4, we then studied the reduction of [NHC–Au–Py]BF4 (2) (Py = pyridine) to generate ([Au24(NHC)14Cl2H3][BF4]3) (5) (Fig. 1B).30 Reaction monitoring was carried out as previously described, using 2 dissolved in toluene with 1.0 equivalent of NaBH4 in EtOH. As observed in the reduction of 1, the addition of a full equivalent of NaBH4 led to the immediate consumption of 2, and formation of NCs in the small m/z region along with 5 (Fig. 6).In contrast to the synthesis of 4, the reaction proceeded with the rapid formation of small clusters and then a slow increase in the medium m/z region NCs, while larger NCs were not formed significantly. Interestingly, the pyridine-ligated Au starting material, [NHC–Au–Py]BF4 (2), was not regenerated during the reaction, with [NHC–Au(I)–NHC]+ (3) being the only molecular species observed (Fig. 6). This is likely attributed to the presence of the non-coordinating BF4− anionic ligand in contrast to Cl− which is present in higher concentration during the preparation of [Au13(NHC)9Cl3]Cl2 (4). After the rapid generation of compound 3, 48% of this species goes on to be consumed over the course of the reaction (Fig. 6A–D). Thus, under low halide conditions, 3 appears to be involved in cluster formation, rather than acting only as a sink for free NHC as in the preparation of 4. Interconversions between clusters are also clearly important for growth of medium sized clusters, based on the gradual decline of clusters in the small region.
A detailed analysis of clusters in the small and medium m/z regions shows that after 15 min, the reaction mixture consists primarily of small clusters of unknown structure (rt = 7.5 min), 4 and [Au3(NHC)3]+, an interesting cluster analogous to those synthesized by Sadighi and Bertrand (Fig. 6E).33,34 As the reaction progresses, 5 appears, 4 increases in intensity and [Au3(NHC)3]+ decreases. By 35 minutes into the reaction, the intensity of 5 is constant and [Au3(NHC)3]+ has been consumed. After this point, the only changes observed in the cluster region are due to continued growth of 4 (likely along with related clusters) and the loss of smaller clusters eluting at about 7.5 minutes, which comprise several polydisperse species which could not be assigned definitive formulae due to the MSD signal complexity and low resolution of the MS. Although 3 continues to decrease during this time, and therefore likely remains engaged in cluster synthesis, these observations highlight the involvement of small clusters in the preparation of clusters 4 and 5.
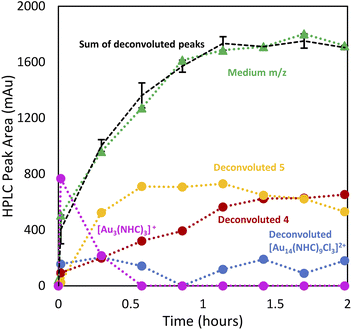
Deconvolution of the 8–9 min retention time window using our peak fitting algorithm provides a visual representation of the observations (Fig. 7). Interestingly, [Au3(NHC)3]+ and 5 exhibited a strong correlation, evidenced by the decrease in [Au3(NHC)3]+ concomitant with the cessation of the increase in species 5 around the 35 minute mark (ESI, Fig. S3†). Comparison of high-halide conditions employed in the synthesis of 4 (Fig. 3), with the low halide conditions used for cluster 5 is instructive.
Both clusters are observed under the two conditions, while under low-halide conditions, cluster 5 is present from the early stages of the reaction and is accompanied by minor amounts of 4. Under high halide conditions, cluster 5 grows in at longer reaction times, but is removed upon acid etch and purification.
Optimization of the synthesis of [Au13(NHC)9Cl3]Cl2 (4)
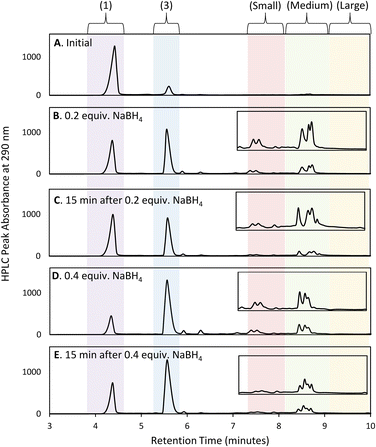
To optimize the synthesis of cluster 4, we examined whether we could prevent the formation of large clusters by balancing the rate of reduction of precursor 1 with that of cluster evolution. This strategy aligns with prior work with thiol-protected AuNCs, which demonstrated that restricting the amount of NaBH4 can improve selectivity and prevent the formation of undesired NCs.20 Interestingly, [(RS)2Au]− byproducts were also observed in this study.Thus, we explored the use of stepwise dosing of NaBH4. A solution of 1 in DCM was first prepared and sampled at 15 min time intervals by HPLC-MS over a 45 min period to ensure a stable initial baseline (Fig. 9A). The reducing agent (NaBH4) was then added in 0.2 equivalents aliquots along with HPLC-MS analysis (Fig. 9B).
The first addition of NaBH4 caused 40% of 1 to be consumed upon mixing, producing mainly bisNHC complex (3) and AuNCs in the small and medium m/z regions. The reaction was allowed to age for 15 min (Fig. 9C), resulting in increases in large clusters, while the small and medium clusters decreased. More surprisingly, a decrease in bisNHC complex (3) with a corresponding increase in 1 was also observed. Longer ageing times without additional NaBH4 did not result in further changes to the chromatogram. Adding a second 0.2 equivalents of NaBH4, followed by an additional 15 min pause in dosing gave similar observations: rapid consumption of 1, resulting in an increase in 3 as well as formation of AuNCs in the small and medium m/z regions. A rebound in the concentration of 1 is also observed with concomitant reduction of 3 as small AuCNs evolve to medium and large species (Fig. 9D and E).
The observed rebound in the concentration of 1 suggests that a highly dynamic and reversible process is occurring during cluster formation, where unstable Au–NHC intermediates both aggregate to grow larger complexes but also degrade back to 1. Although this experiment provides a limited view into the rapid, underlying process, it illustrates that the growth of these nanoclusters proceeds via the generations of transient, kinetically-favoured species, which give way to particular clusters that display far greater thermodynamic stability. This dynamic exchange favours growth to larger species, provided sufficient concentration of an activated cluster precursor (formed by reaction between NaBH4 and 1) is available. In the absence of sufficient reducing agent, unstable clusters may shed an Au–NHC unit, allowing regeneration of 1.
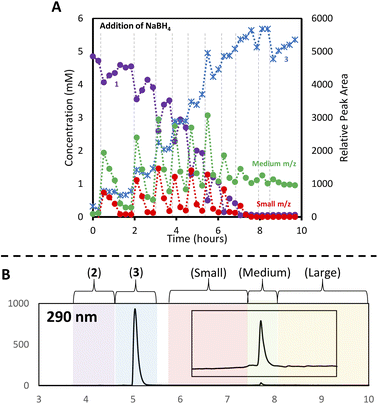
The stepwise dosing method not only offers a detailed visualization of the AuNC's incremental growth but also yields higher concentrations of the desired Au13 (4), as evidenced by its relative peak area. This enhancement likely stems from effectively regulating the production rate of smaller AuNC precursors conducive to growth, and simultaneously reducing the transition of 4 into larger AuNC forms. To quantify the impact of this dosing strategy on gold nanocluster formation, we executed experiments with different NaBH4 dosing schedules (0.2 equivalents added five times and 0.1 equivalents added ten times), benchmarking results using an internal standard (Fig. 10). The results reveal that each NaBH4 aliquot causes a transformation: initial materials quickly change to intermediate 3 and various amounts of both small and medium AuNCs. Delaying subsequent NaBH4 doses allows for starting material 1 to regenerate, accompanied by the consumption of both small and medium AuNCs. Once all Au–NCH 1 was consumed (around 7.5 hours, approximately 0.8 equiv. NaBH4), further reducing agent inclusions have minimal impact on the reaction mixture. Notably, the slow-dosing trial yielded a 12% rise in the estimated yield of cluster 4, as inferred from its quantitative peak area relative to the internal standard (see ESI, Fig. S38†). Moreover, at the reaction's conclusion, AuNC 4 emerged as the sole nanocluster present, even without applying an HCl etch.
Conclusions
Insights from these reaction monitoring studies have enabled us to generate a reasonable balanced reaction equation for the formation of cluster 4 (Scheme 1A). In this equation, the formation of compound (3) is explained by the necessary generation of Au atoms in the cluster that are not ligated by an NHC – the central Au atom, and the three atoms bound to chloride. Thus, the formation of one molar equivalent of cluster 4 from 1 requires the loss of four NHCs. These free NHCs react with 1, resulting in the formation of four molar equivalents of 3 (Scheme 1A).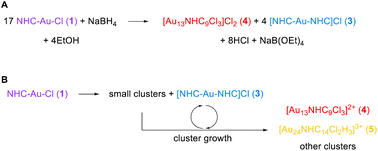 | ||
| Scheme 1 (A) Balanced equation for the formation of NHC–AuNCs from reduction of 1 (B) potential pathways for the release of Au(I) precursors and route to AuNCs. | ||
However, this equation neglects the complex mechanism by which even simple clusters like 4 are prepared. Our studies have shown that small clusters such as Au3(NHC)3+ are key precursors. As these evolve, and as clusters become larger, more unligated gold atoms are produced, leading to the generation of 3 or possibly even regenerating starting materials 1 (Scheme 1B). Depending on the reaction conditions, specifically the amount of halide present, 3 can also be involved in the preparation of larger clusters (Scheme 1B).
Interconversion within a size range, for example from [Au14(NHC)9Cl3]2+ to 4, also needs to be considered as it has been documented in this study (Fig. 3, 5, and 8). The time at which the reaction is deemed complete and the use or not of post-synthesis treatments, for example with HCl, will result in completely different cluster compositions, as illustrated in Fig. 5. More importantly, the rate of addition of reducing agent can be tuned to mitigate the generation of cluster forming precursors, thus improving the mass throughput to desired nanoclusters. This focusing behavior coupled to control of the rate of reduction provides a novel means of control when coupled to the HPLC time-course visualization.
The nature of the reaction of NaBH4 with the starting gold complex 1 has not been addressed in this study, but likely proceeds through the initial generation of gold hydrides, species that can be isolated in the case of very bulky NHCs.35 The observation of clusters that retain the hydride ligand supports this possibility.30
Overall, this study demonstrates the importance of real-time reaction monitoring using HPLC-MS and 13C-NMR spectroscopy to provide insights into true reaction compositions during the preparation of NHC-protected gold nanoclusters. In depth analysis revealed the formation of previously unidentified intermediates including an Au14 cluster of moderate stability and an Au3(NHC)3+ cluster related to the first ever prepared Au–NHC clusters. Our analysis also revealed the critical importance of transformations between clusters of different sizes and outlines potential routes for optimization such as sequential vs. single additions of reducing agents. Insights into the mechanism of nanocluster formation have also included a balanced reaction equation to understand and predict the by-products of cluster-forming reactions.
Data availability
All code needed to execute the HPLC deconvolution is freely available via online repository at https://gitlab.com/heingroup/hplc_peak_deconvolution.Author contributions
J. L. and Y. S. performed the development of HPLC methods, and analysed reaction monitoring data under the supervision of J. E. H. V. K. K. and A. I. S. performed NMR studies, and synthesis of control materials under the supervision of C. M. C. W. Z. created and implemented the code to deconvolute the HPLC traces. C. M. C. and J. E. H. jointly conceived of the project. All authors wrote the manuscript, ESI† methods, and related materials.Conflicts of interest
There are no conflicts to declare.Acknowledgements
V. K. K. and A. I. S. acknowledge the Ontario Government and NSERC for support. Emiliya Rafikova is acknowledged for her contribution to the project. Financial support for this work was provided by The University of British Columbia, Queen's University, the Canada Foundation for Innovation (CFI; CFI-35883 and CFI-33355) the Natural Sciences and Engineering Research Council of Canada (NSERC; RGPIN-2021-03168, RGPIN/04667-2016, Discovery Accelerator Supplement), and the New Frontiers in Research Fund – Exploration program (NFRFE-2019-01334, NFRFT-2020-00573).References
- R. Jin, Nanoscale, 2015, 7, 1549–1565 RSC.
- H. Qian, M. Zhu, Z. Wu and R. Jin, Acc. Chem. Res., 2012, 45, 1470–1479 CrossRef CAS PubMed.
- Y. Du, H. Sheng, D. Astruc and M. Zhu, Chem. Rev., 2020, 120, 526–622 CrossRef CAS PubMed.
- R. Jin, C. Zeng, M. Zhou and Y. Chen, Chem. Rev., 2016, 116, 10346–10413 CrossRef CAS PubMed.
- M. Zhou, X. Du, H. Wang and R. Jin, ACS Nano, 2021, 15, 13980–13992 CrossRef CAS PubMed.
- M. R. Narouz, K. M. Osten, P. J. Unsworth, R. W. Y. Man, K. Salorinne, S. Takano, R. Tomihara, S. Kaappa, S. Malola, C. T. Dinh, J. D. Padmos, K. Ayoo, P. J. Garrett, M. Nambo, J. H. Horton, E. H. Sargent, H. Häkkinen, T. Tsukuda and C. M. Crudden, Nat. Chem., 2019, 11, 419–425 CrossRef CAS PubMed.
- M. R. Narouz, S. Takano, P. A. Lummis, T. I. Levchenko, A. Nazemi, S. Kaappa, S. Malola, G. Yousefalizadeh, L. A. Calhoun, K. G. Stamplecoskie, H. Häkkinen, T. Tsukuda and C. M. Crudden, J. Am. Chem. Soc., 2019, 141, 14997–15002 CrossRef CAS PubMed.
- H. Shen, S. Xiang, Z. Xu, C. Liu, X. Li, C. Sun, S. Lin, B. K. Teo and N. Zheng, Nano Res., 2020, 13, 1908–1911 CrossRef CAS.
- Z. Lei, M. Endo, H. Ube, T. Shiraogawa, P. Zhao, K. Nagata, X.-L. Pei, T. Eguchi, T. Kamachi, M. Ehara, T. Ozawa and M. Shionoya, Nat. Commun., 2022, 13, 4288 CrossRef CAS PubMed.
- H. Yi, K. M. Osten, T. I. Levchenko, A. J. Veinot, Y. Aramaki, T. Ooi, M. Nambo and C. M. Crudden, Chem. Sci., 2021, 12, 10436–10440 RSC.
- H. Ramsay, D. Simon, E. Steele, A. Hebert, R. D. Oleschuk and K. G. Stamplecoskie, RSC Adv., 2018, 8, 42080–42086 RSC.
- X.-K. Wan, Z.-J. Guan and Q.-M. Wang, Angew. Chem., Int. Ed., 2017, 56, 11494–11497 CrossRef CAS PubMed.
- X. Han, X. Luan, H. Su, J. Li, S. Yuan, Z. Lei, Y. Pei and Q. Wang, Angew. Chem., 2020, 132, 2329–2332 CrossRef.
- L. Liao, J. Chen, C. Wang, S. Zhuang, N. Yan, C. Yao, N. Xia, L. Li, X. Bao and Z. Wu, Chem. Commun., 2016, 52, 12036–12039 RSC.
- M. Agrachev, M. Ruzzi, A. Venzo and F. Maran, Acc. Chem. Res., 2019, 52, 44–52 CrossRef CAS PubMed.
- A. W. Cook and T. W. Hayton, Acc. Chem. Res., 2018, 51, 2456–2464 CrossRef CAS PubMed.
- Y. Negishi, K. Nobusada and T. Tsukuda, J. Am. Chem. Soc., 2005, 127, 5261–5270 CrossRef CAS PubMed.
- G. Yousefalizadeh and K. G. Stamplecoskie, J. Photochem. Photobiol., A, 2018, 353, 251–254 CrossRef CAS.
- Z. Luo, V. Nachammai, B. Zhang, N. Yan, D. T. Leong, D. Jiang and J. Xie, J. Am. Chem. Soc., 2014, 136, 10577–10580 CrossRef CAS PubMed.
- T. Chen, V. Fung, Q. Yao, Z. Luo, D. E. Jiang and J. Xie, J. Am. Chem. Soc., 2018, 140, 11370–11377 CrossRef CAS PubMed.
- Y. Shichibu and K. Konishi, Small, 2010, 6, 1216–1220 CrossRef CAS PubMed.
- Y. Negishi, S. Hashimoto, A. Ebina, K. Hamada, S. Hossain and T. Kawawaki, Nanoscale, 2020, 12, 8017–8039 RSC.
- Y. Niihori, C. Uchida, W. Kurashige and Y. Negishi, Phys. Chem. Chem. Phys., 2016, 18, 4251–4265 RSC.
- Y. Zhang, Q. Hu, M. C. Paau, S. Xie, P. Gao, W. Chan and M. M. F. Choi, J. Phys. Chem. C, 2013, 117, 18697–18708 CrossRef CAS.
- S. Xie, M. C. Paau, Y. Zhang, S. Shuang, W. Chan and M. M. F. Choi, Nanoscale, 2012, 4, 5325–5332 RSC.
- S. Bordawekar, A. Chanda, A. M. Daly, A. W. Garrett, J. P. Higgins, M. A. LaPack, T. D. Maloney, J. Morgado, S. Mukherjee, J. D. Orr, G. L. Reid, B. S. Yang and H. W. Ward, Org. Process Res. Dev., 2015, 19, 1174–1185 CrossRef CAS.
- Y. Sato, J. Liu, A. J. Kukor, J. C. Culhane, J. L. Tucker, D. J. Kucera, B. M. Cochran and J. E. Hein, J. Org. Chem., 2021, 86, 14069–14078 CrossRef CAS PubMed.
- J. Liu, Y. Sato, F. Yang, A. J. Kukor and J. E. Hein, Chem.: Methods, 2022, 2, e202200009 CAS.
- M. R. Narouz, S. Takano, P. A. Lummis, T. I. Levchenko, A. Nazemi, S. Kaappa, S. Malola, G. Yousefalizadeh, L. A. Calhoun, K. G. Stamplecoskie, H. Häkkinen, T. Tsukuda and C. M. Crudden, J. Am. Chem. Soc., 2019, 141, 14997–15002 CrossRef CAS PubMed.
- V. K. Kulkarni, B. N. Khiarak, S. Takano, S. Malola, E. L. Albright, T. I. Levchenko, M. D. Aloisio, C. Dinh, T. Tsukuda, H. Häkkinen and C. M. Crudden, J. Am. Chem. Soc., 2022, 144, 9000–9006 CrossRef CAS PubMed.
- R. Jothibasu, H. V. Huynh and L. L. Koh, J. Organomet. Chem., 2008, 693, 374–380 CrossRef CAS.
- S. Misra, M. F. Wahab, D. C. Patel and D. W. Armstrong, J. Sep. Sci., 2019, 42, 1644–1657 CrossRef CAS PubMed.
- L. Jin, D. S. Weinberger, M. Melaimi, C. E. Moore, A. L. Rheingold and G. Bertrand, Angew. Chem., Int. Ed., 2014, 53, 9059–9063 CrossRef CAS PubMed.
- T. J. Robilotto, J. Bacsa, T. G. Gray and J. P. Sadighi, Angew. Chem., Int. Ed., 2012, 51, 12077–12080 CrossRef CAS PubMed.
- N. Phillips, T. Dodson, R. Tirfoin, J. I. Bates and S. Aldridge, Chem.–Eur. J., 2014, 20, 16721–16731 CrossRef CAS PubMed.
Footnotes |
| † Electronic supplementary information (ESI) available: Synthesis, HPLC traces and methodologies and NMR data. See DOI: https://doi.org/10.1039/d3sc02077k |
| ‡ These authors contributed equally. |
| § When H2O/MeCN with 0.1% formic acid (FA) was employed as a mobile phase in place of MeOH a significant new peak was observed at a different retention time than 3 (Fig. 1D). This peak was identified as [NHC–Au(I)–MeCN]+ based on the observed mass signal (m/z 536.0) (ESI, Fig. S35†). This suggests that MeCN behaves as a nucleophilic solvent and exchanges with the Cl− ligand. The insolubility of 4 in MeCN was also problematic and prompted the use of MeOH as an alternative. |
| ¶ Dissolution of starting material 1 in the reaction solvent gave the expected signal for 1, along with a small amount of 3, even prior to the addition of NaBH4, indicating that species 3 is readily produces in chlorinated solvents. |
| || No mass signals were observed in the large m/z region due to the m/z limit of the mass spectrometer (max m/z 3000) (see ESI S4†). |
| This journal is © The Royal Society of Chemistry 2023 |

