 Open Access Article
Chiral plasmonic liquid crystal gold nanoparticles: self-assembly into a circular dichroism responsive helical lamellar superstructure†
Sachin A.
Bhat
ab,
D. S. Shankar
Rao
a,
S. Krishna
Prasad
a and
Channabasaveshwar V.
Yelamaggad
 *a
*a
aCentre for Nano and Soft Matter Sciences (CeNS), P. B. No. 1329, Prof. U. R. Rao Road, Jalahalli, Bengaluru 560012, India. E-mail: Yelamaggad@cens.res.in
bDepartment of Chemistry, Mangalore University, Mangalagangotri 574 199, India
First published on 19th February 2021
Abstract
Owing to their proven and promising potential in various technological endeavors ranging from catalysis and sensing to invisibility cloaks made from metamaterials, chiral plasmonic superstructures resulting from the directed self-assembly of optically active metal nanoparticles (MNPs) have been pursued intensively in recent years. Several strategic efforts have emerged especially to accomplish advanced nanomaterials assembling into liquid crystalline (LC) helical structures, where MNPs are regularly packed in fluid/frozen arrays/layers or wires (columns). While the helical fluid columnar arrays (molecular wires) showing circular dichroism (CD) have been realized, the discovery of fluid chiral lamellar ordering, where the dielectric and conducting regimes are arranged alternatively, has hitherto remained highly elusive. Herein we report the first examples of monodisperse LC-gold NPs (LC-GNPs) self-assembling into a fluid/frozen lamellar structure exhibiting CD activity. Notably, these new, exceptional LC-GNPs have been realized by simple, hassle-free protocols that involve the room temperature addition of LC dimer-like arylamines to Au(III), where the amines not only reduce Au(III) to Au(0) but also bind strongly to the central GNP scaffold. Their molecular structure, mesomorphism, and ability to interact with circularly polarized light have been evidenced unambiguously and could play an important role in realizing metamaterials in the visible region.
1. Introduction
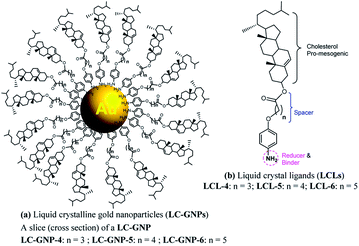
Metal nanoparticles (MNPs) have been regarded as one of the most prominent and potentially promising functional advanced materials for a wide range of nanotechnological applications as they inherently display, compared to their larger-scale counterparts, incredible phenomena and properties.1–7 The research pursuits on such materials are increasing exponentially primarily because they can be directed to self-assemble into predestined, technologically relevant superstructures through a rational design and bottom-up synthesis.8–12 Functionalization, especially by surface grafting with organic,13–18 bioorganic19,20 or polymeric21–23 capping agents, not only dictates the organization model of MNPs but also bestows many essential and handy features such as dispersion (non-agglomeration), stability, chirality (optical activity), solubility in traditional organic solvents, ease of processability as well as tuned optical (surface plasmon resonance; SPR), electrical, magnetic properties, etc. Of these, one of the most sought-after and pursued research activities in recent times is macroscopic symmetry breaking in self-assembled nanostructures.24–29 This formidable task of accomplishing chiral plasmonic structures via the assembly of either bare MNPs24,25 or their chiral analogues24–29 bearing optically active organic surface ligands has attracted a great deal of research interest owing24,25 to their potential in catalysis,24 biosensors,30–32 metaoptics,33,34etc. But above all, the chiral plasmonic MNPs interacting with circularly polarised (CP) light break the degeneracy between two CP waves and enhance the effective refractive index for one polarization while reducing for the other; consequently, MNPs exhibiting circular dichroism (CD) are well poised to show a negative refractive index phenomenon.33,34 Moreover, theoretical predictions signify that the regular packing of MNPs into arrays/lamellar structures (layers) or wires leads to negative magnetic permeability accounting for a negative refractive index.35,36 Thus, the chiral plasmonic MNPs assembling into spontaneously twisted (chiral) layered structures exhibiting chiroptical effects (CD activity) are highly promising for many applications. However, it appears that the challenges of rational design and preparation of enantiopure MNPs competent of showing CD active chiral assemblies impeded their lucrative growth and actual end-usage in advanced devices.In recent years the concept of anisotropic molecular assembly into liquid crystal (LC) phases has been successfully extended for triggering and directing the organization of plasmonic NPs into functional fluid superstructures, where some degree of anisotropy as well as a long-range order at the mesoscale level exist additionally.37–60 Indeed, this approach considers the fact that the intrinsic assembling ability of mesogenic (LC) ligands grafted onto the MNP surface enables particles to arrange in ordered self-assembled structures that are fluids (mechanically shearable) and respond readily to external stimuli. Although wide varieties of liquid crystalline MNPs have been designed and realized, the successful attempts dealing with analogous chiral plasmonic MNPs have been barely reported. In recent pioneering work, it has been shown that the organization, size, and morphology of gold NPs (GNPs) can be manipulated effectively by their in situ preparation using chiral mesophase templates formed from chiral LC ligands. Notably, in situ generated GNPs of the chiral smectic A (SmA*) phase organize in a helical fashion, while they attain a spherical shape and bent conformation in the chiral nematic (N*) and chiral smectic C (SmC*) phases, respectively.54 Interestingly, there is only one notable report in the context of preceding discussion, where the strong chiral optical response of a mesophase resulting from the spontaneous self-assembly of chiral plasmonic GNPs has been lately disclosed. In fact, they are columnar (Col) arrays (wires) arranged helically.55 However, for a wide range of technical implications, the organization of plasmonic MNPs in a helically twisted LC lamellar (CD active) structure, where the dielectric and conducting regimes are arranged alternatively, as in the case of the Col phase described above, is ideal and highly favorable. To our knowledge, such an assembly of LC-GNPs has not been accomplished hitherto. Herein we report on the synthesis and characterization of novel chiral plasmonic GNPs (Fig. 1a) self-assembling into a fluid/frozen lamellar superstructure exhibiting a strong chiroptical effect – the CD activity. These new, monodisperse LC-GNPs have been realized by a straightforward, hassle-free synthetic approach, which involves the room temperature (RT) addition of organic ligands, namely, cholesterol-based LC arylamines to a HAuCl4 aqueous solution where the former compounds not only reduce Au(III) to Au(0) but also binds strongly to the central GNPs; in fact, these hybrids were also prepared in the form of thin films by drop-casting on glass substrates. It is important to mention here that cholesterol has been intentionally incorporated into the liquid crystalline ligand (LCL) design as it not only induces promising LC behavior but also freezes mesophases.13,56
2. Synthesis and characterization
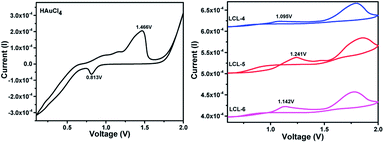
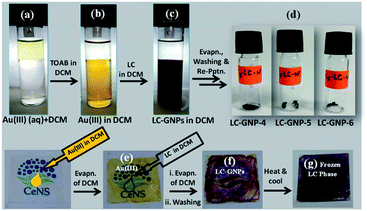
Three optically pure LC ligands (LCL-4, LCL-5, and LCL-6) (Fig. 1b) and the corresponding LC-GNPs were synthesized in excellent yields as shown in Scheme 1 and fully characterized; all the details are given in the ESI.† It is well known that the reduction of Au(III) to Au(0) by amines is feasible if the oxidation potential (Eox) of the latter lies between the reduction potential (Ered) and Eox of gold.61 Thus, the amines synthesized were examined for their redox behavior by recording cyclic voltammograms (CVs). The CVs of amines showed Eox peaks in the range of 1.1 to 1.2 V falling between the Eox peak at 1.47 V of Au(0) to Au(I) and Ered peak at 0.81 V of Au(III) to Au(0) (Fig. 2 and Table 1). As shown in Fig. 3, the corresponding liquid crystalline GNPs, LC-GNP-4, LC-GNP-5 and LC-GNP-6, were prepared at RT; to a liquid bilayer comprising dichloromethane (DCM) – (aq) HAuCl4 (Fig. 3a) placed in a sample vial, a solution of tetraoctylammonium bromide (TOAB) in DCM was added drop-wise; to the resultant bilayer, where the Au(III) ions are now in DCM (Fig. 3b), a six-fold excess solution of the chosen LCL in DCM was added resulting in the instant generation of LC-GNPs (Fig. 3c). The organic layer separated and collected was washed repeatedly with deionized water, and the LC-GNPs obtained as dark-red compounds after the evaporation of DCM were repetitively washed with deionized water, followed by a hot mixture of ethanol–DCM (9![[thin space (1/6-em)]](https://www.rsc.org/images/entities/char_2009.gif) :
:![[thin space (1/6-em)]](https://www.rsc.org/images/entities/char_2009.gif) 1) until the washing solution is free from the residual ligand and TOAB (TLC monitored; KMnO4 stain). They were further purified by dissolving in a minimum amount of DCM and reprecipitated by adding a large excess of ethanol. Pure LC-GNP-4, LC-GNP-5 and LC-GNP-6 were collected after centrifugation, dried in a vacuum, and stored in sample vials under normal atmospheric conditions (Fig. 3d). Remarkably, their purity remains intact over any period of time despite keeping under the aforementioned conditions. They were also realized in equal purity by the drop-casting technique (Fig. 3e–g).53 A solution of Au(III) ions in DCM was drop-casted on a clean glass plate, and the solvent was allowed to evaporate naturally. Over the pale-yellow thin-film of Au(III) (Fig. 3e), a solution of mesogens (six equivalents) in DCM was dropped at once, where an instant colour change to deep-reddish due to the formation of LC-GNPs (Fig. 3f) could be seen. The DCM was allowed to evaporate and the dark-pinkish film formed on the glass substrate was washed with deionized water, followed by a mixture of ethanol–DCM (9
1) until the washing solution is free from the residual ligand and TOAB (TLC monitored; KMnO4 stain). They were further purified by dissolving in a minimum amount of DCM and reprecipitated by adding a large excess of ethanol. Pure LC-GNP-4, LC-GNP-5 and LC-GNP-6 were collected after centrifugation, dried in a vacuum, and stored in sample vials under normal atmospheric conditions (Fig. 3d). Remarkably, their purity remains intact over any period of time despite keeping under the aforementioned conditions. They were also realized in equal purity by the drop-casting technique (Fig. 3e–g).53 A solution of Au(III) ions in DCM was drop-casted on a clean glass plate, and the solvent was allowed to evaporate naturally. Over the pale-yellow thin-film of Au(III) (Fig. 3e), a solution of mesogens (six equivalents) in DCM was dropped at once, where an instant colour change to deep-reddish due to the formation of LC-GNPs (Fig. 3f) could be seen. The DCM was allowed to evaporate and the dark-pinkish film formed on the glass substrate was washed with deionized water, followed by a mixture of ethanol–DCM (9![[thin space (1/6-em)]](https://www.rsc.org/images/entities/char_2009.gif) :
:![[thin space (1/6-em)]](https://www.rsc.org/images/entities/char_2009.gif) 1) to remove the leftover LCL and TOAB. The frozen LC films were obtained by heating the aforesaid films of the as-prepared samples at ∼150 °C and cooled to RT at a rate of 10 °C min−1 (Fig. 3g). The characteristics of these LC-GNPs adhering to the glass plate were found to match with those of NPs prepared by the aforesaid method (see the Experimental section in the ESI†). LC-GNP-4, LC-GNP-5, and LC-GNP-6 were fully characterized with the aid of spectroscopic, microscopic, and X-ray diffraction (XRD) techniques discussed below.
1) to remove the leftover LCL and TOAB. The frozen LC films were obtained by heating the aforesaid films of the as-prepared samples at ∼150 °C and cooled to RT at a rate of 10 °C min−1 (Fig. 3g). The characteristics of these LC-GNPs adhering to the glass plate were found to match with those of NPs prepared by the aforesaid method (see the Experimental section in the ESI†). LC-GNP-4, LC-GNP-5, and LC-GNP-6 were fully characterized with the aid of spectroscopic, microscopic, and X-ray diffraction (XRD) techniques discussed below.
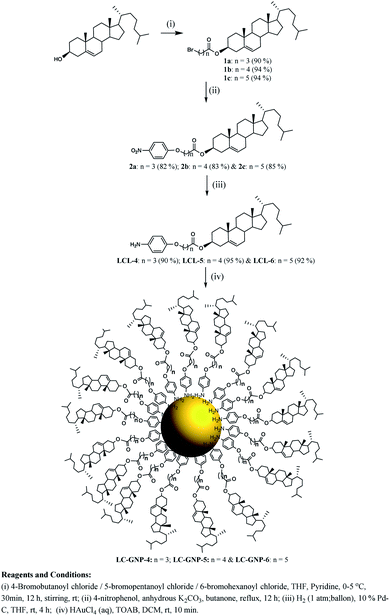 | ||
| Scheme 1 Synthesis of liquid crystal ligands (LCLs) and liquid crystal-gold nanoparticles (LC-GNPs). | ||
| Compds | E ox (oxidation potential) | E red (reduction potential) |
|---|---|---|
| HAuCl4 | 1.47 V [Au(0) to Au(I)] | 0.8 V [Au(III) to Au(0)] |
| LCL-4 | 1.1 V | — |
| LCL-5 | 1.2 V | — |
| LCL-6 | 1.1 V | — |
At first, the uniform distribution of LCLs onto the GNP surface was evidenced by recording energy-dispersive X-ray (EDX) spectroscopy elemental mapping images (Fig. S1†), where the presence of carbon, nitrogen, oxygen, and gold was revealed. Especially the presence of a peak at ∼2 keV in each profile implied the existence of GNPs. Elemental microanalytical data obtained (see the Experimental section in ESI†) authenticated the purity and further confirmed the proposed structure of the newly synthesized LC-GNPs.
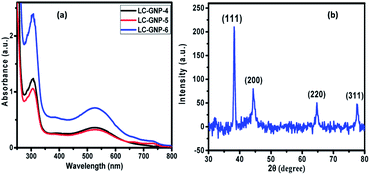
The UV-Vis spectra of LC-GNPs dissolved in DCM showed an intense peak at ∼300 nm and a broad band at ∼530 nm corresponding to the n–π* transition of organic moieties (Fig. S2†) and SPR of GNPs, respectively (Fig. 4a). Moreover, the presence of a single and nearly symmetric SPR band suggests that the shapes of the GNPs are isotropic (spherical), which was further corroborated, as we shall discuss later, by the transmission electron microscope (TEM) images.
As compared to the FTIR spectra of LCLs showing two sharp, intense bands at ∼3340 and ∼3420 cm−1 due to symmetric and asymmetric N–H stretching absorptions, the corresponding LC-GNP profiles show a broad band in this regime (Fig. S3†), implying the association of the amine group with GNPs. The Raman spectra revealed the different modes of vibration in LCLs and LC-GNPs (Fig. S4†). A sharp peak seen at 490 cm−1 in the LCL spectra due to the C–C stretching of aliphatic chains is absent in the profiles of LC-GNPs (Fig. S4†). Two sharp but weak vibration peaks at ∼1460 and ∼1530 cm−1 corresponding to C![[double bond, length as m-dash]](https://www.rsc.org/images/entities/char_e001.gif) C aromatic stretching become broad and possess multiple bands in the range of 1527–1604 cm−1 in the LC-GNP spectra. Besides, additional bands at ∼1200, 1270 and 1350 cm−1 were found in the spectra of LC-GNPs due to asymmetric CH2 stretching. 1H and 13C NMR spectra of these diamagnetic LC-GNPs were recorded and compared with those of ligands. Moderate to significant chemical shifts in both proton and carbon signals were found in the spectra of LC-GNPs when compared with the corresponding signals seen for LCLs (Fig. S5–S19†). The formation of GNPs was further evidenced by the powder XRD study. The diffraction pattern obtained (Fig. 4b and S20†) for the as-prepared LC-GNPs shows intense peaks in the 2θ range of 30–80° confirming the presence of GNPs; the diffraction peaks seen at 38.2°, 44.3°, 64.6° and 77.6° could be respectively ascribed to the (111), (200), (220), and (311) Bragg planes (Fig. 4b and S20†) implying the face-centered cubic (FCC) structure of the GNPs.
C aromatic stretching become broad and possess multiple bands in the range of 1527–1604 cm−1 in the LC-GNP spectra. Besides, additional bands at ∼1200, 1270 and 1350 cm−1 were found in the spectra of LC-GNPs due to asymmetric CH2 stretching. 1H and 13C NMR spectra of these diamagnetic LC-GNPs were recorded and compared with those of ligands. Moderate to significant chemical shifts in both proton and carbon signals were found in the spectra of LC-GNPs when compared with the corresponding signals seen for LCLs (Fig. S5–S19†). The formation of GNPs was further evidenced by the powder XRD study. The diffraction pattern obtained (Fig. 4b and S20†) for the as-prepared LC-GNPs shows intense peaks in the 2θ range of 30–80° confirming the presence of GNPs; the diffraction peaks seen at 38.2°, 44.3°, 64.6° and 77.6° could be respectively ascribed to the (111), (200), (220), and (311) Bragg planes (Fig. 4b and S20†) implying the face-centered cubic (FCC) structure of the GNPs.
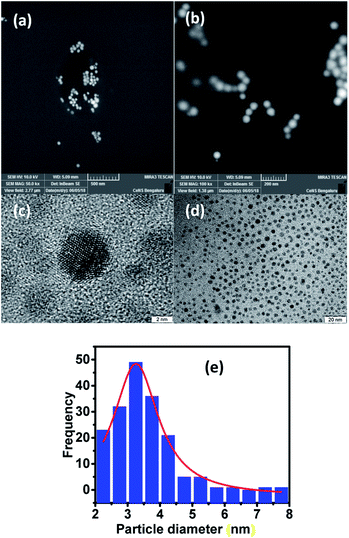
For visualizing the surface morphology and the nature of particles, field emission scanning electron microscopy (FESEM) was used. The micrographs obtained for the LC-GNP drop-cast films over ITO substrates subjected to platinum sputtering revealed the presence of mostly spherical nanoparticles with a smooth surface (Fig. 5a and b). High-resolution TEM (HRTEM) micrographs were acquired from pristine sample LC-GNPs drop-casted on a carbon-coated copper grid (Fig. 5c, d and S21†). The image analysis confirmed the spherical shape morphology of the prepared NPs with an average particle size of around 3.3 nm (Fig. 5e). The analysis of images and calculations showing an average gold-nanoparticle in the LC-GNPs and ligands surrounding GNPs is shown the ESI.†
2.1 Mesomorphic behavior
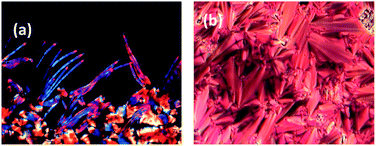
The enantiotropic LC behavior of the dimer-like ligands and the corresponding LC-GNPs was revealed with the aid of polarized optical microscopy (POM) (Fig. 6a and S23†), differential scanning calorimetry (DSC) (Fig. S24†), and the XRD technique (Fig. 6c, d and S25†). The phases formed, the transition temperatures determined, and enthalpies for the transitions have been summarized in Table 2. The occurrence of chiral nematic (N*), twist grain boundary (TGB), and smectic A (SmA) phases in mesogenic ligands was evidenced by a polarized light microscopic study, where the optical textures showed the typical defects of these LC phases. On cooling the samples from their isotropic phase, a focal-conic texture appears, which upon slight shearing leads to a planar texture with oily streaks, a pattern often seen for the N* phase. Upon further cooling of the samples, the field of view is filled with a striking filament texture of the TGB phase, which vanishes instantaneously, leaving the field of view completely dark due to the presence of the SmA phase. The existence of the SmA mesophase was established based on the observation of a characteristic fan-shaped texture using slides treated for planar orientation and a dark field of view with slides treated for the homeotropic alignment. XRD experiments were carried out to reveal the molecular arrangement in the SmA phase, and the XRD profiles obtained at different temperatures as a function of temperature are given in Fig. S26.† As summarized in Table S1,† the spacing (d) corresponding to the wave vector of the mass density wave was found to be longer than the calculated length of the mesogens in their all-trans conformation, with the d/L ratio being in the range of 1.75 to 1.88. These XRD results suggest a partial bilayer structure for the SmA phase, wherein the like (chemically compatible) regions of the molecules overlap. That is, the antiparallel arrangement of molecules yields a d value that is greater than L but less than 2L. Thus, these ligands show an interdigitated smectic A (SmAd) phase resulting from the self-assembly of antiparallel pairs of mesogens formed by the electrostatic interaction among the polar aromatic (benzene) cores. In fact, in these mesogens with a very narrow TGB phase thermal range, the N* and SmA phases coexisted with the TGB phase. This was evident from the observation that the textures corresponding to these three LC phases appear simultaneously over a short thermal range (Fig. 6a).| Materials | Phase sequence: |
|---|---|
| Heating and cooling | |
| a Cr = crystal. SmA = smectic A phase. TGB = twist grain boundary phase. N* = chiral nematic phase. LmX* = unknown chiral lamellar phase. I = isotropic liquid phase. b Peak temperatures in the DSC traces obtained during the first heating and cooling cycles at a rate of 5 °C min−1. c A transient phase. d SmA–TGB–N* transition could not be resolved in DSC and hence it represents a combined enthalpy. e Phase transition was observed under a POM but too weak to be get recognized in DSC traces. f The LmX*–I transition occurs over a temperature range of ∼10 °C. g The I–LmX* transition occurs (supercooling) over a temperature range of ∼25 °C. In both heating and cooling modes, the number written is the endpoint of the transition temperature. h The LmX* phase freezes into a glassy state. | |
| LCL-4 | Cr 120.9 (17) SmA–TGBc–N* 126.6 (2)d I |
| I 125.7 (1.6) N*–TGBc 124.2 (0.8) SmA 99.6 (21.1) Cr | |
| LCL-5 | Cr 121.7 (24.6) SmA–TGBc–N* 127.9 (2.3)d I |
| I 126.9 (2.4) N*–TGBc–SmA 102.7 (21.4) Cr | |
| LCL-6 | Cr 94.6 (16.9) SmA–TGBc–N* 105 (1)d I |
| I 104 (0.8) N*–TGBc 98.4 (0.4) SmA 50.0 (11.5) Cr | |
| LC-GNP-4 | Cr 123c LmX* 227e,f I |
| I 202e,g LmX* 84e,h | |
| LC-GNP-5 | Cr 127c LmX* 227e,f I |
| I 202e,g LmX* 87e,h | |
| LC-GNP-6 | Cr 130c LmX* 230e,f I |
| I 206e,g LmX* 84e,h | |
DSC traces recorded during the heating–cooling cycles support the aforesaid observations (Fig. S24a†). In contrast, all of the LC-GNPs (LC-GNP-4, 5 and 6) showed a different mesomorphic behavior when compared to the ligands; they displayed an identical, thermodynamically stable LC phase solely. The POM study revealed that the melting and clearing phenomena occur over a wide thermal range of 10–25 °C, which is usually attributed to the highly constrained mobility of molecular segments, especially the bulky cholesterol part62 as well as polydispersity of the GNPs.63 These observations were supported by the absence of thermal signatures due to phase transitions (Fig. S24b†) in DSC across the clearing point. The existence of an identical and enantiotropic LC phase in all the LC-GNPs was evidently established by optical microscopy and X-ray diffraction (XRD) studies. When a tiny amount of dark-brown sample, LC-GNP-4/LC-GNP-5/LC-GNP-6 held between clean glass slides was heated, and it melted into a mesophase exhibiting largely a focal conic pattern, and some dark regions were also seen near the edges of the sample (Fig. S23†). The textural pattern remained unaltered until the clearing temperature. Subsequent cooling from the isotropic melt, a transition to the LC phase occurs with the growth of elongated germs, appearing like smectic batonnets, which eventually merge to a striking fan-shaped texture shown in Fig. 6b (also see Fig. S23†). While the presence of focal-conic fans implies a lamellar (Lm) structure, the existence of pseudo-isotropic domains indicates either an orthogonal or a gently tilted arrangement of the director with respect to the layer planes. As expected, when the samples were examined in slides treated for planar alignment, the LmX* phase displayed a fan-shaped texture. A dull greyish (nearly pseudo-isotropic) pattern was observed when slides treated for homeotropic anchoring were used. Hereafter, this LC phase will be referred to as the LmX* phase as it is formed from chiral mesogens. As we shall see later, it exhibits CD activity, implying the presence of a helical superstructure. These observations indicate that the LmX* phase roughly resembles the structure of the SmC* phase. In such a case, the fan texture superimposed by equidistant (dechiralization) lines would be seen. However, the non-observation of such lines suggests that the helical pitch could be either too high or too low. On cooling further, the sample continues to stay in a fluid LmX* state until about 80 °C at which it freezes into a glassy state. This phenomenon was clearly established by subjecting the samples to a mechanical shear test at the temperature mentioned above. Notably, the thin films of this frozen structure showed an absorption band (∼500 nm) due to the SPR phenomenon identical to that of the bands observed for the drop-casted films of the as-prepared GNPs (Fig. S27†). In essence, the freezing of the LmX* phase is remarkable, wherein the dielectric and conducting regimes exist successively.
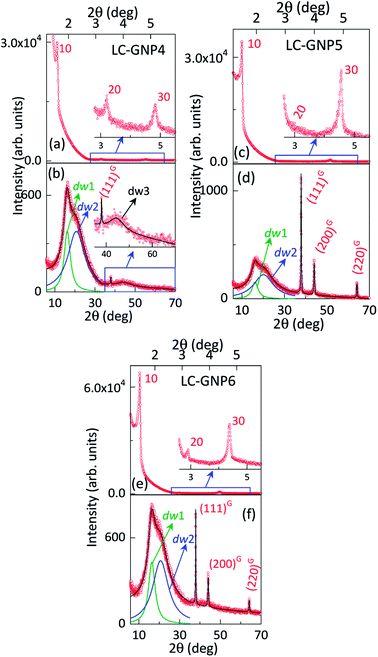
The structure of the fluid/frozen LmX* phase of the samples (LC-GNPs) placed in Lindemann capillaries was elucidated with the aid of powder XRD experiments using CuKα (λ = 0.15418 nm) radiation. The diffractograms obtained at three different temperatures viz., 180 °C, 100 °C, and 25 °C, while cooling the sample to the mesophase from the isotropic phase showed qualitatively identical diffractograms. As representative cases, the 1D intensity vs. 2θ profiles obtained at RT are shown for LC-GNP-4 to 6 in Fig. 7 and at 180 °C in Fig. S25.† For the convenience of presentation, the small-angle and wide-angle data are presented in different panels. We discuss these two regions separately in the following.
For Bragg angles 2θ > 30°, three sharp diffraction peaks (marked as G in Fig. 7 and S25†) corresponding to spacings of 0.237, 0.205, and 0.145 nm were observed, which could be indexed to the (111), (200), and (220) planes of FCC structured Au(0). Over 2θ of ∼ 10–30°, a diffuse maximum is seen with apparent indications of two partially overlapping peaks. The deconvolution of the profile with a sum of two Lorentzians describes the data well; the resolved peaks (dw1 and dw2) are also shown in Fig. 7 and S25.† The two peaks yield, for LC-GNP-5, spacing values of 0.441 and 0.548 nm [see Table S2†]. Considering their diffuse nature and the Bragg angles, the twin peaks imply a liquid-like order within the smectic layers. With very few exceptions, diffraction from smectic phases gives a single wide-angle diffuse peak that is associated with the intermolecular separation within the layer. However, in the case of molecules having widely different terminal groups such as fluorocarbon/hydrocarbon,64,65 hydrocarbon/siloxane66 or hydrocarbon/cholesteryl67 moieties, twin reflections are observed. In the latter case, we proposed that the need for efficient packing as well as the mutual interaction of the two moieties results in diffraction on two length scales. In point of fact, one could consider that the nanoparticle core of the present system mimics the dendritic core reported earlier.65 Borrowing this information, we argue that the twin diffuse peaks of Fig. 7 and S25† arise respectively from flexible non-cholesterol (essentially the alkyl linker) and semi-flexible cholesterol segments of mesogens adhering to GNPs. Having identified the origin of the twin peaks, we look at their characteristics. It is first noted that although both are diffuse, the lower angle one is sharper than the other, a feature that is true for the different LC-GNP compounds and at different temperatures. This suggests that the cholesterol units pack better than the hydrocarbon regions. Taking the half-width of the peaks as a measure of the extent of correlation, increasing the hydrocarbon linker length has opposite effects on the correlation length (ξ) of the hydrocarbon and cholesterol units. An additional feature that we see at much higher angles (2θ ∼ 40°) is the presence of another diffuse peak (dw3), on which the (110) and (200) peaks of crystalline Au(0) override. This peak is most prominent in the sample with the shortest linker (LC-GNP-4) and indicated in Fig. 7. In fact, for the odd parity material (LC-GNP-5), this peak is essentially absent (or extremely weak), whereas the shorter and longer linker even parity members (LC-GNP-4 and LC-GNP-6) exhibit it clearly. Also, with increasing linker length, the peak strength decreases. Considering the spacing it represents (0.203 nm), we suggest that it arises from the positional uncertainty of the nanoparticle core within the layer plane. With increasing linker length, this uncertainty and, along with it, the extent of the diffuse character decrease and make it more difficult to detect. Although this is counterintuitive if one considers only the hydrocarbons, the outermost shell of the cholesterol moieties is the deciding factor. If they have enough freedom to pack well, the possibility of the cores having a randomized position is reduced.
In the small-angle region (0 < 2θ < 5°), three sharp reflections were generally observed with the spacing in the range of 5.54–6.13, 2.77–1.94, and 2.03–1.83 nm. These reflections are in a ratio of 1![[thin space (1/6-em)]](https://www.rsc.org/images/entities/char_2009.gif) :
:![[thin space (1/6-em)]](https://www.rsc.org/images/entities/char_2009.gif) 1/2
1/2![[thin space (1/6-em)]](https://www.rsc.org/images/entities/char_2009.gif) :
:![[thin space (1/6-em)]](https://www.rsc.org/images/entities/char_2009.gif) 1/3 (or reciprocals of 1
1/3 (or reciprocals of 1![[thin space (1/6-em)]](https://www.rsc.org/images/entities/char_2009.gif) :
:![[thin space (1/6-em)]](https://www.rsc.org/images/entities/char_2009.gif) 2
2![[thin space (1/6-em)]](https://www.rsc.org/images/entities/char_2009.gif) :
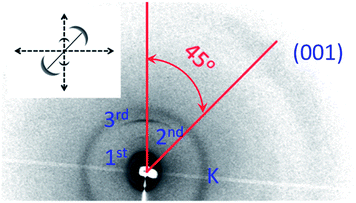
:![[thin space (1/6-em)]](https://www.rsc.org/images/entities/char_2009.gif) 3), consistent with the characteristic of lamellar packing of the LC-GNPs, and indexed to (10), (20), and (30). The overall particle size (end-to-end length, L) of LC-GNP-4, LC-GNP-5 and LC-GNP-6 derived from the models built (Fig. S28a–c†) using the corresponding ligands viz., LCL-4, LCL-5 and LCL-6, in their all-trans geometry (Fig. S29†) was found to be 89.2, 92.8 and 94.8 Å respectively, and seemingly, the layer spacings (d) observed in the XRD profiles are much smaller than L (Table S2†). Before arriving at the possible structure, let us look at the 2D diffraction pattern obtained with a thin (100 μm) film of a partially oriented sample of LC-GNP-4 sandwiched between polyimide coated Kapton sheets. At low angles, two sharp arcs corresponding to (10) and (20) reflections are seen (Fig. 8). Together with the presence of the dw2 peak, these features evidence a smectic structure. The diffuse arc representing the wide-angle broad peaks dw1 + dw2 (not resolved owing to the lower resolution of the 2D apparatus) is centered around an azimuthal angle of 45 deg with respect to the layer reflections – low angle arcs (10) and (20). This is the hallmark of a structure, wherein the molecules are tilted with respect to the normal layer direction. Corroborating the textural pattern mentioned earlier, these results, in conjunction with the CD data (vide infra), point to the LmX* phase being a titled lamellar phase featuring handedness in its supramolecular assembly. Thus, the tilt of the structure is responsible for the significantly smaller spacing than the overall particle end-to-end length. A feature that should be noted at this point is that for all the LC-GNPs, except for the shortest-linker material (LC-GNP-4), the layer thickness (d1) varies non-monotonically with temperature (see Table S2†), increasing first and then decreasing. While the initial increase on lowering the temperature is due to the chain stretching caused by negative thermal expansion, the reduction in the value seen with further lowering of temperature indicates the interdigitation of the ligands belonging to the neighboring gold particle cores. Keeping in mind the d values seen and these structural requirements, it may be suggested that for steric reasons the cholesterol units of the neighboring particles want to pack to minimize their mutual overlap. Given the available space to do so, the structure could have several energy notches depicting local minima into which the system settles into at a given temperature. This also explains the presence of two spacings (0.42 and 0.55 nm) for the intermolecular separation within the layer plane. The harmonic peaks being weaker in the LC-GNP case than in the corresponding free ligand case could be due to the less well-defined layer interface for the former case, a feature corroborative of the presence of the dw3 peak in the wide-angle region.
3), consistent with the characteristic of lamellar packing of the LC-GNPs, and indexed to (10), (20), and (30). The overall particle size (end-to-end length, L) of LC-GNP-4, LC-GNP-5 and LC-GNP-6 derived from the models built (Fig. S28a–c†) using the corresponding ligands viz., LCL-4, LCL-5 and LCL-6, in their all-trans geometry (Fig. S29†) was found to be 89.2, 92.8 and 94.8 Å respectively, and seemingly, the layer spacings (d) observed in the XRD profiles are much smaller than L (Table S2†). Before arriving at the possible structure, let us look at the 2D diffraction pattern obtained with a thin (100 μm) film of a partially oriented sample of LC-GNP-4 sandwiched between polyimide coated Kapton sheets. At low angles, two sharp arcs corresponding to (10) and (20) reflections are seen (Fig. 8). Together with the presence of the dw2 peak, these features evidence a smectic structure. The diffuse arc representing the wide-angle broad peaks dw1 + dw2 (not resolved owing to the lower resolution of the 2D apparatus) is centered around an azimuthal angle of 45 deg with respect to the layer reflections – low angle arcs (10) and (20). This is the hallmark of a structure, wherein the molecules are tilted with respect to the normal layer direction. Corroborating the textural pattern mentioned earlier, these results, in conjunction with the CD data (vide infra), point to the LmX* phase being a titled lamellar phase featuring handedness in its supramolecular assembly. Thus, the tilt of the structure is responsible for the significantly smaller spacing than the overall particle end-to-end length. A feature that should be noted at this point is that for all the LC-GNPs, except for the shortest-linker material (LC-GNP-4), the layer thickness (d1) varies non-monotonically with temperature (see Table S2†), increasing first and then decreasing. While the initial increase on lowering the temperature is due to the chain stretching caused by negative thermal expansion, the reduction in the value seen with further lowering of temperature indicates the interdigitation of the ligands belonging to the neighboring gold particle cores. Keeping in mind the d values seen and these structural requirements, it may be suggested that for steric reasons the cholesterol units of the neighboring particles want to pack to minimize their mutual overlap. Given the available space to do so, the structure could have several energy notches depicting local minima into which the system settles into at a given temperature. This also explains the presence of two spacings (0.42 and 0.55 nm) for the intermolecular separation within the layer plane. The harmonic peaks being weaker in the LC-GNP case than in the corresponding free ligand case could be due to the less well-defined layer interface for the former case, a feature corroborative of the presence of the dw3 peak in the wide-angle region.
2.2 Chiroptical activity
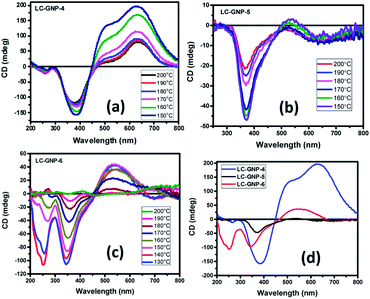
Given the fact that the LC-GNPs comprise accessible light-absorbing groups (chromophores), they were subjected to a circular dichroism (CD) study to examine whether the interactions among peripheral chiral (cholesterol) cores are adequate to induce helical order at the mesoscopic level. The qualitative CD spectra were recorded in both the fluid and frozen states of the LmX* phase. Extremely thin films of the samples (cells) were fabricated by using two freshly procured, clean quartz plates. A minute amount (strictly in the range of 0.5–0.8 mg) of LC-GNP samples placed between two clean quartz plates was heated to form their isotropic phase and mechanically sheared repetitively not only to account for the uniform spreading of the sample but also to ensure very thin film formation mostly free from air pockets. Notably, such ultra-thin films provide small anisotropic (mesophase) domains in abundance, which cancel the artifacts. In fact, the deposition of high amounts of the analytes onto the substrates, yielding thick samples with an uneven topology, facilitates strong linear dichroism (LD) artifacts (see a later section for details). The fabrication of these thin films was also essential to circumvent the saturation setback of measurements, where highly intense CD signals appeared beyond the CD instrument's measurable range. This implies that standard cells with a known thickness could not be employed, and thus, the CD experiments presented herein are qualitative. CD spectra were recorded in the isotropic liquid state. As expected, unlike in the LmX* phase (as discussed below), the circular dichroism phenomenon was found to be immeasurably small (nearly zero). The samples from their isotropic phase were rapidly cooled to the temperature where the LmX* phase begins to appear, and then the CD spectra were recorded at the chosen temperatures. The rapid cooling technique helps in realizing small LC domains. Fig. 9a–c illustrate the spectra in the fluid LmX* phase of the LC-GNPs. As can be seen, the mesophase of the LC-GNPs displays reliable and definite bisignate CD signals. Seemingly, the intensity of the signals increases with a decrease in temperature, implying the lower mobility of the flexible segments of the LC-GNPs. Moreover, the bisignate nature of the CD bands suggests the closer packing of the LC-GNPs within the layer. As expected, the frozen LC structure showed CD signals analogous to the fluid state (Fig. S30d†). The chiroptical data, including the peak positions, sign, and ellipticity (θ, in millidegrees, mdeg) as a function of wavelength obtained from the temperature-dependent CD spectra, are presented in Table S3.†The CD spectra were found to be highly reproducible, with negligible variations in the position and intensity/magnitude of the CD signals. Apparently, the CD spectral pattern of the LmX* phase of the LC-GNPs is different (Fig. 9a–d), which can be ascribed to the odd–even effect. Compounds LC-GNP-4 and LC-GNP-6 possessing an even-parity (C4 and C6) spacer display almost the same CD spectral pattern featuring bisignate bands (Fig. 9a and c), whereas, as shown in Fig. 9b, the spectral pattern of the odd-membered composite LC-GNP-5 differs notably from that of the even-membered counterparts. These results suggest that the length and parity of the flexible spacer of mesogens (ligands) bound to the central GNP dramatically influence the environment and, thus, chromophores' chiral orientation. For the sake of comparison and to corroborate the previous results, the N* phase of the ligands (LCLs) was also subjected to a CD spectroscopic study. Fig. S30† depicts the CD spectra of the samples, and the corresponding data have been collected in Table S4.† While strong CD signals existed in the whole thermal width of the N* phase, the CD activity was not found in the isotropic liquid phase meaning that the molecular chirality does not influence chromophores. That is, the optical activity (handedness) of the mesophase results from the chiral induction but not from the molecular chirality of the samples. Upon further cooling, the N* phase transforms into the SmA phase, where CD activity remains absent as envisaged. It is important to point out here that the LC-GNPs show the CD signals over a wide thermal range as compared with that of the ligands. Thus, the CD activity of LC-GNPs stems purely from their intact-structure (monodispersity), where the ligands are firmly bound to the central GNPs. In other words, the comparison of the CD data coupled with the phase transition sequences/temperature of both LC-GNPs and LCLs shows that the latter materials are monodisperse under the experimental conditions tested.
It is well known that CD bands can also be associated with LD, and hence, the measurements were performed to exclude such artifacts. Precisely, the CD spectrum of the sample, held at a chosen temperature, was recorded, and then the sample cell was rotated about the beam axis, and the CD spectrum of the same was recorded at 60° and 90° intervals over one full turn. This process was repeated until the sample cell returns to its original position. The CD spectra obtained were identical to those observed in the initial place of the sample cells. The theoretical considerations of this sample rotation method used to eliminate the LD artifacts are given in the ESI.† Similar results were observed when measurements were carried out at different temperatures. Moreover, the CD instrument used for the study has access (program) using which LD can be measured directly. Sample cells were thus subjected to such experiments where no LD signals were detected by the instrument, implying that the CD signals are not influenced by the LD artifacts. Consequently, the origin of CD bands in the LmX* phase should correspond to chromophores that are organized in a specific chiral orientation; that is, the intermolecular interactions between two or more electronic transition dipoles arranged in a helical fashion.
Furthermore, to eliminate the samples' birefringence effect that creates elliptically polarized light, the CD spectra of the homeotropically aligned LmX* phase of the samples were recorded. A tiny amount of the samples (0.6 mg), sandwiched between two quartz plates treated for the homeotropic orientation of mesogens (see the ESI†), was heated slightly above their isotropization temperatures and pressed hard repeatedly to obtain evenly spread thin films of the liquid samples. The samples were rapidly cooled to form the LmX* phase, and CD spectra were recorded in the entire thermal width of the mesophase. As expected, the CD spectral characteristics (Fig. S31a–c†) were found to be nearly identical to the ones obtained when the samples were examined using untreated quartz substrates ruling out the possibility of CD signals arising due to the birefringence of the mesophase. The spectral pattern and intensity differences can be attributed to variations in the optical path length across the sample.
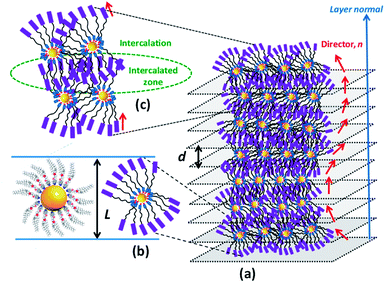
Based on the foregoing experimental results, especially the data derived from microscopy and XRD in conjunction with CD measurements, the LmX* phase can be regarded as a new lamellar structure, wherein a macroscopic helical arrangement of the constituent LC-GNP occurs spontaneously. Thus, the CD active fluid lamellar phase disclosed in this study, to the best of our knowledge, is the first of its kind.68–70 A schematic representation of a plausible model proposed for this chiral lamellar phase has been presented in Fig. 10. First, an individual LC-GNP's overall shape can be thought to be appearing like a sphere (Fig. 10a), which, in the vicinity of other LC-GNPs, attains a tactoidal-like or ovoid-like shape featuring cylindrical symmetry (Fig. 10b). Such cylinders spontaneously self-assemble into a helically twisted lamellar structure (Fig. 10c), where a gradual change in the molecular tilt direction (n) occurs from layer to layer about an axis perpendicular to the layer planes. Since the constituent molecules are chiral, the symmetry of the phase reduces to a two-fold axis of rotation; this situation creates inequivalence in the dipole moment along the C2 axis normal to the director giving rise to spontaneous polarization (Ps) in each layer. In this helielectric state, which is analogous to the SmC* phase, there is no net polarization, and thus, Ps averages out to zero. Efforts to unwind the helix by the application of DC voltage perpendicular to the helix axis to realize a macroscopic polarization were unsuccessful as the macroscopic fluid-structure did not respond to the applied electric field.
3. Conclusion
In summary, the first examples of chiral plasmonic GNPs self-assembling spontaneously into a fluid or frozen helically twisted LC lamellar structure exhibiting chiroptical effects have been realized and characterized. The present study especially demonstrates that the mesogens' molecular chirality can be mapped onto a macroscopic structure, where helicoidal modulation of the director occurs. In other words, the chiral plasmonic lamellar superstructure resulting from the directed self-assembly of optically active GNPs has been accomplished for the first time. They have been realized by two exceptionally simple and hassle-free preparation protocols. The first method involves the solution mixing of LC-amines and Au(III) ions at RT in a glass vessel. In the second approach, the reactants interact with each other at RT over glass plates to yield GNPs in the form of thin films. Notably, rationally chosen LC-amines reduce Au(III) to Au(0) and bind to the central gold scaffold. The proposed structures of LC-GNPs and their thermal behavior have been established unambiguously by spectroscopic, microscopic, and XRD techniques. The interaction of such a macroscopic chiral structure with CP light would facilitate breaking of the degeneracy between two CP waves and enhance the effective refractive index for one polarization. Therefore, LC-GNPs of the kind presented herein, where the metal volume fractions are generated due to the thick coating of GNPs by optically active mesogens, can show a negative refractive index, a key factor required to realize metamaterials in the visible region. The liquid crystallinity of the system adds a different dimension to such investigations owing to the potential to control the refractive index values by external fields.4. Methods
A UV-Vis spectrometer was used to record UV/Vis spectra. The infrared spectra were recorded on KBr pellets in transmission mode (in the range of 400–4000 cm−1). Raman spectroscopic studies of solid samples and their LC phase were carried out with the help of a Raman microscope (Horiba/JY, France) with an excitation wavelength of 540 nm. 1H and 13C NMR spectra were recorded in CDCl3 solvent at room temperature. The chemical shifts are reported in ‘ppm’ on a scale downfield from TMS regarded as an internal standard. The coupling constants (J) are given in Hz. Microanalytical data were obtained from a CHNS/O instrument. Cyclic voltammograms were recorded using a CH instrument electrochemical workstation equipped with an electrochemical analyzer (CHI660E). The molecular lengths (L) of LC ligands and LC-GNPs in their all-trans conformation were determined using the energy minimized space-filling models (MM2 computation) of ChemBio3D Ultra 12.0 program.Energy dispersive X-ray (EDX) spectroscopy experiments were performed with the help of a Bruker Quantax 200 with an XFlash 4010 detector; for this purpose, the samples were prepared by drop-casting the compounds on a glass substrate and air-drying. Powder X-ray diffraction patterns of the as-prepared samples were recorded using a Rigaku Smart Lab diffractometer operating at 3 kW (CuKα radiation; λ = 0.15418 nm); powder samples were placed on a rectangle-shaped glass substrate, and the XRD patterns were recorded from a 2θ of 5 to 80° . Field emission scanning electron microscopy (FESEM) was conducted using a Tescan-Mira 3 LMH Field Emission Scanning Electron Microscope (FESEM); for this study, LC-GNP drop-casted films over ITO substrates subjected to platinum sputtering were used. High-resolution TEM (HRTEM) micrographs were recorded using JEOL JEM 2100F and TALOS F200S G2 transmission electron microscopes (operated at 200 kV), and experiments were performed using a pristine sample drop-casted on a carbon-coated copper-grid of 600 mesh size. Thermogravimetric (TG) experiments were carried out using a Thermogravimetric and Differential Thermal Analyzer (TGA/DTA): STA – 2500, NETZSCH.
The thermotropic phase transitions of the ligands and LC-GNPs were primarily examined with the aid of Olympus BX50 (BX50F4 model) and Leica DM4500P optical polarizing transmitted light microscopes equipped with a Mettler FP82HT hot stage programmed by an FP90 Central Processor and a digital camera were used. The occurrence of LC phases was authenticated using these microscopes, where mobility and birefringence (optical anisotropy) existed concurrently. A Perkin-Elmer Diamond Differential Scanning Calorimeter (DSC) equipped with a PC system operating on Pyris software and a nitrogen-gas intracooling system were employed not only to determine the enthalpies of transitions but also to support the transition temperatures noted during the microscopic study. The DSC thermograms of both heating and cooling cycles were recorded at a rate of 5 °C min−1. The X-ray diffraction patterns of both frozen and fluid liquid crystalline phases were recorded using a sealed-tube generator (1.3 kW) with CuKα (λ = 0.15418 nm) radiation and a PANalytical X'Pert PRO MP X-ray diffractometer comprising a focusing elliptical mirror and a fast resolution detector (PIXCEL); the samples filled into Lindemann capillaries of 1 mm diameter were used for measurements. CD spectra were recorded with the help of a Jasco J-810 spectropolarimeter.
Conflicts of interest
There are no conflicts to declare.Acknowledgements
CVY profoundly thanks Nano Mission, the Department of Science and Technology (DST), Government of India for providing financial support. We thank Mr Rupam Chakrabarty and Prof. C. R. Bhattacharjee, Assam University, Silchar, India, for their invaluable guidance during the synthesis.References
- C. N. R. Rao, A. Müller and A. K. Cheetham, The Chemistry of Nanomaterials: Synthesis, Properties and Applications, John Wiley & Sons, 2006 Search PubMed.
- C. Burda, X. Chen, R. Narayanan and M. A. El-Sayed, Chem. Rev., 2005, 105, 1025 CrossRef CAS PubMed.
- Z. Tang and P. Sheng, Nano Science and Technology: Novel Structures and Phenomena, Taylor & Francis, London, UK, 2003 Search PubMed.
- D. Vollath, Nanomaterials: An Introduction to Synthesis, Properties and Applications, John Wiley & Sons, 2013 Search PubMed.
- H. Goesmann and C. Feldmann, Angew. Chem., Int. Ed., 2010, 49, 1362 CrossRef CAS PubMed.
- S. Eustis and M. A. El-Sayed, Chem. Soc. Rev., 2006, 35, 209 RSC.
- Z. Abdullaeva, Nanomaterials in Daily Life: Compounds, Synthesis, Processing and Commercialization, Springer, 2017 Search PubMed.
- G. Yang, J. Nanda, B. Wang, G. Chen and D. T. Hallinan Jr, Self-Assembly of Large Gold Nanoparticles for Surface-Enhanced Raman Spectroscopy, ACS Appl. Mater. Interfaces, 2017, 9, 13457 CrossRef CAS PubMed.
- J. M. Romo-Herrera, R. A. Alvarez-Puebla and L. M. Liz-Marzaan, Nanoscale, 2011, 3, 130 RSC.
- G. Yang and D. T. Hallinan Jr, Nanotechnology, 2016, 27, 225604 CrossRef PubMed.
- M. Grzelczak, J. Vermant, E. M. Furst and L. M. Liz-Marzan, ACS Nano, 2010, 4, 3591 CrossRef CAS PubMed.
- C. Xi, P. F. Marina, H. Xia and D. Wang, Soft Matter, 2015, 11, 4562 RSC.
- M.-C. Daniel and D. Astruc, Chem. Rev., 2004, 104, 293 CrossRef CAS PubMed.
- K. J. C. Van Bommel, A. Friggeri and S. Shinkai, Angew. Chem., Int. Ed., 2003, 42, 980 CrossRef CAS PubMed.
- C. M. Niemeyer, Angew. Chem., Int. Ed., 2001, 40, 4128 CrossRef CAS PubMed.
- G. Jiang, L. Wang and W. Chen, Mater. Lett., 2007, 61, 278 CrossRef CAS.
- K. P. Divya, M. Miroshnikov, D. Dutta, P. K. Vemula, P. M. Ajayan and G. John, Acc. Chem. Res., 2016, 49, 1671 CrossRef CAS PubMed.
- A. B. Descalzo, R. Martinez-Manez, F. Sancenon, K. Hoffmann and K. Rurack, Angew. Chem., Int. Ed., 2006, 45, 5924 CrossRef CAS PubMed.
- J. P. Palafox-Hernandez, C. K. Lim, Z. Tang, K. L. M. Drew, Z. E. Hughes, Y. Li, M. T. Swihart, P. N. Prasad, M. R. Knecht and T. R. Walsh, ACS Appl. Mater. Interfaces, 2016, 8, 1050 CrossRef CAS PubMed.
- Y. Zhao, K. Thorkelsson, A. J. Mastroianni, T. Schilling, J. M. Luther, B. J. Rancatore, K. Matsunaga, H. Jinnai, Y. Wu, J. D. Poulsen, M. J. Frechet, A. P. Alivisatos and T. Xu, Nat. Mater., 2009, 8, 979 CrossRef CAS PubMed.
- J. Kao, K. Thorkelsson, P. Bai, B. J. Rancatore and T. Xu, Chem. Soc. Rev., 2013, 42, 2654 RSC , and references cited therein.
- R. B. Grubbs, Polym. Rev., 2007, 47, 197 CrossRef CAS.
- L. Xu, A. F. de Moura, X. Wu, H. Kuang, C. Xu and N. A. Kotov, Chem. Rev., 2017, 117, 8041–8093 CrossRef PubMed , and references cited therein.
- Chiral Nanomaterials: Preparation, Properties and Applications, ed. Z. Tang, Wiley, 2017 Search PubMed.
- J. Lu, Y. X. Chang, N. N. Zhang, Y. Wei, A. J. Li, J. Tai, Y. Xue, Z. Y. Wang, Y. Yang, L. Zhao, Z. Y. Lu and K. Liu, ACS Nano, 2017, 11, 3463 CrossRef CAS PubMed.
- C. Noguez and I. L. Garzon, Chem. Soc. Rev., 2009, 38, 757 RSC.
- C. Gautier and T. Burgi, ChemPhysChem, 2009, 10, 483 CrossRef CAS PubMed.
- M. Hentschel, M. Schafer ling, X. Duan, H. Giessen and N. Liu, Sci. Adv., 2017, 3, e1602735 CrossRef PubMed.
- X. Wang, M. Wang, R. Lei, S. F. Zhu, Y. Zhao and Y. C. Chen, ACS Nano, 2017, 11, 4606 CrossRef CAS PubMed , and references cited therein.
- H. H. Jeong, A. G. Mark, M. Alarcon-Correa, I. Kim, P. Oswald, T. Chun Lee and P. Fischer, Nat. Commun., 2016, 7, 11331 CrossRef CAS PubMed.
- J. Govana and Y. K. Gunko, Nanoscience, 2016, 3, 1 Search PubMed , and references cited therein.
- S. P. Rodrigues, S. Lan, L. Kang, Y. Cui and W. Cai, Adv. Mater., 2014, 26, 6157 CrossRef CAS PubMed.
- V. K. Valev, J. J. Baumberg, C. Sibilia and T. Verbiest, Adv. Mater., 2013, 25, 2517 CrossRef CAS PubMed.
- C. Rockstuhl and T. Scharf, J. Microsc., 2008, 229, 281 CrossRef CAS PubMed.
- C. Rockstuhl, F. Lederer, C. Etrich, T. Pertsch and T. Scharf, Phys. Rev. Lett., 2007, 99, 017401 CrossRef PubMed.
- Reviews/Books published on this topic: G. L. Nealon, R. Greget, C. Dominguez, Z. T. Nagy, D. Guillon, J. L. Gallani and B. Donnio, Beilstein J. Org. Chem., 2012, 8, 349 CrossRef CAS PubMed.
- S. Kumar, NPG Asia Mater., 2014, 6, e82 CrossRef CAS.
- Y. A. Garbovskiy and A. V. Glushchenko, Solid State Phys., 2011, 62, 1 Search PubMed.
- H. K. Bisoyi and S. Kumar, Chem. Soc. Rev., 2011, 40, 306 RSC.
- O. Stamatoiu, J. Mirzaei, X. Feng and T. Hegmann, Top. Curr. Chem., 2012, 318, 331 CrossRef CAS PubMed.
- Nanoscience with Liquid Crystals: From Self-Organized Nanostructures to Applications, ed. Q. Li, Springer, Heidelberg, 2014 Search PubMed.
- K. G. Gutierrez-Cuevas, L. Wang, Z. Zheng, H. K. Bisoyi, G. Li, L. S. Tan, R. A. Vaia and Q. Li, Angew. Chem., Int. Ed., 2016, 55, 13090 CrossRef CAS PubMed.
- S. Umadevi, X. Feng and T. Hegmann, Adv. Funct. Mater., 2013, 23, 1393 CrossRef CAS.
- W. Lewandowski, K. Jatczak, D. Pociecha and J. Mieczkowski, Langmuir, 2013, 29, 3404 CrossRef CAS PubMed.
- J. Dintinger, B. J. Tang, X. Zeng, F. Liu, T. Kienzler, G. H. Mehl, G. Ungar, C. Rockstuhl and T. Scharf, Adv. Mater., 2013, 25, 1999 CrossRef CAS PubMed.
- V. M. Marx, H. Girgis, P. A. Heiney and T. Hegmann, J. Mater. Chem., 2008, 18, 2983 RSC.
- J. Paczesny, M. Wojcik, K. Sozański, K. Nikiforov, C. Tschierske, A. Lehmann, E. Goorecka, J. Mieczkowski and R. Hołyst, J. Phys. Chem. C, 2013, 117, 24056 CrossRef CAS.
- M. Draper, I. M. Saez, S. J. Cowling, P. Gai, B. Heinrich, B. Donnio, D. Guillon and J. W. Goodby, Adv. Funct. Mater., 2011, 21, 1260 CrossRef CAS.
- M. Wojcik, M. Kolpaczynska, D. Pociecha, J. Mieczkowski and E. Gorecka, Soft Matter, 2010, 6, 5397 RSC.
- L. Cseh and G. H. Mehl, J. Am. Chem. Soc., 2006, 128, 13376 CrossRef CAS PubMed.
- Z. Shen, M. Yamada and M. Miyake, J. Am. Chem. Soc., 2007, 129, 14271 CrossRef CAS PubMed.
- B. Donnio, P. García-Vazquez, J. L. Gallani, D. Guillon and E. Terazzi, Adv. Mater., 2007, 19, 3534 CrossRef CAS.
- V. A. Mallia, P. K. Vemula, G. John, A. Kumar and P. M. Ajayan, Angew. Chem., Int. Ed., 2007, 46, 3269 CrossRef CAS PubMed.
- L. Cseh, X. Mang, X. Zeng, F. Liu, G. H. Mehl, G. Ungar and G. Siligardi, J. Am. Chem. Soc., 2015, 137, 12736 CrossRef CAS PubMed.
- L. Zhang, L. Wang, U. S. Hiremath, H. K. Bisoyi, G. G. Nair, C. V. Yelamaggad, A. M. Urbas, T. J. Bunning and Q. Li, Adv. Mater., 2017, 29, 1700676 CrossRef PubMed.
- C. V. Yelamaggad, G. Shanker, U. S. Hiremath and S. K. Prasad, J. Mater. Chem., 2008, 18, 2927 RSC.
- T. Mori, A. Sharma and T. Hegmann, ACS Nano, 2016, 10, 1552 CrossRef CAS PubMed.
- W. Lewandowski, T. Łojewska, P. Szustakiewicz, J. Mieczkowskia and D. Pociechaa, Nanoscale, 2016, 8, 2656 RSC.
- H. Yu, C. Welch, W. Qu, C. J. Schubert, F. Liu, G. Siligardi and G. H. Mehl, Mater. Horiz., 2020, 7, 3021 RSC.
- R. Mangaiyarkarasi, B. Sivaranjini and S. Umadevi, Liq. Cryst., 2018, 46, 584 CrossRef.
- A. Badia, L. Cuccia, L. Demers, F. Morin and R. B. Lennox, J. Am. Chem. Soc., 1997, 119, 2682 CrossRef CAS.
- S. Guerra and R. Deschenaux, Chem. Commun., 2012, 48, 2183 RSC.
- J. D. S. Newman and G. J. Blanchard, Langmuir, 2006, 22, 5882 CrossRef CAS PubMed.
- J. Mandal, S. K. Prasad, D. S. S. Rao and S. Ramakrishnan, J. Am. Chem. Soc., 2014, 136, 2538 CrossRef CAS PubMed.
- S. Diele, D. Lose, H. Kruth, G. Pelzl, F. Guittard and A. Cambon, Liq. Cryst., 1996, 21, 603 CrossRef CAS.
- In an organosiloxane system exhibiting the de Vries phase [S. Krishna Prasad and D. S. Shankar Rao, Phys. Rev. Lett., 2009, 102, 147802, unpublished], it was found that the separation between the reflections due to hydrocarbon and silaxone groups at a wide angle increases with increase in the number of silaxone groups. In fact, in the compound having three siloxane groups in one of the termini, the peaks are well resolved even at a qualitative level. Indeed the nitro-biphenyl core of these compounds may also be playing a role, as in the phenyl pyrimidine derivatives, data fitting methods had to be employed to separate out the contributions due to the siloxane and hydrocarbon groups [Phys. Rev. E: Stat., Nonlinear, Soft Matter Phys., 2014, 89, 032506]..
- P. Kumar, D. S. Shankar Rao, S. K. Prasad and N. Jayaraman, J. Polym. Sci., Part A: Polym. Chem., 2017, 55, 3665 CrossRef CAS.
- W. Lewandowski, M. Fruhnert, J. Mieczkowski, C. Rockstuhl and E. Gorecka, Nat. Commun., 2015, 6, 6590 CrossRef PubMed.
- W. Lewandowski, D. Constantin, K. Walicka, D. Pociecha, J. Mieczkowskia and E. Gorecka, Chem. Commun., 2013, 49, 7845 RSC.
- T. T. Nguyen, T. Le Anh Nguyen and R. Deschenaux, J. Porphyrins Phthalocyanines, 2016, 20, 1060 CrossRef CAS.
Footnote |
| † Electronic supplementary information (ESI) available. See DOI: 10.1039/d0na01070g |
| This journal is © The Royal Society of Chemistry 2021 |

