
 Open Access Article
 This Open Access Article is licensed under a Creative Commons Attribution-Non Commercial 3.0 Unported Licence
Enhanced oxygen reduction reaction activity and durability of Pt nanoparticles deposited on graphene-coated alumina nanofibres†
Sajid
Hussain
a,
Nadezda
Kongi
 a,
Alexey
Treshchalov
b,
Tauno
Kahro
b,
Mihkel
Rähn
b,
Maido
Merisalu
b,
Aile
Tamm
b,
Väino
Sammelselg
b and
Kaido
Tammeveski
*a
a,
Alexey
Treshchalov
b,
Tauno
Kahro
b,
Mihkel
Rähn
b,
Maido
Merisalu
b,
Aile
Tamm
b,
Väino
Sammelselg
b and
Kaido
Tammeveski
*a
aInstitute of Chemistry, University of Tartu, Ravila 14a, 50411 Tartu, Estonia. E-mail: kaido.tammeveski@ut.ee; Tel: +372 7375168
bInstitute of Physics, University of Tartu, W. Ostwald Str. 1, 50411 Tartu, Estonia
First published on 10th March 2021
Abstract
The oxygen reduction reaction (ORR) activity and stability of Pt catalysts deposited on graphene-coated alumina nanofibres (GCNFs) were investigated. The GCNFs were fabricated by catalyst-free chemical vapour deposition. Pt nanoparticles (NPs) were deposited on the nanofibres by sonoelectrochemical and plasma-assisted synthesis methods. Scanning and transmission electron microscopy analyses revealed different surface morphologies of the prepared Pt catalysts, depending on the synthesis procedure. Sonoelectrochemical deposition resulted in a uniform distribution of smaller Pt NPs on the support surface, while plasma-assisted synthesis, along with well-dispersed smaller Pt NPs, led to particle agglomeration at certain nucleation sites. Further details about the surface features were obtained from cyclic voltammetry and CO stripping experiments in 0.1 M HClO4 solution. Rotating disk electrode investigations revealed that the Pt/GCNF catalyst is more active towards the ORR in acid media than the commercial Pt/C (20 wt%). The prepared catalyst also showed significantly higher durability than commercial Pt/C, with no change in the half-wave potential after 10![[thin space (1/6-em)]](https://www.rsc.org/images/entities/char_2009.gif) 000 potential cycles.
000 potential cycles.
Introduction
The oxygen reduction reaction (ORR) at the proton exchange membrane fuel cell (PEMFC) cathode is one of the few most important electrochemical reactions for eco-friendly renewable energy conversion.1–3 Pt-based electrocatalysts were extensively investigated for the ORR in the past few decades due to their considerably high electrocatalytic activity.4,5 However, the sluggish kinetics of the ORR and degradation of the supported Pt nanoparticles (NPs) under fuel cell operating conditions obstruct the large-scale commercialisation of PEMFC technology. Recent studies conclude that the synthesis procedure, defining both particle size distribution and anchoring mechanism of the Pt NPs, and the physicochemical nature of the support play key roles in the electrocatalytic activity and durability of Pt-based ORR catalysts.6 Besides, the crystallographic structures of the catalyst nanoparticles associated with specific adsorption energies define the kinetics of the ORR on the Pt surface.7 Consequently, various Pt deposition techniques and a variety of support materials are employed to fabricate more active and durable ORR electrocatalysts.8–14Carbon-based supports are usually preferred for this purpose due to their higher specific surface area, remarkable electrical conductivity, high chemical stability, and good mechanical and thermal resistance.15–17 However, carbon corrosion in the fuel cell environment is a serious drawback of using such supports because it compromises the durability of the cathode catalyst.18,19 Researchers have demonstrated that the nature of the carbon material plays an important role in improving the corrosion-resistance properties of the support.15 It has been revealed that graphene-based supports are more resistant to degradation due to their high graphitic features.20 2D graphene nanosheets are also preferred for a better distribution of catalyst nanoparticles because of their higher specific surface area compared to commercial amorphous carbon.21 Many studies indicate that functionalisation of the pristine graphene surface results in a better distribution of Pt nanoparticles and higher electrocatalytic activity of the cathode catalyst.22–27 Electronic interaction studies of Pt NPs with sp3 and sp2 carbon nanodomains revealed that the Pt NPs are more firmly attached to the sp2 nanodomains.28 Hussainova et al. investigated the surface composition of graphene layers prepared by chemical vapour deposition (CVD) on alumina nanofibres.29 X-ray photoelectron spectroscopy (XPS) analysis showed that the graphene nanosheets completely cover the alumina surface, whereas approximately 75% of the carbon was sp2 hybridised. Theoretically, sp2 bonded carbon atoms in graphene layers are favourable active sites for the reduction of Pt4+ cations from the precursor solution, resulting in stronger attachment of the Pt NPs to the support. Xiong and co-workers introduced a platinum–graphene hybrid nanostructure, prepared by a chemical method, as an excellent ORR catalyst in acid media.30 The mass and specific activities for O2 electroreduction of the prepared catalysts were 5.7 times and 7.0 times higher than those of the commercial Pt/C (40 wt%, E-TEK), respectively. Shao et al. deposited Pt on graphene nanoplates by ethylene glycol method.31 Stability measurements in 0.5 M H2SO4 showed that the Pt NPs deposited on graphene nanoplates were more resistant to degradation than those deposited on carbon nanotubes and carbon black. It is well-known that a uniform distribution of Pt NPs with an optimum particle size is essential for obtaining high electrocatalytic ORR activity. Such catalysts are also more resistant to degradation due to the stronger interaction of the Pt NPs with the support. Therefore, it is necessary to employ (and optimise) a deposition method which results in a better particle size distribution on the support surface. In our previous work, we reported uniform distribution of Pt NPs on reduced graphene oxide (rGO) and nitrogen-doped rGO with a narrow particle size distribution, using a plasma-assisted synthesis procedure.12 The prepared catalysts showed comparable ORR activity to commercial Pt/C (20 wt%) in both acid and alkaline media.
Herein, we demonstrate uniform decoration of graphene-coated alumina nanofibres (GCNF) by Pt NPs without surface functionalisation and/or doping. The graphitic layers enfolding the alumina nanofibres provide excellent support for the Pt NPs deposited by sonoelectrochemical and plasma-assisted methods. The electrocatalytic activity for the ORR and durability of the prepared Pt/GCNF catalysts are investigated in 0.1 M HClO4 solution.
Experimental
Graphenation of alumina nanofibres
For the graphenation of alumina fibres, a simple one-step catalyst-free CVD process was followed, similar to that described before.29 A small bundle of fibres was collected in a quartz boat and placed into a quartz tube furnace followed by annealing at 1000 °C for 3 min in air and then for 5 min in Ar (99.999%, Linde) at a flow rate of 50 sccm. Afterwards, the fibres were exposed to a mixture of 10% CH4 (99.999%, Linde) in Ar with a flow rate of 30 sccm at 1000 °C for 1 h. As the final step of the CVD process, the Ar/CH4 mixture was replaced with Ar gas followed by cooling down the oven to room temperature. The white nonconductive alumina fibres became greyish and conductive after the few-layer graphitic coating by CVD.Synthesis of Pt/GCNF catalysts
Chloroplatinic acid (H2PtCl6) is a strong acid and PtCl62− anions can form a variety of Pt chloroaqua and chlorohydroxo octahedral complexes.32,33 To minimise hydrolysis, the stock aqueous solution of 1 mM H2PtCl6 (pH 2.7) prepared by dissolving chloroplatinic acid (H2PtCl6·6H2O, 99.95%, Alfa Aesar) in Milli-Q water (18.2 MΩ cm) was stored at 5 °C in the dark. The stock H2PtCl6 solution was diluted with water at room temperature to 0.1 mM (pH 3.7) just before the processing. 4 mL of this diluted solution was mixed with small amounts of graphenated alumina nanofibres and placed into a sealed silica cell. The solution was deaerated by bubbling He gas with a flow rate of 100 sccm for 10 min before the synthesis. To minimise agglomeration and precipitation of the nanocomposites during the processing, intense agitation of the solution was arranged using a low-power (∼1 W) ultrasonic (1.7 MHz) transducer.Before the deposition of the fibre-supported Pt catalysts onto a glassy carbon (GC) electrode, the concentration of the as-prepared colloidal solution was increased by about 20 times by simple centrifugal enrichment (10000g, 30 min) and washing several times with water to a neutral pH. Two methods were employed for the preparation of Pt/GCNF catalysts: plasma-assisted synthesis (PS) and sonoelectrochemical deposition (SD) (see the ESI†).
Physical characterisation of catalysts
The surface morphology of the catalyst material was studied with a Helios NanoLab™ 600 (FEI) scanning electron microscope (SEM), and the structure and composition of the Pt NPs on the nanofibres were studied with a high-resolution transmission electron microscope (HRTEM), a Titan 200 (FEI). The HRTEM images were taken in bright-field mode with a 1024 × 1024 pixel imaging matrix using 200 kV and a 0.1 nA electron probe. The samples for both TEM imaging and analysis were prepared as follows: a microdrop of diluted catalyst suspension in isopropyl alcohol was dropped onto a Lacey carbon film substrate supported by a 300 copper mesh (Agar Scientific Ltd) followed by drying in air for 20 min. Micro-Raman spectroscopy measurements in back-scattering geometry were performed using a Renishaw inVia spectrometer with a confocal microscope and 514.5 nm excitation wavelength from an Ar ion laser. The sample was deposited on a silicon wafer plate. To avoid laser induced overheating and photochemistry effects, the laser power density on the sample was restricted to 103 W cm−2.X-ray photoelectron spectroscopy (XPS) measurements were performed under ultra-high vacuum conditions by using a Scienta SES-100 electron energy analyser. For excitation, non-monochromatic Mg Kα X-rays (1253.6 eV) from a twin anode X-ray source (Thermo XR3E2) were used. For the wide-scan spectrum, 0.5 eV energy step and 1 s collection time per step were used; for the detailed Pt4f spectrum, the following parameters were employed: energy step 0.1 eV, 1 s per step and the number of sweeps is 3. For XPS data analyses CasaXPS software was used.
Texture parameters were determined by N2 physisorption at 77 K using a NOVAtouch LX2 instrument (Quantachrome Instruments). The BET surface area of the GCNF support was calculated from N2 adsorption according to the BET theory in the P/P0 range of 0.02–0.2.
Electrochemical measurements
Electrochemical experiments were performed in 0.1 M HClO4 solution using a standard three-electrode configuration and an Autolab potentiostat/galvanostat PGSTAT30 (Metrohm Autolab, The Netherlands). A Pt wire and a reversible hydrogen electrode (RHE) were used as counter and reference electrodes, respectively. Polished glassy carbon (GC) was employed as the working electrode, which was modified with the catalyst ink prepared in Milli-Q®. The Pt loading on the GC surface was 52 μg cm−2. For the electrochemical characterisation of the catalysts, cyclic voltammograms were recorded in the potential range of 0.05–1.2 V at a potential scan rate (ν) of 50 mV s−1. CO-oxidation experiments were carried out at 20 mV s−1. The ORR activity of the prepared catalysts was studied using a rotating disk electrode (RDE) setup consisting of an EDI101 rotator and a CTV101 speed control unit (Radiometer). An accelerated durability test (ADT) was performed by measuring 10000 cycles in the potential range of 0.6–1.2 V at 50 mV s−1. The electrochemical results obtained were compared to those of a commercial Pt/C (E-TEK, 20 wt%) catalyst.
Results and discussion
Surface characterisation
Raman spectroscopy provides a quick and facile evaluation of carbon nanostructures. Fig. 1 shows the Raman spectrum of alumina nanofibres graphenated by the CVD method. The spectrum is similar to the one reported by Hussainova et al.29 The G (1585 cm−1) and D (1342 cm−1) bands correspond to the stretching vibrations of the sp2 carbon atoms and the defect-induced breathing mode of aromatic rings, respectively.34 The 2D band (2680 cm−1) is symmetry-allowed and appears in the second-order Raman spectra of crystalline graphite (without any kind of disorder).35 The strong and narrow D, G and 2D bands suggest nano-crystallinity of the few-layer graphene and the formation of the edge-type defects along the length of the nanofibers. Few-layer graphene is clearly visible in the HRTEM image of the graphenated alumina nanofibres (see Fig. S1†). | ||
| Fig. 1 Raman spectrum of alumina nanofibers graphenated by the CVD method. | ||
Fig. 2a and b show the SEM and Fig. 2c and d display the HRTEM images of Pt/GCNF(SD) and Pt/GCNF(PS) catalysts, respectively. It could be observed that the two Pt deposition methods resulted in entirely different Pt particle size distributions and surface coverage of the same substrate.
 | ||
| Fig. 2 SEM (a and b) and TEM (c and d) images of (a and c) Pt/GCNF(SD) and (b and d) Pt/GCNF(PS) samples, respectively. | ||
In the case of SD, the nanofibres are uniformly decorated with quasi-spherical Pt nanoparticles with a diameter of about 1.3 nm, as presented in Fig. 2a and c. On the other hand, two types of Pt NPs were produced by PS; (i) smaller particles with a diameter of about 2.5 nm that homogeneously cover the support surface and (ii) larger, flower-like agglomerates of various sizes, ranging from 5 to 60 nm in diameter as presented in Fig. 2b and d. This could be related to the surface diffusion of the nuclei and/or different surface energies of the active sites. It can be predicted that the smaller NPs are electrochemically more active and resistant to degradation due to the stronger interaction with the graphene support. The ideal catalyst support for practical PEMFC application should present a micropore-free structure, with non-porous NPs dispersed on its surface.3,36 The main advantage of such a morphology is connected with the fact that ionomers cannot enter nanopores that are smaller than the Nafion® aggregates (e.g. less than 10 nm). In addition, the strong interfacial bonding between the catalyst particles and the support is crucial to prevent degradation of the catalyst material.37 From this point of view the three-dimensional meso-structure offered by the interconnected network of conductive nanofibres decorated with small Pt NPs provides an ideal morphology for the electrochemical processes with improved charge (protons) and mass (oxygen) transport processes.
The chemical composition of the catalyst surface was analysed using X-ray photoelectron spectroscopy. Fig. 3 shows the XPS survey and high-resolution spectra in the Pt4f region for Pt/GCNF(SD) and Pt/GCNF(PS) catalysts. Survey spectra show the oxygen (O1s), carbon (C1s), platinum (Pt4f and Pt4d) and aluminium (Al2p and Al2s) peaks in both samples (see Fig. 3a). The presence of oxygen and aluminium can be attributed to the alumina support, while carbon and platinum peaks belong to the surface of catalysts. Due to the overlapping of Pt4f and Al2p XPS spectra the analysis of the chemical state of platinum was performed using curve fitting. The intensity of the Al2p peak was adjusted by using the intensities of the Al2s peak. For the Pt4f7/2 peak, three components are taken into account: metallic Pt with a binding energy of 71.6 eV, PtO with a binding energy of 73.0 eV and PtO2 with a binding energy of 74.6 eV, as presented in Fig. 3b.38 For the Pt4f5/2 peak the binding energies are correspondingly 3.35 eV higher. The fitting results show that in the spectra of the as-prepared Pt/GCNF(PS) sample, the metallic Pt dominates, but in the case of Pt/GCNF(SD), PtO2 dominates.
 | ||
| Fig. 3 (a) XPS survey spectra and (b) high-resolution spectra in the Pt4f region for Pt/GCNF(PS) and Pt/GCNF(SD) samples. Curve fitting was performed for the Pt4f peaks. | ||
The BET surface area of the graphenated alumina nanofibre support determined from N2 physisorption isotherms was found to be 215 m2 g−1, which is similar to that obtained in an earlier publication.39
Electrochemical characterisation
Fig. 4a displays the normalised CO oxidation peaks of Pt/GCNF(SD) and Pt/GCNF(PS) catalysts in comparison to that obtained for the commercial Pt/C. It can be seen that all Pt catalysts under investigation exhibit different CO oxidation profiles. For instance, commercial Pt/C shows a typical single CO oxidation peak located at 0.79 VRHE. Pt/GCNF(SD) shows a broad peak at 0.72 VRHE and a shoulder at 0.80 VRHE. We have previously reported such CO electro-oxidation behaviour of Pt deposited on different (sp2 and sp3-like) carbon nanodomains.10 It has been demonstrated previously that the particle size and anchoring mechanism of the Pt NPs and the support effect play key roles in facilitating the electrooxidation of the adsorbed CO at the active sites.11,28,40 Interestingly, Pt/GCNF(PS) exhibits two distinct CO oxidation peaks at 0.71 and 0.80 VRHE. A small plateau in the current density followed by a rapid increase can also be observed at 0.68–0.70 VRHE. This CO oxidation behaviour is unusual, which could be attributed to the different nature and energies of the adsorption sites of the two types of nanoparticles seen in Fig. 2b and d associated with the support effect. Arenz et al. reported that the CO electro-oxidation peak shifts to lower potential with increasing Pt particle size.41 Hence, it can be concluded that the peak at 0.71 VRHE is attributed to the bigger agglomerates while that at 0.80 VRHE is attributed to the smaller Pt nanoparticles.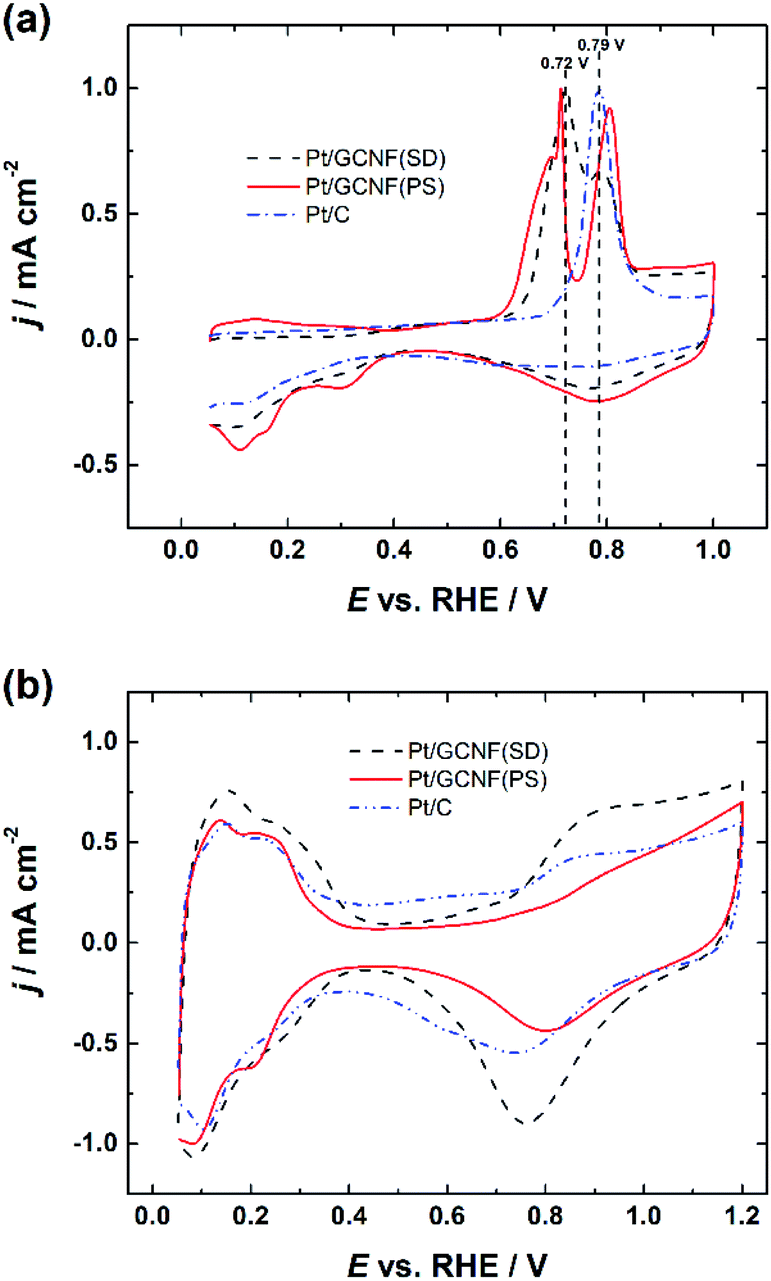 | ||
| Fig. 4 Comparison of (a) normalised CO electro-oxidation peaks and (b) cyclic voltammograms of Pt/GCNF(SD), Pt/GCNF(PS) and Pt/C catalysts in 0.1 M HClO4. | ||
Cyclic voltammograms (CVs) were recorded in Ar-saturated 0.1 M HClO4 solution after electrochemical cleaning of the Pt catalyst surface by CO stripping. The CV curves shown in Fig. 4b also confirm the size-dependent electrochemical properties of the Pt catalysts, see a comparison of the hydrogen adsorption/desorption peaks, double-layer capacitance and Pt-oxide formation and reduction peaks. These results are in good agreement with previous studies reported by Arenz et al.41
These results also confirm the reduction of the thermodynamically unstable oxides on Pt/GCNF(SD) (Fig. 3) in the region of potential cycling. The real surface area (Ar) of the Pt catalysts was determined from the hydrogen desorption peaks and the values are listed in Table 1. Pt/GCNF(SD) exhibits a 2 times higher surface area of 1.71 cm2 than the commercial Pt/C (0.88 cm2), which can be expected from the uniformly distributed smaller nanoparticles on the graphene surface (Fig. 2a and c). Moreover, the surface area of Pt/GCNF(PS) is 44% higher than that of the commercial Pt/C, attributed to the porous nature of the flower-like Pt aggregates formed at the support surface.
| Electrode | A r (cm2) | E 1/2 (VRHE) | Tafel slope Ia (mV) | Tafel slope IIa (mV) | SA at 0.9 V (mA cm−2) | MA at 0.9 V (A g−1) |
|---|---|---|---|---|---|---|
| a Region I corresponds to low current densities and region II to high current densities. | ||||||
| Pt/GCNF(PS) | 1.27 | 0.89 | −61 | −113 | 0.48 | 93 |
| Pt/GCNF(SD) | 1.71 | 0.88 | −67 | −127 | 0.27 | 70 |
| Pt/C | 0.88 | 0.87 | −58 | −111 | 0.40 | 55 |
Oxygen reduction reaction studies
RDE measurements in O2-saturated 0.1 M HClO4 solution reveal that both Pt/GCNF catalysts possess remarkable activity for the electroreduction of oxygen in acid media. Fig. 5a and b show the ORR polarisation curves of Pt/GCNF(SD) and Pt/GCNF(PS) recorded at various rotation rates. The diffusion-limited current densities are in good agreement with the theoretical values of a 4-electron ORR process. The Koutecký–Levich (K–L) plots constructed on the basis of RDE data are presented in Fig. 5c and d. The insets in Fig. 5c and d indicate the number of electrons transferred (n) in the O2 reduction, calculated using the K–L equation: | (1) |
485 C mol−1), k is the rate constant for the electrochemical reduction of oxygen, 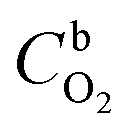 is the concentration of O2 in the solution (1.22 × 10⁻⁶ mol cm−3),42DO2 is the diffusion coefficient of O2 (1.93 × 10⁻⁵ cm2 s−1),42ν is the solution kinematic viscosity (0.01 cm2 s−1)43 and ω is the electrode rotation speed (rad s−1).
 | ||
| Fig. 5 RDE polarisation curves for oxygen reduction on (a) Pt/GCNF(SD) and (b) Pt/GCNF(PS) catalysts recorded in O2-saturated 0.1 M HClO4 at various rotation speeds (ν = 10 mV s−1); K–L plots of (c) Pt/GCNF(SD) and (d) Pt/GCNF(PS) catalysts. The insets to (c) and (d) indicate the 4-electron ORR pathway on both catalysts. | ||
A comparison of the RDE polarisation curves at 1600 rpm is presented in Fig. 6a, which shows that the prepared Pt/GCNF catalysts exhibit comparable ORR electrocatalytic activity to commercial Pt/C (20 wt%). The half-wave potential (E1/2) values of Pt/GCNF(PS), Pt/GCNF(SD) and Pt/C were found to be 0.89, 0.88 and 0.87 VRHE, respectively (see Table 1). These values are comparable to those reported by Maia and co-workers, where 80 μg cm−2 Pt was electrochemically deposited on graphene nanoribbons (GNRs).44 According to their study, the Pt catalyst electrodeposited on GNRs is more active and durable than that deposited on graphene oxide nanoribbons and carbon nanotubes. Liu et al. recently reported the E1/2 of Pt deposited on N-doped carbon to be 0.88 VRHE in 0.1 M HClO4 solution.45
 | ||
| Fig. 6 (a) RDE polarisation curves for oxygen reduction on Pt/GCNF(SD), Pt/GCNF(PS) and Pt/C catalysts recorded in O2-saturated 0.1 M HClO4 solution at 1600 rpm and (b) Tafel plots for the ORR of the respective catalysts. | ||
Moreover, the Tafel plots for O2 reduction presented in Fig. 6b are constructed on the basis of the RDE data obtained from Fig. 6a. The Tafel slope values determined at low and high current density regions are close to −60 and −120 mV, indicating that the slow first electron transfer to O2 is the rate-determining step.44
Specific activity (SA) and mass activity (MA) values for O2 reduction on the electrocatalysts were calculated at 0.9 VRHE using the following equations:
| SA = Ik/Ar | (2) |
| MA = Ik/mPt | (3) |
As listed in Table 1, the Pt/GCNF(PS) showed the highest SA of 0.48 mA cm−2 followed by Pt/C (0.40 mA cm−2). Pt/GCNF(SD) showed a relatively low SA of 0.27 mA cm−2, which can be ascribed to the smaller size of the deposited Pt NPs. These results are more promising than those of our previous investigations where Pt deposited on reduced graphene oxide and nitrogen-doped graphene oxide exhibited SA values of 0.20 and 0.22 mA cm−2 in 0.05 M H2SO4, respectively.12 The mass activities of Pt/GCNF(PS), Pt/GCNF(SD) and Pt/C catalysts were found to be 93, 70 and 55 A g−1. The specific and mass activities of Pt NPs electrodeposited on GNR are previously reported to be 0.67 mA cm−2 and 104 A g−1, respectively.44 Erkey and co-workers chemically deposited Pt NPs on graphene aerogel (GA) synthesised by a modified Hummers method. The SA values (at 0.85 VRHE) of the Pt/GA catalysts heated in a N2 atmosphere at 400, 600 and 800 °C were found to be 6.6, 2.3 and 34.4 μA cm−2 and the MA values were 27.2, 30.6 and 12.0 A g−1, respectively.46 The SA values of Pt decorated on rGO and pristine graphite were found to be 0.67 and 0.29 mA cm−2, respectively.47 The MA values of Pt/rGO and Pt/graphite were 92 and 42 A g−1, respectively.
Accelerated durability test
Based on the smaller size of the deposited Pt nanoparticles, Pt/GCNF(SD) was chosen for the durability tests. Fig. 7 displays the CV curves, CO oxidation peaks and RDE polarisation curves of the Pt/GCNF(SD) catalyst in comparison to those of the commercial Pt/C, measured before and after 10000 cycles in the potential range of 0.6–1.2 VRHE at 50 mV s−1. The real Pt surface area calculated from the hydrogen desorption peaks revealed that Pt/GCNF(SD) retains 83.5% of its surface area, while Pt/C retains only 44.3% (Fig. 7a). The trend in the surface area loss could also be observed in the CO oxidation peaks shown in Fig. 7b. Furthermore, no significant shift was observed in the E1/2 of Pt/GCNF(SD) during the durability test, while that of the commercial Pt/C decreased by 36 mV.
 | ||
| Fig. 7 (a) Cyclic voltammograms, (b) CO electro-oxidation and (c) RDE polarisation curves of Pt/GCNF(SD) and Pt/C catalysts recorded at 1600 rpm before and after the ADT. | ||
Fig. 8 shows a decrease in the Ar, SA and MA values of the catalysts after the ADT. The SA of Pt/GCNF(SD) and Pt/C decreased by 0.025 and 0.029 mA cm−2 and the MA decreased by 9.3 and 32.2 A g−1, respectively. These results elucidate that Pt/GCNF(SD) is much more durable in acid media than commercial Pt/C.
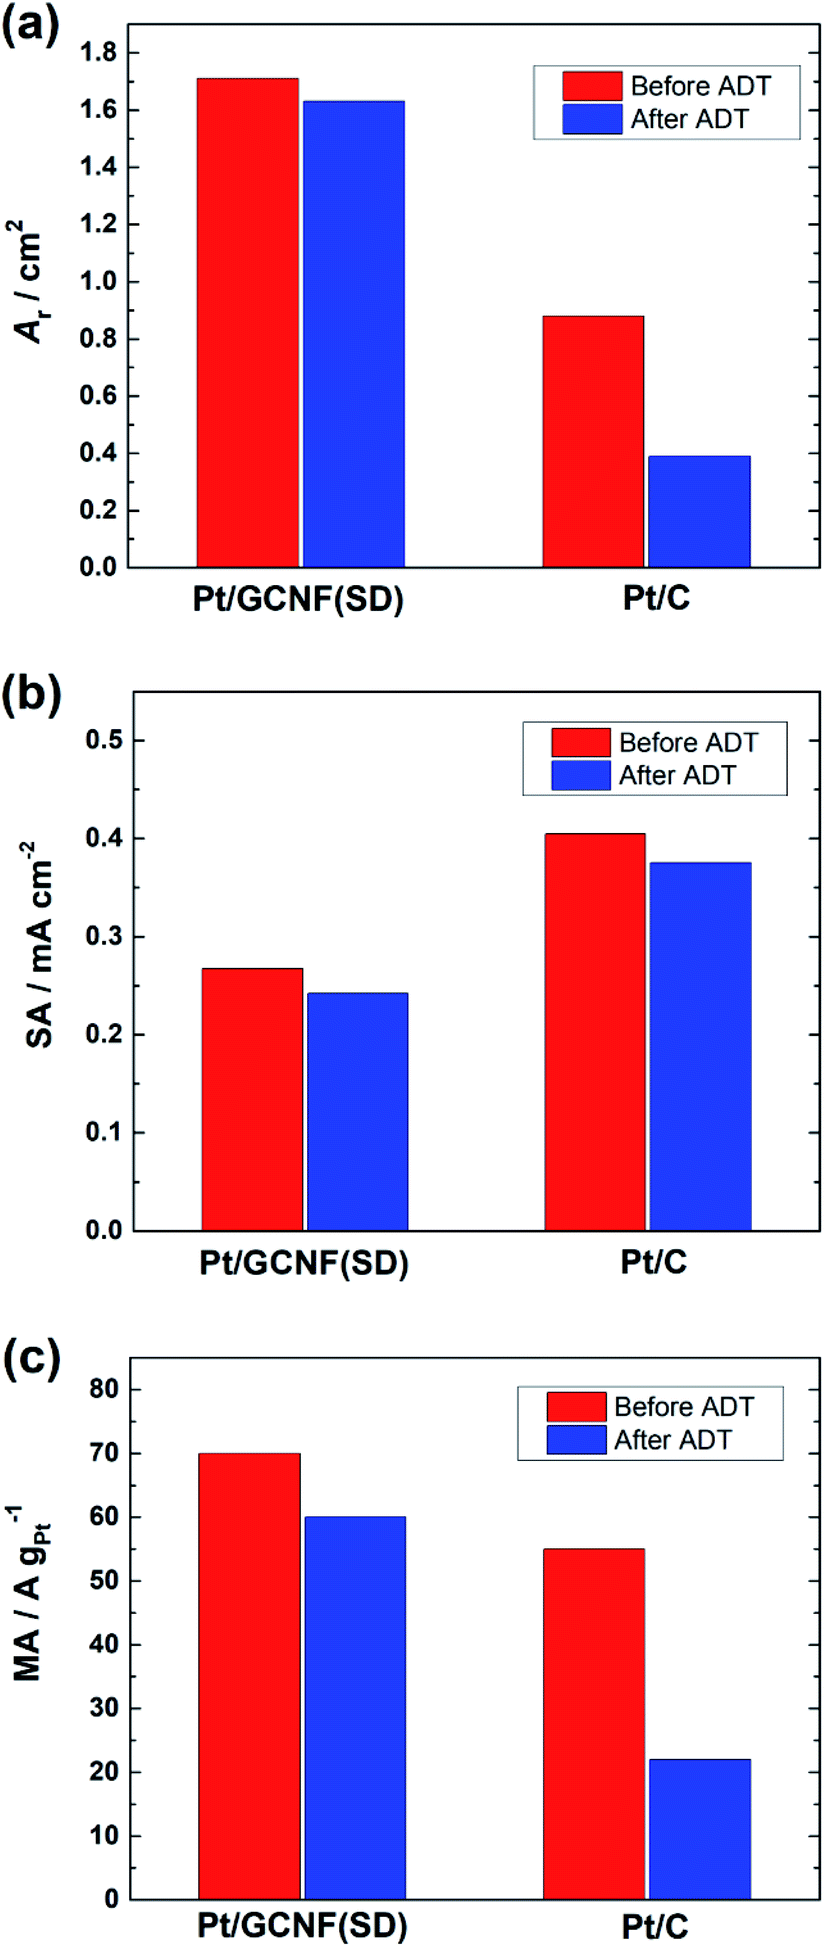 | ||
| Fig. 8 (a) The real surface area, (b) specific activity (at 0.9 VRHE) and (c) mass activity (at 0.9 VRHE) of Pt/GCNF(SD) and Pt/C catalysts before and after the ADT. | ||
The corrosion-resistance properties of graphene-based supports for Pt-based ORR catalysts have been recently reported by many groups.48–51 Huang and co-workers reported that Pt deposited on rGO retains 46% of its initial surface area after 20000 potential cycles between 0.6 and 1.1 VRHE in 0.1 M HClO4 while commercial Pt/C retained ∼51% of the initial surface area.52 Bertin et al.53 recently demonstrated that Pt NPs deposited on graphene by pulse laser ablation are more resistant to degradation, retaining 75% of the initial surface area after the ADT. In comparison, Pt deposited on carbon black retained only 38% of its surface area.
Hussainova et al.29 followed a different protocol for the durability test of Pt NPs deposited on graphene-coated alumina nanofibres, where 30000 potential scans were applied between 1.0 and 1.5 VRHE at 500 mV s−1. They reported a 3% decrease in the catalyst surface area after the ADT. In this work the high stability of Pt/GCNF(SD) can be attributed to the following phenomena.
(i) Pt NPs deposited by the sonoelectrochemical method are more firmly attached to the graphene support surface.
(ii) The smaller size of Pt NPs, which results in stronger interaction with the graphene support.
(iii) Graphitic nature of the catalyst support, which is less corrosive under harsh electrochemical conditions.
Conclusions
Alumina nanofibres were completely coated with few-layered graphene using the CVD method. The SEM and TEM analysis and electrochemical characterisation revealed that the particle size distribution of Pt NPs and the surface electrochemistry of Pt/GCNF catalysts depend on the deposition method, i.e. plasma-assisted and sonoelectrochemical treatment in surfactant-free water solution. Both types of Pt/GCNF catalysts showed remarkable electrocatalytic activity towards the ORR in acid media, irrespective of the nature and size of the Pt NPs. Durability measurements confirmed that Pt NPs deposited by the sonoelectrochemical method are more durable than commercial Pt/C (20 wt%). The simple, one-step and easily scalable sonoelectrochemical method, demonstrated in this work, is very promising for the decoration of various conductive support surfaces by well-dispersed small metal NPs.Conflicts of interest
There are no conflicts to declare.Acknowledgements
This work was financially supported by the Estonian Research Council (grants PRG723, TLTFY14054T, and PRG4). This research was also supported by the EU through the European Regional Development Fund (TK141, “Advanced materials and high-technology devices for energy recuperation systems”, and TK134, “Emerging orders in quantum and nanomaterials”). We would like to thank Dr Maike Käärik (Institute of Chemistry, University of Tartu) for BET analysis and Dr Arvo Kikas (Institute of Physics, University of Tartu) for XPS analysis.References
- C. W. Wu, W. Zhang, X. Han, Y. X. Zhang and G. J. Ma, J. Power Sources, 2020, 476, 228724 CrossRef CAS.
- I. Katsounaros, S. Cherevko, A. R. Zeradjanin and K. J. J. Mayrhofer, Angew. Chem., Int. Ed., 2014, 53, 102–121 CrossRef CAS PubMed.
- A. Ly, T. Asset and P. Atanassov, J. Power Sources, 2020, 478, 228516 CrossRef CAS.
- X. Q. Wang, Z. J. Li, Y. T. Qu, T. W. Yuan, W. Y. Wang, Y. Wu and Y. D. Li, Chem, 2019, 5, 1486–1511 CAS.
- S. Sui, X. Y. Wang, X. T. Zhou, Y. H. Su, S. Riffatc and C. J. Liu, J. Mater. Chem. A, 2017, 5, 1808–1825 RSC.
- S. Hussain, H. Erikson, N. Kongi, A. Sarapuu, J. Solla-Gullón, G. Maia, A. M. Kannan, N. Alonso-Vante and K. Tammeveski, Int. J. Hydrogen Energy, 2020, 45, 31775–31797 CrossRef CAS.
- J. C. Dong, M. Su, V. Briega-Martos, L. Li, J. B. Le, P. Radjenovic, X. S. Zhou, J. M. Feliu, Z. Q. Tian and J. F. Li, J. Am. Chem. Soc., 2020, 142, 715–719 CrossRef CAS.
- S. Hussain, H. Erikson, N. Kongi, A. Tarre, P. Ritslaid, M. Rähn, L. Matisen, M. Merisalu, V. Sammelselg and K. Tammeveski, Int. J. Hydrogen Energy, 2018, 43, 4967–4977 CrossRef CAS.
- S. Hussain, H. Erikson, N. Kongi, M. Merisalu, M. Rähn, V. Sammelselg, G. Maia and K. Tammeveski, J. Electrochem. Soc., 2017, 164, F1014–F1021 CrossRef CAS.
- S. Hussain, N. Kongi, L. Matisen, J. Kozlova, V. Sammelselg and K. Tammeveski, Electrochem. Commun., 2017, 81, 79–83 CrossRef CAS.
- S. Hussain, N. Kongi, H. Erikson, M. Rähn, M. Merisalu, L. Matisen, P. Paiste, J. Aruväli, V. Sammelselg, L. A. Estudillo-Wong, K. Tammeveski and N. Alonso-Vante, Electrochim. Acta, 2019, 316, 162–172 CrossRef CAS.
- S. Hussain, H. Erikson, N. Kongi, A. Treshchalov, M. Rähn, M. Kook, M. Merisalu, L. Matisen, V. Sammelselg and K. Tammeveski, ChemElectroChem, 2018, 5, 2902–2911 CrossRef CAS.
- S. Hussain, H. Erikson, N. Kongi, A. Tarre, P. Ritslaid, A. Kikas, V. Kisand, J. Kozlova, J. Aarik, A. Tamm, V. Sammelselg and K. Tammeveski, J. Electrochem. Soc., 2020, 167, 164505 CrossRef CAS.
- D. Gohl, A. Garg, P. Paciok, K. J. J. Mayrhofer, M. Heggen, Y. Shao-Horn, R. E. Dunin-Borkowski, Y. Roman-Leshkov and M. Ledendecker, Nat. Mater., 2020, 19, 287–291 CrossRef PubMed.
- P. Trogadas, T. F. Fuller and P. Strasser, Carbon, 2014, 75, 5–42 CrossRef CAS.
- Y. Wang, J. Li and Z. D. Wei, ChemElectroChem, 2018, 5, 1764–1774 CrossRef CAS.
- K. Singh, E. B. Tetteh, H. Y. Lee, T. H. Kang and J. S. Yu, ACS Catal., 2019, 9, 8622–8645 CrossRef CAS.
- X. Yu and S. Ye, J. Power Sources, 2007, 172, 145–154 CrossRef CAS.
- H. Singh, S. Q. Zhuang, B. Ingis, B. B. Nunna and E. S. Lee, Carbon, 2019, 151, 160–174 CrossRef CAS.
- D. Higgins, P. Zamani, A. Yu and Z. Chen, Energy Environ. Sci., 2016, 9, 357–390 RSC.
- M. H. Seo, S. M. Choi, H. J. Kim and W. B. Kim, Electrochem. Commun., 2011, 13, 182–185 CrossRef CAS.
- M. Faraji, H. Gharibi and M. Javaheri, J. Nanostruct., 2016, 6, 154–164 CAS.
- R. Kou, Y. Y. Shao, D. H. Wang, M. H. Engelhard, J. H. Kwak, J. Wang, V. V. Viswanathan, C. M. Wang, Y. H. Lin, Y. Wang, I. A. Aksay and J. Liu, Electrochem. Commun., 2009, 11, 954–957 CrossRef CAS.
- K.-W. Nam, J. Song, K.-H. Oh, M.-J. Choo, H. A. Park, J.-K. Park and J. W. Choi, J. Solid State Electrochem., 2013, 17, 767–774 CrossRef CAS.
- I.-Y. Jeon, D. H. Kweon, S.-W. Kim, S.-H. Shin, Y. K. Im, S.-Y. Yu, M. J. Ju and J.-B. Baek, J. Mater. Chem. A, 2017, 5, 21936–21946 RSC.
- J. W. Ma, A. Habrioux, Y. Luo, G. Ramos-Sanchez, L. Calvillo, G. Granozzi, P. B. Balbuena and N. Alonso-Vante, J. Mater. Chem. A, 2015, 3, 11891–11904 RSC.
- Z. Li, Q. Gao, H. Zhang, W. Tian, Y. Tan, W. Qian and Z. Liu, Sci. Rep., 2017, 7, 43352 CrossRef PubMed.
- C. A. Campos-Roldán, G. Ramos-Sánchez, R. G. Gonzalez-Huerta, J. R. Vargas García, P. B. Balbuena and N. Alonso-Vante, ACS Appl. Mater. Interfaces, 2016, 8, 23260–23269 CrossRef PubMed.
- I. Hussainova, R. Ivanov, S. N. Stamatin, I. V. Anoshkin, E. M. Skou and A. G. Nasibulin, Carbon, 2015, 88, 157–164 CrossRef CAS.
- C. Wang, L. Ma, L. Liao, S. Bai, R. Long, M. Zuo and Y. Xiong, Sci. Rep., 2013, 3, 2580 CrossRef PubMed.
- Y. Shao, S. Zhang, C. Wang, Z. Nie, J. Liu, Y. Wang and Y. Lin, J. Power Sources, 2010, 195, 4600–4605 CrossRef CAS.
- Y. Yu and B. Xu, Acta Chim. Sin., 2003, 61, 1758–1764 CAS.
- W. A. Spieker, J. Liu, J. T. Miller, A. J. Kropf and J. R. Regalbuto, Appl. Catal., A, 2002, 232, 219–235 CrossRef CAS.
- A. C. Ferrari and J. Robertson, Phys. Rev. B: Condens. Matter Mater. Phys., 2000, 61, 14095–14107 CrossRef CAS.
- M. A. Pimenta, G. Dresselhaus, M. S. Dresselhaus, L. G. Cancado, A. Jorio and R. Saito, Phys. Chem. Chem. Phys., 2007, 9, 1276–1291 RSC.
- L. J. Pan, S. Ott, F. Dionigi and P. Strasser, Curr. Opin. Electrochem., 2019, 18, 61–71 CrossRef CAS.
- Y. Liu, L. Zhang, B. G. Willis and W. E. Mustain, ACS Catal., 2015, 5, 1560–1567 CrossRef CAS.
- E. I. Vovk, A. V. Kalinkin, M. Y. Smirnov, I. O. Klembovskii and V. I. Bukhtiyarov, J. Phys. Chem. C, 2017, 121, 17297–17304 CrossRef CAS.
- S. N. Stamatin, I. Hussainova, R. Ivanov and P. E. Colavita, ACS Catal., 2016, 6, 5215–5221 CrossRef CAS.
- J. W. Ma, A. Habrioux, C. Morais, A. Lewera, W. Vogel, Y. Verde-Gomez, G. Ramos-Sanchez, P. B. Balbuena and N. Alonso-Vante, ACS Catal., 2013, 3, 1940–1950 CrossRef CAS.
- M. Arenz, K. J. J. Mayrhofer, V. Stamenkovic, B. B. Blizanac, T. Tomoyuki, P. N. Ross and N. M. Markovic, J. Am. Chem. Soc., 2005, 127, 6819–6829 CrossRef CAS.
- R. R. Adžić, J. Wang and B. M. Ocko, Electrochim. Acta, 1995, 40, 83–89 CrossRef.
- D. R. Lide, CRC handbook of chemistry and physics, CRC Press, Boca Raton, 2001 Search PubMed.
- G. V. Fortunato, F. de Lima and G. Maia, J. Power Sources, 2016, 302, 247–258 CrossRef CAS.
- J. Liu, W. Li, R. Cheng, Q. Wu, J. Zhao, D. He and S. Mu, Langmuir, 2019, 35, 2580–2586 CrossRef CAS PubMed.
- F. E. Sarac Oztuna, S. B. Barim, S. E. Bozbag, H. Yu, M. Aindow, U. Unal and C. Erkey, Electrochim. Acta, 2017, 250, 174–184 CrossRef CAS.
- E. Teran-Salgado, D. Bahena-Uribe, P. A. Márquez-Aguilar, J. L. Reyes-Rodriguez, R. Cruz-Silva and O. Solorza-Feria, Electrochim. Acta, 2019, 298, 172–185 CrossRef CAS.
- X. Tang, Y. Zeng, L. Cao, L. Yang, Z. Wang, D. Fang, Y. Gao, Z. Shao and B. Yi, J. Mater. Chem. A, 2018, 6, 15074–15082 RSC.
- Y. Zhou, X. Cheng, C. H. Yen, C. M. Wai, C. Wang, J. Yang and Y. Lin, J. Power Sources, 2017, 347, 69–78 CrossRef CAS.
- K. Fu, Y. Wang, L. Mao, J. Jin, S. Yang and G. Li, Electrochim. Acta, 2016, 215, 427–434 CrossRef CAS.
- A. Marinkas, R. Hempelmann, A. Heinzel, V. Peinecke, I. Radev and H. Natter, J. Power Sources, 2015, 295, 79–91 CrossRef CAS.
- Y. J. Li, E. B. Zhu, T. McLouth, C. Y. Chiu, X. Q. Huang and Y. Huang, J. Am. Chem. Soc., 2012, 134, 12326–12329 CrossRef CAS PubMed.
- E. Bertin, A. Münzer, S. Reichenberger, R. Streubel, T. Vinnay, H. Wiggers, C. Schulz, S. Barcikowski and G. Marzun, Appl. Surf. Sci., 2019, 467–468, 1181–1186 CrossRef CAS.
Footnote |
| † Electronic supplementary information (ESI) available. See DOI: 10.1039/d1na00007a |
| This journal is © The Royal Society of Chemistry 2021 |