
Asymmetric supercapacitors based on carbon nanofibre and polypyrrole/nanocellulose composite electrodes†
Petter Tammelaa,
Zhaohui Wangb,
Sara Frykstranda,
Peng Zhanga,
Ida-Maria Sintorncd,
Leif Nyholm*b and
Maria Strømme*a
aNanotechnology and Functional Materials, The Ångström Laboratory, Uppsala University, Box 534, 751 21 Uppsala, Sweden. E-mail: Maria.Stromme@angstrom.uu.se; Tel: +46 18 471 7231
bDepartment of Chemistry – Ångström Laboratory, Uppsala University, Box 538, 751 21 Uppsala, Sweden. E-mail: Leif.Nyholm@kemi.uu.se; Tel: +46 18 471 3742
cDepartment of Information Technology, Uppsala University, Box 337, 751 05 Uppsala, Sweden
dVironova AB, Gävlegatan 22, 113 30 Stockholm, Sweden
First published on 26th January 2015
Abstract
Asymmetric, all-organic supercapacitors (containing an aqueous electrolyte), exhibiting a capacitance of 25 F g−1 (or 2.3 F cm−2) at a current density of 20 mA cm−2 and a maximum cell voltage of 1.6 V, are presented. The devices contain a composite consisting of polypyrrole covered Cladophora cellulose fibres (PPy–cellulose) as the positive electrode while a carbon nanofibre material, obtained by heat treatment of the same PPy–cellulose composite under nitrogen gas flow, serves as the negative electrode. Scanning and transmission electron microscopy combined with X-ray photoelectron spectroscopy data show that the heat treatment gives rise to a porous carbon nanofibre material, topologically almost identical to the original PPy–cellulose composite. The specific gravimetric capacitances of the carbon and the PPy–cellulose electrodes were found to be 59 and 146 F g−1, respectively, while the asymmetric supercapacitors exhibited a gravimetric energy density of 33 J g−1. The latter value is about two times higher than the energy densities obtainable for a symmetric PPy–cellulose device as a result of the larger cell voltage range accessible. The capacitance obtained for the asymmetric devices at a current density of 156 mA cm−2 was 11 F g−1 and cycling stability results further indicate that the capacity loss was about 23% during 1000 cycles employing a current density of 20 mA cm−2. The present results represent a significant step forward towards the realization of all-organic material based supercapacitors with aqueous electrolytes and commercially viable capacitances and energy densities.
Introduction
Energy storage devices are currently being developed to power an increasingly diverse range of applications, from cars to microchips1 and there is an increasing demand for inexpensive, environmentally friendly, non-hazardous and up-scalable energy storage alternatives. Supercapacitors have recently received extensive attention due to their high power performance and long cycle life. These properties make them promising alternatives for a number of applications, including hybrid electric vehicles, memory backup systems, large industrial equipment, power demanding tools and energy storage systems for grid applications.2–6 Commercial supercapacitors are, however, still suffering from their relatively low energy densities which generally stem from the fact that supercapacitors store energy through double-layer charging, surface confined faradaic processes, or a combination of both. For a supercapacitor, the amount of energy E stored is given by
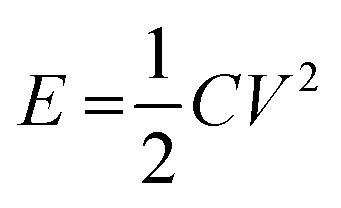 | (1) |
At present different types of porous carbon materials, such as various activated carbons are generally employed as the electrode materials in supercapacitors because of their high surface areas, relatively high electronic conductivities, good stabilities and acceptable costs.7,8 The carbon materials can be obtained from organic materials such as coal, pitch, wood, coconut shells or polymers,9 via heat treatments in an atmosphere of nitrogen, hydrogen, or carbon dioxide, or by immersion in solutions containing nitric acid or potassium hydroxide.10–13 As different starting materials and treatments can yield carbon materials with different surface areas, conductivities, and hydrophilicities by the introduction of oxygen and nitrogen containing functional groups, the electrode material can be tailored for use in different electrolytes and cell geometries.7 It has also been suggested that the incorporation of nitrogen in carbon electrode materials has beneficial effects on its electroactivity, hydrophilicity and capacity.12,14–17
According to eqn (1), the energy density for a supercapacitor can be improved either by increasing the capacitance or by increasing the cell voltage. The cell voltages of commercial supercapacitors are generally limited by the stability of the electrolyte, which typically is about 1 and 3 V for aqueous and organic electrolytes, respectively.11 Although the use of organic electrolytes can give rise to higher cell voltages, these electrolytes are relative expensive, highly flammable and sometimes toxic. It is therefore interesting to study the possibilities of designing water based supercapacitors, particularly as it has been shown that cell voltages above 1.5 V can indeed be realized even in aqueous electrolytes.18–21 To increase the cell capacitance, electrode materials containing electrochemically active groups can be employed which provide additional capacity in addition to the capacity associated with the charge and discharge of the double layer.22–29 The cell capacitance can also be increased by utilizing properly balanced asymmetric cells in which different electrode materials are used in the negative and positive electrodes. The latter type of cells is also commonly employed to increase the operating voltage of the device.18–20,30 For an asymmetric supercapacitor the gravimetric cell capacitance Cm can be calculated from the specific electrode capacitances according to
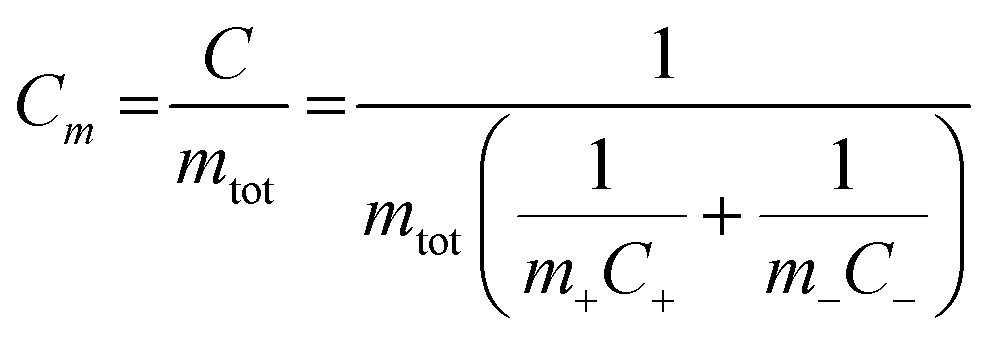 | (2) |
The use of composites of cellulose and polypyrrole has recently received a lot of attention, where the cellulose acts as a substrate and structural template for films of polypyrrole forming a porous structure which facilitates ion movement during oxidation and reduction.40,42–45
We have recently shown that composites of polypyrrole (PPy) and cellulose derived from Cladophora sp. green algae can be utilized in all organic energy storage devices with very good energy and power densities as well as cycling stabilities.24–29,46–50 These PPy–cellulose composites have surface areas of about 80 m2 g−1 and consist of fibres with a cellulose core of ∼30 nm in diameter covered by a ∼50 nm thick shell of electronically conducting PPy51,52 in which charge can be stored when the PPy undergoes oxidation and reduction. The thin PPy layer and large amount of electrolyte present within the pores of the composite ensure that the transport distance is very short for the charge compensating anions which enables very fast charge and discharge.52,53 Symmetric cells based on the use of this type of composites as the electrodes in an aqueous sodium chloride electrolyte can thus exhibit cell capacitances of ∼40–45 F g−1, as well as area based specific capacitances of ∼7 F cm−2 when operated at voltages up to 0.8 V.46,54 By using graphite foil current collectors it has also been possible to assemble energy storage devices in which all the functional materials are non-hazardous and of organic origin. The potential window of such symmetric PPy–cellulose cells is, however, limited to ∼1 V by the overoxidation of the positive electrode (which starts at ∼0.6 V vs. Ag/AgCl) and the loss of capacity of the negative electrode at ∼−0.45 V vs. Ag/AgCl.47 One possibility to increase the cell voltage and the energy density could be to use asymmetric cells containing a PPy–cellulose composite electrode and a carbon based electrode. In aqueous electrolytes, carbon-based electrode materials have been demonstrated to exhibit reversible electroactivity within a potential window larger than that defined by the oxidation and reduction of water.11,12 Recent scientific reports have also shown that carbon-based electrodes can be manufactured employing various treatments of PPy and polyaniline.18,55,56 The latter suggests that it should be possible to manufacture nanostructured carbon electrodes by heat treating PPy–cellulose composites, i.e. to design asymmetric supercapacitor cells containing a composite electrode and a carbon electrode made from the composite material. This would clearly provide new possibilities for the manufacturing of all-organic energy storage devices with higher output voltages and higher energy densities.
In the present work we describe the manufacturing of a carbon nanofibre (C-nf) material by straightforward heat treatment of the PPy–cellulose composite as well as the use of the obtained carbon electrode as the negative electrode in asymmetric cells in which a PPy–cellulose composite is employed as the positive electrode. The purpose of this is to simultaneously utilize the high areal capacitance of the PPy–cellulose structure22,46 and the larger potential window of the C-nf electrode to obtain higher cell voltages and energy densities. The composite and carbon electrodes were characterized using scanning electron microscopy, nitrogen adsorption isotherm analysis, cyclic voltammetry, transmission electron microscopy and X-ray photoelectron spectroscopy measurements. The supercapacitor performance of the asymmetric cells was also studied utilizing galvanostatic charge and discharge and electrochemical impedance spectroscopy experiments.
Experimental
PPy–cellulose composites
Cladophora sp. algae cellulose was extracted as previously described.57 Pyrrole (>97%), and iron(III) chloride hexahydrate (>99%) were purchased from Sigma-Aldrich while Tween-80 was purchased from VWR International and used as received. Deionised water was used throughout the synthesis. 300 mg of Cladophora cellulose was first dispersed in 60 mL water using a Sonics VibraCell sonicator (USA). A solution of 1.5 mL of pyrrole and a drop of Tween-80 in 50 mL 0.5 M hydrochloric acid was added to the cellulose dispersion and the mixture was stirred for 5 minutes. Polymerization was initiated by adding a solution of 12.86 g iron(III) chloride hexahydrate in 100 mL 0.5 M hydrochloric acid, after which the polymerization was left to proceed for 30 minutes. The resulting black slurry was transferred to a Büchner funnel and was washed with 5 L of 0.5 M hydrochloric acid followed by 1 L of 1 M sodium chloride solution. Finally, the water was drained from the funnel, and the resulting filtrate was pressed and dried in an heat press at 50 °C for 15 minutes, after which it was left to dry at room temperature to yield a black paper-like material.C-nfs derived from the PPy–cellulose composite
The C-nf material was manufactured from the PPy–cellulose composite as follows. The dried composite was first cut into square shaped pieces and put into a tube furnace under nitrogen gas flow. Subsequently the furnace was heated at a rate of 5 °C min−1 to 80 °C and kept at that temperature for one hour. The temperature was then increased at a rate of 5 °C min−1 to 700 °C and maintained at that temperature for another hour. Finally, the furnace was left to cool to room temperature, resulting in a black, glossy, hard and brittle 0.8 cm × 0.8 cm sized carbon nanofibre material.Primary material characterization
Scanning electron microscopy (SEM) images were obtained with a Leo Gemini 1550 FEG SEM instrument (UK). Specific surface areas were obtained with a Micromeritics ASAP 2020 instrument (USA) using a multipoint Brunauner–Emmett–Teller (BET) approach involving N2 gas adsorption isotherms analysis. Transmission electron microscopy (TEM) images were obtained with a MiniTEM instrument (Vironova AB, Sweden), which is a 25 keV table top TEM instrument. The samples were grounded, sonicated in ethanol, and one drop was then applied to the TEM grid (AGS147-H7H, Agar Scientific). High resolution X-ray photoelectron spectra (XPS) for C, N, and O were obtained with a Phi Quantum 2000 (Physical Electronics, U.S.) equipped with an Al Kα source (1486.6 eV, 45 W). The analyser was operated at 23.5 eV pass energy. Spectra were fitted using a Shirley background and Gaussian-Laurentian peaks using the Casa XPS Software version 2.3. The binding energies were shifted and referenced to the C1s peak at 285.0 eV.Cell assembly
Asymmetric supercapacitors with a PPy–cellulose positive electrode and a C-nf negative electrode were assembled and studied using different electrochemical measurements. The cells typically contained a 32.5 ± 2.5 mg, 0.8 cm × 0.8 cm sized piece of the C-nf material and a 32.5 ± 2.5 mg, 0.8 cm × 0.8 cm sized piece of the PPy–cellulose composite, separated by a 50 μm thick cellulose paper (TF40, Nippon Kodoshi, Japan) soaked in aqueous 2 M NaCl solution purged with nitrogen. The electrodes were contacted using rectangular 1.5 × 5 cm2 graphite foil current collectors with a thickness of 0.015 cm (Sigraflex F01513Z), and the cells were hermetically sealed by heat pressing with the current collectors sticking out of the cell. One cell was also assembled with an additional Ag/AgCl wire, serving as an internal reference electrode during the recording of the changes in the individual potentials of the electrodes. A schematic of the cell is displayed in Fig. 1.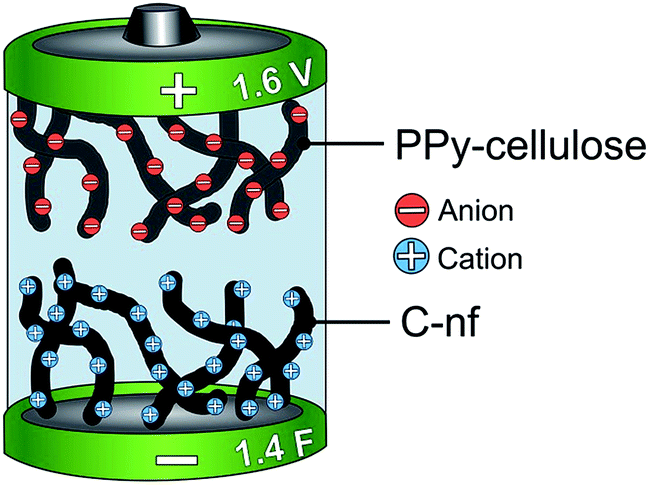 | ||
| Fig. 1 A schematic representation of the asymmetric cell in which a PPy–cellulose composite is utilized as the positive electrode while a C-nf is employed as the negative electrode in a 2 M NaCl aqueous solution. The obtained cell capacitance and maximum cell voltage were typically ∼1.4 F and 1.6 V, respectively. | ||
Electrochemical characterization
Cyclic voltammograms were recorded for the two electrode materials using a three-electrode setup including an Ag/AgCl 3 M NaCl reference electrode and a platinum wire counter electrode. The PPy–cellulose or C-nf samples were mounted on a platinum wire and employed as the working electrode. All measurements were performed in aqueous 2 M NaCl previously purged with nitrogen at a scan rate of 1 mV s−1. Blank voltammograms were also recorded with the platinum wire as the working electrode, as well as with a graphite foil as the working electrode.Galvanostatic charge and discharge experiments in the two-electrode asymmetric cell configuration were carried out using an Electrochemie Autolab PGSTAT302N potentiostat (The Netherlands) while electrochemical impedance spectroscopy (EIS) measurements were conducted with a CH Instruments 660D potentiostat (USA). The galvanostatic charge and discharge experiments in which the potentials of both the positive and negative electrodes were measured were conducted with a BioLogic VMP2 potentiostat (France).
In the EIS measurements an asymmetric cell was compressed between two plastic plates using a paper clip and tested at an applied dc potential of 0 V. The applied ac potential had an amplitude of 5 mV and a frequency between 82.5 kHz and 3 mHz. The galvanostatic charge and discharge measurements, which were performed after the ac impedance measurements, were conducted at a range of current densities between 0 and 1.6 V. Another cell was also compressed in a similar manner and galvanostatically charged and discharged between 0 and 1.6 V during 1000 cycles at a current density of 20 mA cm−2. The cell assembled with an additional Ag/AgCl wire as an internal reference electrode was galvanostatically charged and discharged between 0 and 1.6 V for two full cycles at a current density of 16 mA cm−2 while simultaneously the potential of each electrode with respect to the Ag/AgCl wire was recorded.
Results and discussions
As seen in Fig. 2a, the PPy–cellulose composite exhibited a porous nanofibrillar structure in excellent agreement with our previous findings.52 Interestingly the corresponding C-nf material, synthesized for the first time in the present work by heat treatment of the PPy–cellulose sample, exhibited a very similar porous “spaghetti-like” nanofibre structure, see Fig. 2b. From the SEM images in panels a and b, as well as from the higher magnification images provided in ESI Fig. S1 and S2,† it is in fact very difficult to distinguish between the PPy–cellulose and the C-nf samples.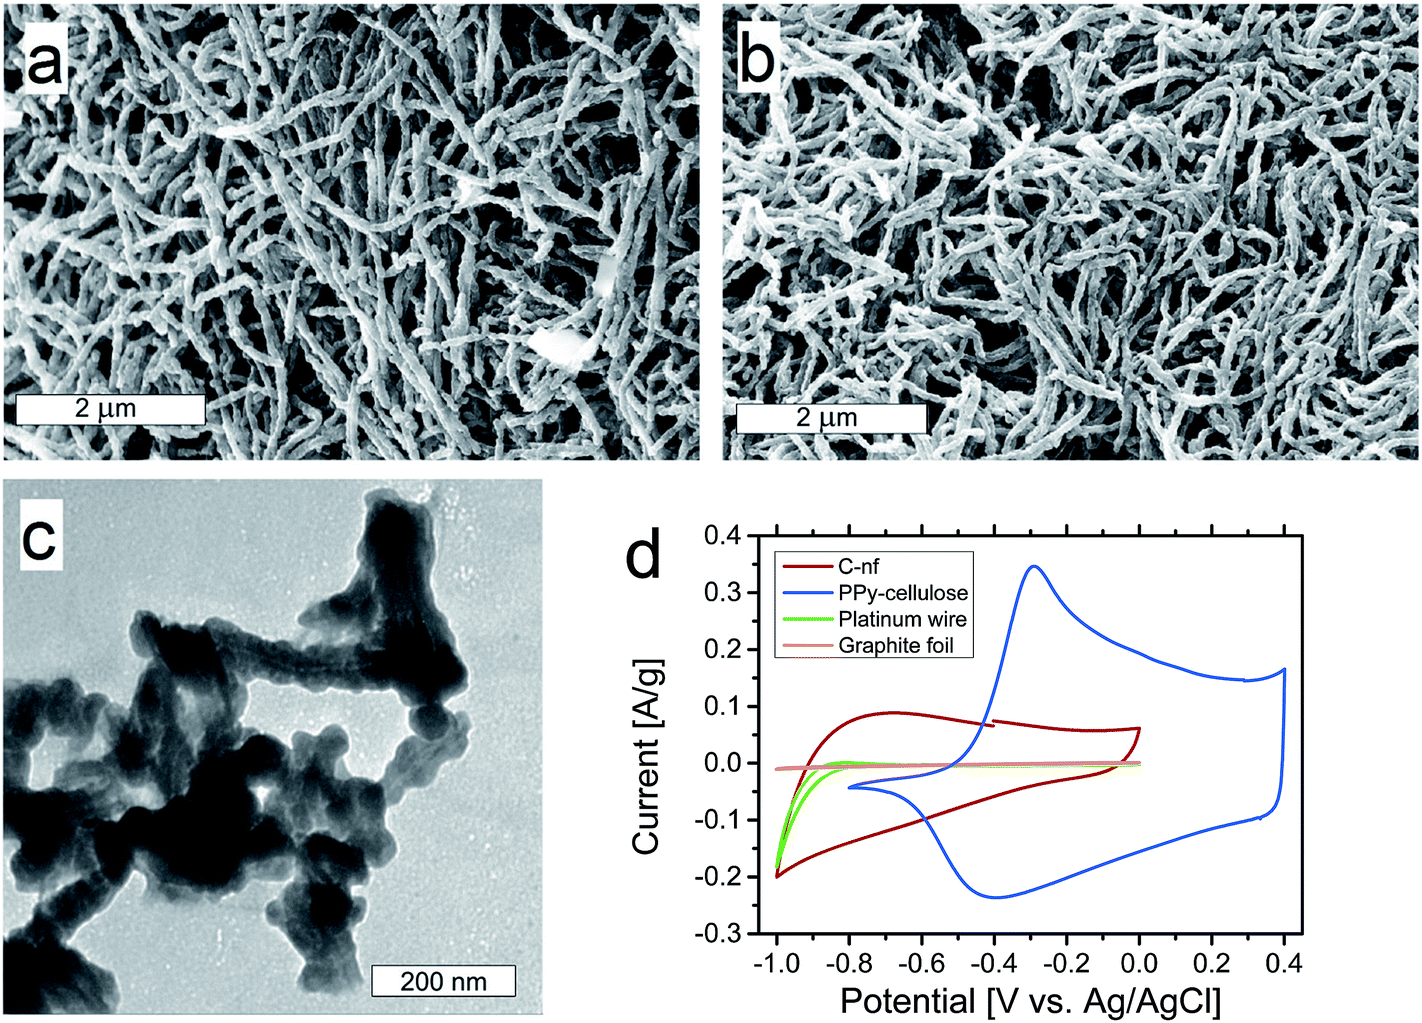 | ||
Fig. 2 SEM images obtained at 50![[thin space (1/6-em)]](https://www.rsc.org/images/entities/char_2009.gif) 000× magnification for a pristine PPy–cellulose sample (a), and the corresponding C-nf (b) sample. A TEM image of the C-nf sample (c). Cyclic voltammograms obtained at a scan rate of 1 mV s−1 in 2 M NaCl with PPy–cellulose and C-nf as the working electrodes as well as background voltammograms recorded for a Pt-wire and graphite foil (d). 000× magnification for a pristine PPy–cellulose sample (a), and the corresponding C-nf (b) sample. A TEM image of the C-nf sample (c). Cyclic voltammograms obtained at a scan rate of 1 mV s−1 in 2 M NaCl with PPy–cellulose and C-nf as the working electrodes as well as background voltammograms recorded for a Pt-wire and graphite foil (d). | ||
A TEM image of some C-nfs is displayed in Fig. 2c. In this image, a slightly lighter shadow in the middle of the fibres can be seen. This can either be due to traces of Cladophora cellulose still present within the fibres or due to the fact that the carbon density is different inside the fibres where the Cladophora cellulose, and not PPy, was the starting material. Even at the higher resolution provided by TEM the similarity between the C-nfs and the PPy–cellulose composite52 is striking. The BET surface area of the C-nf material was, however, found to be slightly larger (i.e. 100 m2 g−1) than the 75 m2 g−1 found for the PPy–cellulose composite.
Fig. 2d shows three-electrode cyclic voltammograms recorded at a scan rate of 1 mV s−1 in 2 M NaCl for the C-nf, PPy–cellulose as well as a platinum wire and a graphite foil. Here, it is observed that the electrochemical performance of the C-nf was very different from that for the PPy–cellulose composite. From the voltammograms it is immediately clear that the (redox) capacity of the PPy–cellulose electrode was significantly higher than that of the C-nf electrode. It should, however, be noted that the oxidative (redox) capacity of the PPy–cellulose composite was very small for potentials lower than about −0.5 V vs. Ag/AgCl whereas the C-nf material remained electroactive at potentials as low as −1 V vs. Ag/AgCl. At potentials more negative than −0.8 V vs. Ag/AgCl, the platinum wire contacting the sample also provided substantial background current due to water reduction. The platinum wire was, however, only used as a current collector in the three-electrode cyclic voltammetry experiments, and not in the asymmetric cells, where graphite foils were employed. As is also seen in Fig. 2d, the current contribution from the graphite foils was very small and can therefore be neglected. The voltammetric results consequently indicate that it should be possible to increase the cell voltage window of PPy–cellulose based supercapacitors by replacing one of the composite electrodes with a C-nf electrode.
To get a better understanding of the chemical structure of the as synthesised C-nf material and the pristine PPy–cellulose composite these were studied using XPS as is seen in Fig. 3. Prior to the experiments the samples had undergone drying in air but no sputtering of the samples was employed before the spectra were recorded. The contributions to the intensity signal for the C1s spectra can be assigned to carbon within aromatic rings not containing any nitrogen (see the peak at 284.5 eV), CN groups (C sp2 linked to N, 285.9 eV), and C![[double bond, length as m-dash]](https://www.rsc.org/images/entities/char_e001.gif) O (carbon doubly bound to oxygen in ketone and quinine groups, 287.6 eV).58–60 For the PPy–cellulose sample, the carbon spectrum was dominated by the CN peak, originating from the pyrrole-structure, in addition to some contribution from carbon doubly bound to oxygen. In Fig. 3d a clear peak due to carbon linked to nitrogen was also present, possibly due to some remaining PPy in the material but more likely caused by carbon substituted by nitrogen in aromatic graphitic structures since no response from PPy was observed in the electrochemical measurements on the C-nf material. As expected the contribution due to carbon present in nitrogen free rings was significantly higher for the C-nf sample (Fig. 3d) than for the PPy–cellulose composite (Fig. 3a).
O (carbon doubly bound to oxygen in ketone and quinine groups, 287.6 eV).58–60 For the PPy–cellulose sample, the carbon spectrum was dominated by the CN peak, originating from the pyrrole-structure, in addition to some contribution from carbon doubly bound to oxygen. In Fig. 3d a clear peak due to carbon linked to nitrogen was also present, possibly due to some remaining PPy in the material but more likely caused by carbon substituted by nitrogen in aromatic graphitic structures since no response from PPy was observed in the electrochemical measurements on the C-nf material. As expected the contribution due to carbon present in nitrogen free rings was significantly higher for the C-nf sample (Fig. 3d) than for the PPy–cellulose composite (Fig. 3a).
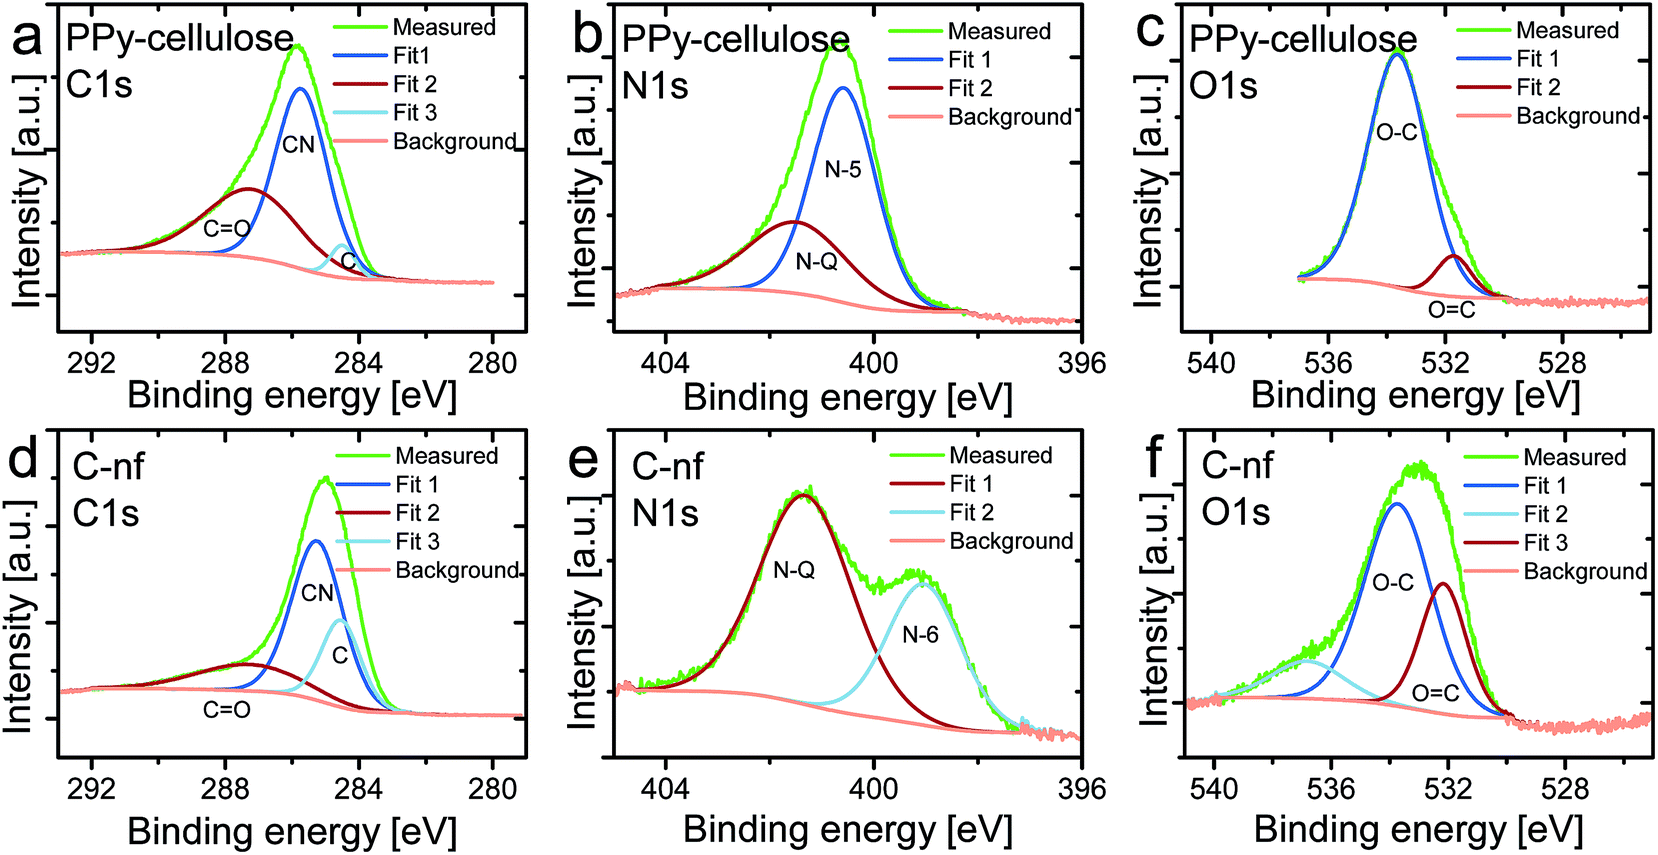 | ||
| Fig. 3 X-ray photoelectron C1s (a and d), N1s (b and e), and O1s (c and f) spectra for the as-synthesized PPy–cellulose (a–c) and C-nf (d–f) material. The spectra were fitted using Shirley background and Gaussian-Laurentian peaks using the Casa XPS software. | ||
For N-containing carbon materials the N1s spectrum can be explained by the superimposition of peaks that can be assigned to N-6 (pyridinic N, 398.7 eV), N-5 (pyrrolic N and pyridone N in association with an oxygen functionality, 400.3 eV), and N-Q (quaternary N,N substituted with C in the aromatic graphene structure, 401.4 eV).56,61,62 As expected, the PPy–cellulose exhibited a dominating peak due to pyrrolic nitrogen (see Fig. 3b) in addition to some contribution from quaternary nitrogen. For the C-nf sample, the N1s spectrum was substantially different (see Fig. 3e), as the nitrogen spectrum did not feature any peak due to pyrrolic nitrogen, an increased contribution from quaternary nitrogen and the presence of a peak which can be ascribed to pyridinic nitrogen. This clearly demonstrates that the PPy–cellulose composite underwent significant changes upon the heat treatment.
In the O1s spectra (see Fig. 3c and f) contributions due to OC (O in the carbonyl group, 531.6 eV), and O–C (various other O and C groups, 533.4 eV)59 can be found. For the PPy–cellulose composite the peak ascribed to singly bound oxygen dominated the spectrum whereas a relatively large peak due to carbonylic oxygen also was seen for the C-nf sample. The latter could stem from carbonylic surface groups present on the carbon as a result of its exposure to oxygen subsequent to the synthesis.
Galvanostatic charge and discharge curves for an asymmetric cell containing a PPy–cellulose positive electrode and a C-nf negative electrode for current densities between 8 and 156 mA cm−2 are presented in Fig. 4a and b. The shapes of the charge and discharge curves obtained at the lowest current densities are linear upon charging to and discharging from 1.6 V, in contrast to the charge and discharge curves for symmetrical PPy–cellulose based supercapacitors operated at cell voltages up to 1 (ref. 48) or 1.8 V (ref. 47) where the limiting capacity of the negative electrode resulted in charging curves with rapid increase in potential at high cell potentials. An increasing deviation from a linear behaviour of the charging curves is observed at high cell potentials when the current density was increased, Fig. 4b. For symmetric PPy–cellulose supercapacitors such nonlinear charging curves with a decreasing slope at high potentials typically indicate the presence of overoxidation of the positive electrode.54 For the asymmetric cell there is also possible that reduction of oxygen containing groups on the C-nf electrode causes this response.11–13,16,17
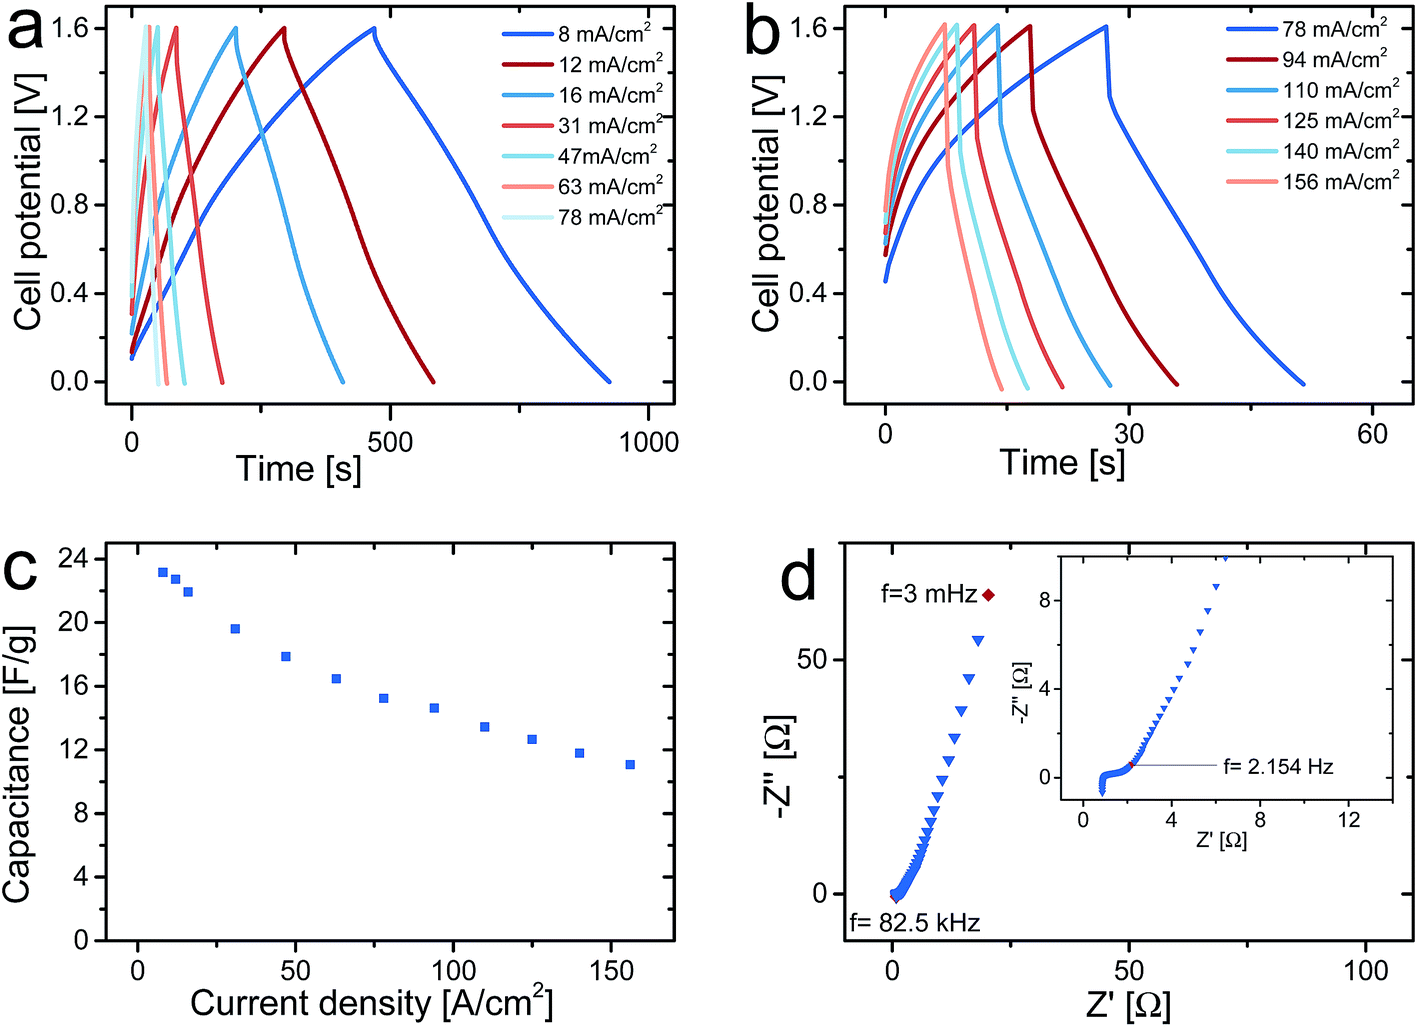 | ||
| Fig. 4 Galvanostatic charge and discharge curves for an asymmetric supercapacitor cell charged up to 1.6 V using current densities ranging from 8 to 78 mA cm−2 (a) and from 78 to 156 mA cm−2 (b). Gravimetric cell discharge capacitance as a function of the current density (c). Nyquist plot depicting the EIS response of the cell (d) with the inset showing a magnification of the response close to the intercept with the Z′-axis. | ||
A discharge cell capacitance of 23 F g−1 (with respect to the dry weight of both electrodes of the asymmetric cell) corresponding to an areal capacitance of 2.16 F cm−2 was obtained for a current density of 8 mA cm−2, Fig. 4c. This corresponds to and energy density of 29 J g−1 which should be compared to the 14 J g−1 for symmetric PPy–cellulose cells based on a cell capacitance of ∼45 F g−1 (ref. 46) and charging to 0.8 V.47 This demonstrates that the energy density can be increased by using an asymmetric cell despite the fact that the cell capacitance was about twice as high for the symmetric PPy–cellulose cell. As is seen from eqn (1), this overall increase in the energy density stems from the two-fold increase in the cell voltage while the lower cell capacitance of the asymmetric cell can be explained based on eqn (2) given the lower redox capacity (and hence lower specific capacitance) for the C-nf electrode than for the PPy–cellulose electrode (see Fig. 2).
As described in the experimental section, the asymmetric cell tested in Fig. 4 contained one C-nf electrode and one PPy–cellulose electrode both with an area of 0.8 × 0.8 cm2 and both weighing ∼30 mg. This means that the cell exhibited a capacitance of ∼1.4 F for a current of 5 mA. From the magnitude of the iR-drops seen in Fig. 4a and b a cell resistance of 3.2 Ω can be obtained. It should also be mentioned that the current densities between 8 and 156 mA cm−2 used in the present study correspond to applied currents from 5 to 100 mA. Since a cell resistance of 3.2 Ω is relatively low for conducting polymer based supercapacitors of the present geometry, these results clearly demonstrate that comparisons of the performances of different devices must take into account the actual current employed in the experiments rather than the currents normalised with respect to the weight of the electrodes. As the electrode mass loadings are increased to increase the capacity of the device the iR drop of the device will naturally also increase. Very small iR drops for current densities of 100 A g−1 can thus only be obtained for very small electrode mass loadings unless the cell resistance can be reduced by orders of magnitude compared to the values normally reported in the literature.
In Fig. 4c, which depicts the gravimetric capacitance obtained from the discharge curves in panels a and b as a function of the current density, it can be noted that the cell capacitance decreased with increasing current density but that a cell capacitance of 11 F g−1 (or 1.03 F cm−2) still could be obtained for a current density of 156 mA cm−2. As is seen in Fig. 4b, the latter current density corresponded to a charge and discharge time of about 7 seconds for the asymmetric supercapacitor. This indicates that the present type of asymmetric supercapacitor behaves analogously to the previously described symmetric PPy–cellulose composite based cells.48
As is evident from the Nyquist plot in Fig. 4d, the asymmetric cells were also studied using ac impedance spectroscopy. In agreement with previous results for symmetric PPy–cellulose cells, the plot indicates the presence of a diffusion limited region at intermediate frequencies followed by a capacitive behaviour at frequencies below ∼2 Hz. Since the high frequency semi-circle only extends over a region corresponding to ∼0.5 Ω (see inset in Fig. 4d) it can be concluded that redox reactions were not rate limiting in the time window of importance to the charge and discharge measurements, in agreement with previous findings for symmetric cells.46 The high frequency intercept with the real axis in Fig. 4d, which can be ascribed to the resistance of the current collector, electrolyte and electrode material at 0 V cell potential, was found to be 0.93 Ω which actually is lower than the corresponding values previously reported for symmetric PPy–cellulose cells.46,54 This lower high frequency resistance obtained here can most likely be explained by the previously suggested46 improvement in the geometry of the graphite current collector. In that previous work, it was demonstrated that the current collector resistance was one of the main contributions to the cell resistance. The difference between the cell resistance (3.2 Ω) obtained from the cycling curves at 1.6 V and the high frequency resistance (0.9 Ω) at 0 V cell potential can be ascribed to frequency dependent resistances of redox processes at the electrodes and by the diffusion layer that adds to the electrolyte resistance as the cell is charged to 1.6 V.
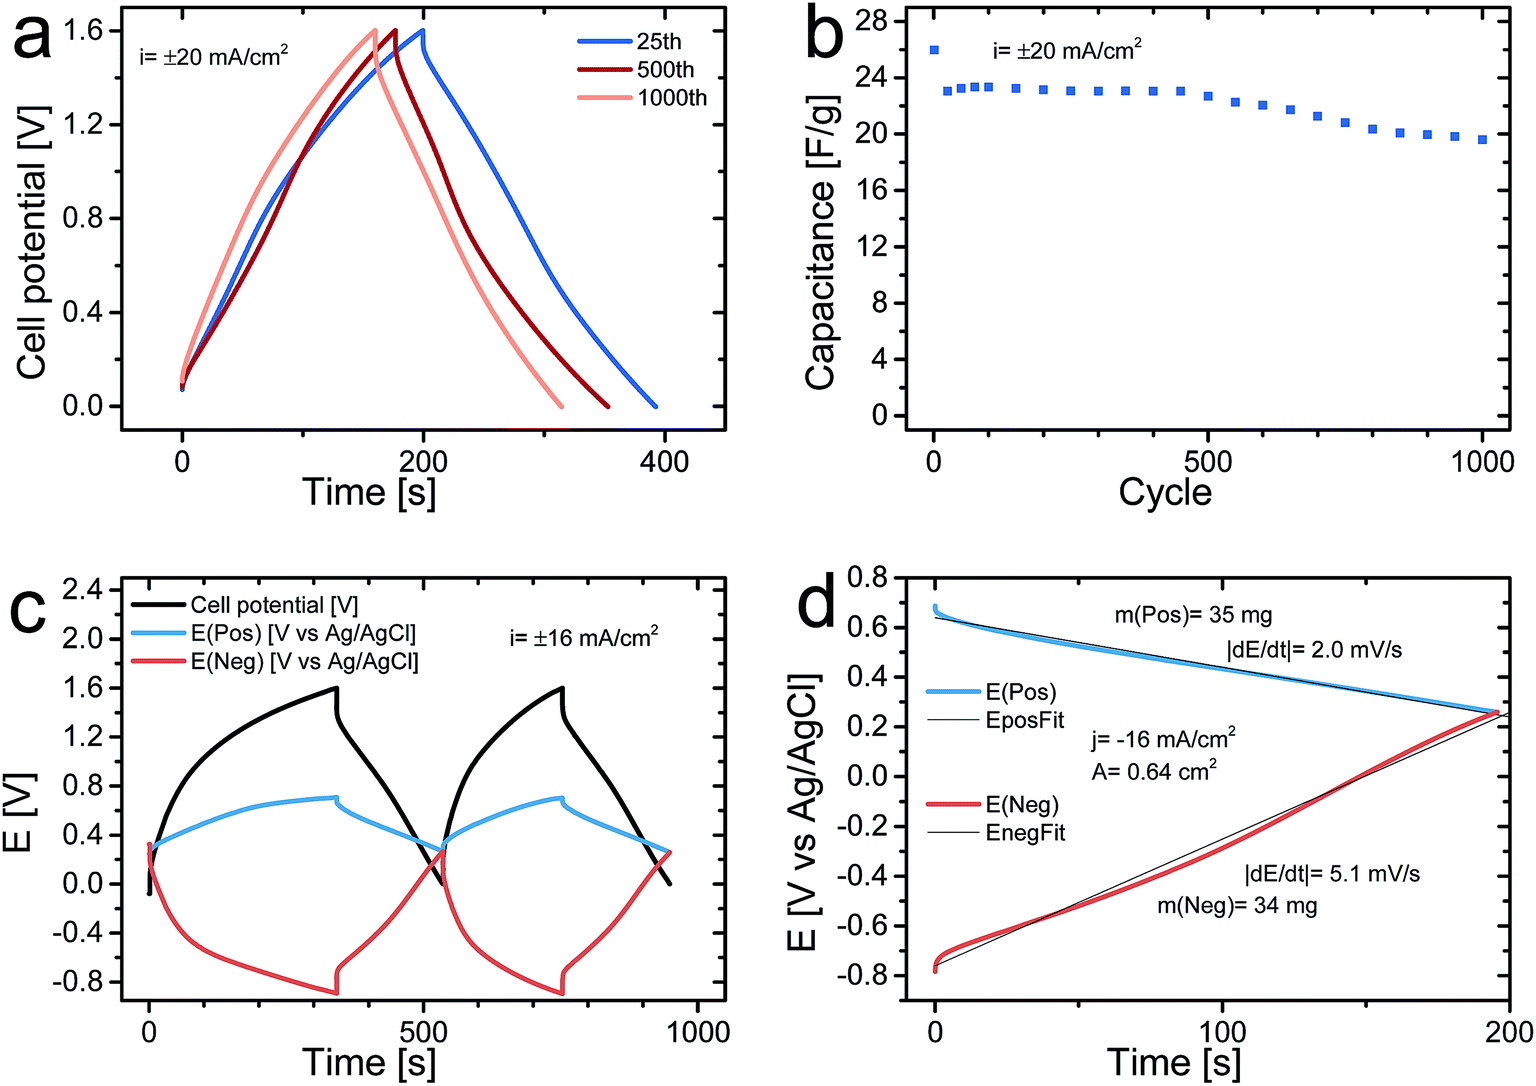
Fig. 5a depicts the charge and discharge curve of the 25th, 500th, and 1000th cycles for an asymmetric cell obtained at a current density of 20 mA cm−2 whereas Fig. 5b presents the dependence of the discharge cell capacitance (note that only every 25th cycle is shown) as a function of the cycle number during 1000 cycles. It can be seen that there was an initial capacitance drop from 26 F g−1 to 23 F g−1 during the first 25 cycles after which the capacitance only decreases slightly from 23 F g−1 to 20 F g−1, during the subsequent 975 cycles. The initial capacitance drop was most likely partly due to overoxidation of the PPy in the positive electrode on the initial cycles in accordance with previous findings54 and partly due to the presence of irreversible reactions on the pristine C-nf electrode. These capacitances translate into a starting energy density of 33 J g−1 and a final value of 26 J g−1 (with respect to the dry weight of both electrodes), which should be compared to the 14 J g−1 obtainable for a symmetric PPy–cellulose cell (with a cell capacitance of ∼45 F g−1 (ref. 46) and a cell voltage of 0.8 V (ref. 47)).
 | ||
| Fig. 5 Galvanostatic charge and discharge curve for an asymmetric cell exhibiting the 25th, 500th, and 1000th cycles for a current density of 20 mA cm−2 (a). Gravimetric discharge cell capacity as a function of the cycle number (note that only the results for every 25th cycle are shown) for a current density of 20 mA cm−2 (b). Galvanostatic charge and discharge curves for the first two cycles for an asymmetric cell containing an internal Ag/AgCl wire reference electrode for current density of 16 mA cm−2; where the black curve represents the cell voltage while the blue and red curves correspond to the potential of the positive and negative electrode vs. Ag/AgCl, respectively (c). Enlargement of the second cycle discharge curves for the positive PPy–cellulose (blue curve) and negative C-nf electrode (red curve) together with and linear fits to the data points (d). | ||
Fig. 5c shows the results of a galvanostatically charge and discharge experiment, carried out with a current density of 16 mA cm−2 in which the potentials of the positive and negative electrodes were recorded vs. an internal Ag/AgCl reference electrode. As is seen in the figure, both electrodes had a potential of 0.3 V vs. Ag/AgCl at the beginning of the experiment when the cell voltage was set to zero. During the first two cycles the potential of the (positive) PPy–cellulose electrode stayed between 0.3 V and 0.7 V vs. Ag/AgCl whereas the potential of the (negative) C-nf electrode varied between 0.3 V and −0.9 V vs. Ag/AgCl as the cell was cycled between a cell voltage of 0 V and 1.6 V. The fact that the potential of the PPy–cellulose electrode reached 0.7 V vs. Ag/AgCl supports the hypothesis that irreversible overoxidation of PPy63 contributed significantly to the capacitance drop during the initial cycles. The large potential change seen for the C-nf electrode is in good agreement with the lower capacitance found for the C-nf electrode when compared to the PPy–cellulose electrode but the different shapes of the charge and discharge curves for the C-nf electrode also indicate the presence of an irreversible reduction. From the magnitude of the iR-drop observed seen in Fig. 5c a cell resistance of 5.9 Ω is obtained, slightly higher than the ∼3.2 Ω obtained from the iR drops in Fig. 4a, b and 5a. This observed difference in cell resistance is a consequence of the different pressures applied to the cells. As detailed in the above cell assembly and electrochemical characterization sections the cells in Fig. 4a, b and 5a were pressed between two plastic plates using a paper clip, while the three electrode cell presented in Fig. 5c was not subjected to pressure. As previously shown;46 when cells of this type are pressurized the charge transfer resistance between the current collectors and the electrode material are reduced effectively and hence the cell resistance is lower for the pressurized cells.
In Fig. 5d, it can also be seen that practically linear discharge curves were obtained for both the PPy–cellulose and the C-nf electrodes. The presence of an irreversible reaction during charging is further supported by a comparison of the charge and discharge capacities for the C-nf electrode on the first two cycles since the ratio between the first reduction and oxidation charges was 1.7 on the first cycle and about 1.2 on the second cycle. Although one obvious cause of this effect is the reduction of residual oxygen present in the cell, the reduction of oxygen containing functional groups on the surface of the C-nf cannot be excluded. As seen in Fig. 3f, CO functional groups were indeed present on the pristine C-nf electrode and it is well-known11–13,16,17 that such functional groups can undergo reduction in the potential window of interest here.
The specific capacitances of the PPy–cellulose and C-nf electrodes, calculated from the slopes of the discharge curves in Fig. 5d, were found to be 146 and 59 F g−1, respectively, which based on eqn (2) gives a cell capacitance of 21 F g−1, in good agreement with that calculated from the data in Fig. 4. The corresponding energy density for this cell, hence, was 27 J g−1, i.e. almost twice the value obtained for a symmetric PPy–cellulose device46,47 and more than 40% larger than the value (i.e. 19 J g−1) expected based on eqn (1) and (2) for a symmetric cell containing two C-nf electrodes and an aqueous electrolyte. The results in Fig. 5, thus, clearly demonstrate that the capacitance of the asymmetric cell was limited by the capacitance of the C-nf electrode but also that the use of the latter electrode enabled the attainment of a cell voltage of 1.6 V and therefore a higher energy density. Since the capacity of the C-nf electrode was smaller than that of the PPy–cellulose electrode it is likewise reasonable to conclude that the initial capacitance drop was due to the reduction of oxygen dissolved in the electrolyte and oxygen containing functional groups on the C-nf electrode rather than the overoxidation of the (non-limiting) PPy–cellulose electrode.
Conclusions
It has been demonstrated that all-organic material based asymmetric energy storage devices containing aqueous electrolytes can be manufactured based on polypyrrole coated Cladophora sp. algae nanocellulose composites (PPy–cellulose) and highly porous carbon nanofibers based materials (C-nf) straightforwardly obtained from the PPy–cellulose composite itself. The latter material, which was obtained by heat treating the PPy–cellulose under nitrogen gas flow, maintained the porous structure characteristic for the PPy–cellulose composites. The electrochemical performances of the PPy–cellulose and C-nf materials have been shown to differ significantly and the beneficial combination of these materials in asymmetric supercapacitor cells has been demonstrated. A cell capacitance of 25 F g−1 was thus obtained for such an asymmetric cell operating at voltages of 1.6 V which corresponds to a gravimetric energy density of 33 J g−1 for the cell. This value is significantly higher that the energy density of 14 J g−1 attainable for symmetric PPy–cellulose supercapacitor cells as well as the value expected for a symmetric cell containing two C-nf electrodes. The specific gravimetric capacitances for the C-nf and PPy–cellulose electrode materials were found to be 59 and 146 F g−1, respectively clearly demonstrating the larger capacitance associated with the surface confined redox reactions on the PPy–cellulose electrode. A cell capacitance of 11 F g−1 was likewise demonstrated for the asymmetric cell at a current density of 156 mA cm−2. The supercapacitor was also able to undergo galvanostatic charge and discharge for 1000 cycles at a current density of 20 mA cm−2 within a potential window of 1.6 V, with acceptable stability in an aqueous electrolyte (i.e. 2 M NaCl). The present study thus represents a major step forward towards the realisation of all-organic, renewable materials-based, energy storage devices with commercially viable mass loadings, capacitances and hence energy densities.Acknowledgements
The authors would like to gratefully acknowledge the financial support of this work given by The Swedish Foundation for Strategic Research (SSF) (grant RMA-110012), The Swedish Science Council (VR), The Bo Rydin Foundation, The Swedish Energy Agency and The Carl Trygger Foundation.References
- M. Armand and J. M. Tarascon, Nature, 2008, 451, 652–657 CrossRef CAS PubMed.
- J. R. Miller and A. F. Burke, Electrochem. Soc. Interface, 2008, 17, 53 CAS.
- J. R. Miller and P. Simon, Sci. Mag., 2008, 321, 651–652 CAS.
- O. Inganäs and S. Admassie, Adv. Mater., 2014, 26, 830–848 CrossRef PubMed.
- B. Dunn, H. Kamath and J.-M. Tarascon, Science, 2011, 334, 928–935 CrossRef CAS PubMed.
- R. Kötz and M. Carlen, Electrochim. Acta, 2000, 45, 2483–2498 CrossRef.
- A. Pandolfo and A. Hollenkamp, J. Power Sources, 2006, 157, 11–27 CrossRef CAS PubMed.
- D. S. Su and R. Schlögl, ChemSusChem, 2010, 3, 136–168 CrossRef CAS PubMed.
- B. Conway, V. Birss and J. Wojtowicz, J. Power Sources, 1997, 66, 1–14 CrossRef CAS.
- C. Peng, S. Zhang, D. Jewell and G. Z. Chen, Prog. Nat. Sci., 2008, 18, 777–788 CrossRef CAS PubMed.
- B. E. Conway, Electrochemical Supercapacitors: Scientific Fundamentals and Technological Applications, Springer, 1999 Search PubMed.
- E. Ra, E. Raymundo-Piñero, Y. Lee and F. Béguin, Carbon, 2009, 47, 2984–2992 CrossRef CAS PubMed.
- C.-T. Hsieh and H. Teng, Carbon, 2002, 40, 667–674 CrossRef CAS.
- L. Zhao, Y. S. Hu, H. Li, Z. Wang and L. Chen, Adv. Mater., 2011, 23, 1385–1388 CrossRef CAS PubMed.
- J. Wei, D. Zhou, Z. Sun, Y. Deng, Y. Xia and D. Zhao, Adv. Funct. Mater., 2013, 23, 2322–2328 CrossRef CAS.
- D. Hulicova-Jurcakova, M. Seredych, G. Q. Lu and T. J. Bandosz, Adv. Funct. Mater., 2009, 19, 438–447 CrossRef CAS.
- E. Raymundo-Piñero, F. Leroux and F. Béguin, Adv. Mater., 2006, 18, 1877–1882 CrossRef.
- L. F. Chen, Z. H. Huang, H. W. Liang, Q. F. Guan and S. H. Yu, Adv. Mater., 2013, 25, 4746–4752 CrossRef CAS PubMed.
- J. Yan, Z. Fan, W. Sun, G. Ning, T. Wei, Q. Zhang, R. Zhang, L. Zhi and F. Wei, Adv. Funct. Mater., 2012, 22, 2632–2641 CrossRef CAS.
- Z. Fan, J. Yan, T. Wei, L. Zhi, G. Ning, T. Li and F. Wei, Adv. Funct. Mater., 2011, 21, 2366–2375 CrossRef CAS.
- V. Khomenko, E. Raymundo-Pinero, E. Frackowiak and F. Beguin, Appl. Phys. A, 2006, 82, 567–573 CrossRef CAS PubMed.
- P. Simon and Y. Gogotsi, Nat. Mater., 2008, 7, 845–854 CrossRef CAS PubMed.
- N.-L. Wu, Mater. Chem. Phys., 2002, 75, 6–11 CrossRef CAS.
- A. Razaq, L. Nyholm, M. Sjödin, M. Strømme and A. Mihranyan, Adv. Energy Mater., 2012, 2, 445–454 CrossRef CAS.
- Z. Wang, P. Tammela, P. Zhang, M. Strømme and L. Nyholm, J. Mater. Chem. A, 2014, 2, 16761–16769 CAS.
- Z. Wang, P. Tammela, P. Zhang, J. Huo, F. Ericson, M. Strømme and L. Nyholm, Nanoscale, 2014, 6, 13068–13075 RSC.
- Z. Wang, P. Tammela, P. Zhang, M. Strømme and L. Nyholm, J. Mater. Chem. A, 2014, 2, 7711–7716 CAS.
- C. Karlsson, H. Huang, M. Strømme, A. Gogoll and M. Sjödin, J. Phys. Chem. C, 2014, 118, 23499–23508 CAS.
- C. Karlsson, H. Huang, M. Strømme, A. Gogoll and M. Sjödin, J. Phys. Chem. C, 2013, 117, 23558–23567 CAS.
- Z.-S. Wu, W. Ren, D.-W. Wang, F. Li, B. Liu and H.-M. Cheng, ACS Nano, 2010, 4, 5835–5842 CrossRef CAS PubMed.
- L.-Z. Fan and J. Maier, Electrochem. Commun., 2006, 8, 937–940 CrossRef CAS PubMed.
- L. Nyholm, G. Nyström, A. Mihranyan and M. Strømme, Adv. Mater., 2011, 23, 3751–3769 CAS.
- M. Strømme, G. Frenning, A. Razaq, K. Gelin, L. Nyholm and A. Mihranyan, J. Phys. Chem. B, 2009, 113, 4582–4589 CrossRef PubMed.
- P. Novák, K. Müller, K. Santhanam and O. Haas, Chem. Rev., 1997, 97, 207–282 CrossRef PubMed.
- G. Milczarek and O. Inganäs, Science, 2012, 335, 1468–1471 CrossRef CAS PubMed.
- E. Frackowiak, V. Khomenko, K. Jurewicz, K. Lota and F. Beguin, J. Power Sources, 2006, 153, 413–418 CrossRef CAS PubMed.
- L. Yuan, B. Yao, B. Hu, K. Huo, W. Chen and J. Zhou, Energy Environ. Sci., 2013, 6, 470–476 CAS.
- H. E. Katz, P. C. Searson and T. O. Poehler, J. Mater. Res., 2010, 25, 1561–1574 CrossRef CAS.
- V. Khomenko, E. Frackowiak and F. Beguin, Electrochim. Acta, 2005, 50, 2499–2506 CrossRef CAS PubMed.
- C. Yang, L. Zang, J. Qiu, E. Sakai, X. Wu and Y. Iwase, RSC Adv., 2014, 4, 40345–40351 RSC.
- Y. Han and Y. Lu, Carbon, 2007, 45, 2394–2399 CrossRef CAS PubMed.
- S. Y. Liew, D. A. Walsh and W. Thielemans, RSC Adv., 2013, 3, 9158–9162 RSC.
- S. Lv, F. Fu, S. Wang, J. Huang and L. Hu, RSC Adv., 2015, 5, 2813–2818 RSC.
- H. Wang, L. Bian, P. Zhou, J. Tang and W. Tang, J. Mater. Chem. A, 2013, 1, 578–584 CAS.
- D. Muller, C. R. Rambo, L. M. Porto, W. H. Schreiner and G. M. Barra, Carbohydr. Polym., 2013, 94, 655–662 CrossRef CAS PubMed.
- P. Tammela, H. Olsson, M. Strømme and L. Nyholm, J. Power Sources, 2014, 272, 468–475 CrossRef CAS PubMed.
- H. Olsson, G. Nyström, M. Strømme, M. Sjödin and L. Nyholm, Electrochem. Commun., 2011, 13, 869–871 CrossRef CAS PubMed.
- G. Nyström, A. Razaq, M. Strømme, L. Nyholm and A. Mihranyan, Nano Lett., 2009, 9, 3635–3639 CrossRef PubMed.
- H. Olsson, D.O. Carlsson, G. Nyström, M. Sjödin, L. Nyholm and M. Strømme, J. Mater. Sci., 2012, 47, 5317–5325 CrossRef CAS.
- H. Olsson, M. Sjödin, E. J. Berg, M. Strømme and L. Nyholm, Green, 2014, 4, 27–39 CrossRef CAS PubMed.
- A. Razaq, A. Mihranyan, K. Welch, L. Nyholm and M. Strømme, J. Phys. Chem. B, 2008, 113, 426–433 CrossRef PubMed.
- A. Mihranyan, L. Nyholm, A. E. Garcia-Bennett and M. Strømme, J. Phys. Chem. B, 2008, 112, 12249–12255 CrossRef CAS PubMed.
- J. Heinze, B. A. Frontana-Uribe and S. Ludwigs, Chem. Rev., 2010, 110, 4724–4771 CrossRef CAS PubMed.
- G. Nyström, M. Strømme, M. Sjödin and L. Nyholm, Electrochim. Acta, 2012, 70, 91–97 CrossRef PubMed.
- Z. Wang, L. Qie, L. Yuan, W. Zhang, X. Hu and Y. Huang, Carbon, 2013, 55, 328–334 CrossRef CAS PubMed.
- Z. Wang, X. Xiong, L. Qie and Y. Huang, Electrochim. Acta, 2013, 106, 320–326 CrossRef CAS PubMed.
- A. Mihranyan, A. P. Llagostera, R. Karmhag, M. Strømme and R. Ek, Int. J. Pharm., 2004, 269, 433–442 CrossRef CAS PubMed.
- J. F. Moulder and J. Chastain, Handbook of X-ray Photoelectron Spectroscopy: A Reference Book of Standard Spectra for Identification and Interpretation of XPS Data, Physical Electronics Division, Perkin-Elmer Corporation, 1992 Search PubMed.
- S. Kundu, Y. Wang, W. Xia and M. Muhler, J. Phys. Chem. C, 2008, 112, 16869–16878 CAS.
- P. Burg, P. Fydrych, D. Cagniant, G. Nanse, J. Bimer and A. Jankowska, Carbon, 2002, 40, 1521–1531 CrossRef CAS.
- F. Su, C. K. Poh, J. S. Chen, G. Xu, D. Wang, Q. Li, J. Lin and X. W. Lou, Energy Environ. Sci., 2011, 4, 717–724 CAS.
- F. Kapteijn, J. Moulijn, S. Matzner and H.-P. Boehm, Carbon, 1999, 37, 1143–1150 CrossRef CAS.
- D. S. Park, Y. B. Shim and S. M. Park, J. Electrochem. Soc., 1993, 140, 609–614 CrossRef CAS PubMed.
Footnote |
| † Electronic supplementary information (ESI) available. See DOI: 10.1039/c4ra15894f |
| This journal is © The Royal Society of Chemistry 2015 |