
Electrospun activated carbon nanofibers for supercapacitor electrodes†
Mingjia Zhi*a,
Suhua Liua,
Zhanglian Hong*a and
Nianqiang Wub
aState Key Laboratory of Silicon Materials, Department of Materials Science & Engineering, Zhejiang University, Hangzhou 310027, China. E-mail: Mingjia_Zhi@zju.edu.cn; Hong_Zhanglian@zju.edu.cn
bDepartment of Mechanical and Aerospace Engineering, West Virginia University, Morgantown, WV 26506-6106, USA
First published on 29th August 2014
Abstract
Porous activated carbon nanofibers have been prepared by electrospinning a H3PO4-containing polyacrylonitrile precursor. A small amount of H3PO4 (<1 wt%) serves as the activation agent during carbonization of the nanofibers. The activated carbon nanofibers have a large surface area (∼709 m2 g−1) and high porosity (0.356 cm3 g−1). A high specific capacitance of 156 F g−1 (at 0.5 A g−1) is obtained at a 1![[thin space (1/6-em)]](https://www.rsc.org/images/entities/char_2009.gif) :10 mass ratio of H3PO4 to polyacrylonitrile. The energy density of the supercapacitor with the activated carbon nanofibers as the electrodes reaches 10.98 Wh kg−1 at a power density of 10 kW kg−1. This is ∼9 fold larger than that of carbon nanofibers without H3PO4 because the H3PO4-based activation process significantly increases both the micropore volume and the volume ratio of mesopores to micropores.
:10 mass ratio of H3PO4 to polyacrylonitrile. The energy density of the supercapacitor with the activated carbon nanofibers as the electrodes reaches 10.98 Wh kg−1 at a power density of 10 kW kg−1. This is ∼9 fold larger than that of carbon nanofibers without H3PO4 because the H3PO4-based activation process significantly increases both the micropore volume and the volume ratio of mesopores to micropores.
Introduction
Supercapacitors are finding increasing applications in energy storage systems due to their high power density, fast charge time as well as longer lifetime compared with batteries.1–5 Carbon is the dominant material in commercial supercapacitors, and is directly used as the active material in electrochemical double layer capacitors (EDLC) or as the supporting backbone in pseudo-capacitive electrodes.6–8 Among the different types of carbon, one-dimensional carbon materials such as carbon nanotubes and vapor-growth carbon fibers (VGCF) have been thoroughly studied for supercapacitor applications.5,9–12 Many efforts have been made to tailor the microstructure of carbon, such as the surface area, the pore structure and the electrical conductivity, to achieve both high energy density and power density.Recently, carbon nanofibers (CNFs) made from electrospun polyacrylonitrile (PAN) nanofibers have attracted much attention as supercapacitor electrodes due to their low cost and large-scale synthesis as well as their good mechanical properties. Such CNFs have been used as the supporting backbone for various pseudo-capacitive materials such as MnO2, NiO and PANI,13–18 leading to enhancement of the specific capacitance and the rate capability. On the other hand, CNFs have been directly used as EDLC electrodes. The activation process of CNFs is the key to performance of EDLC-based supercapacitors. To date, H2O vapor and CO2 have been used for physical activation.19,20 An alternative strategy is to incorporate the activation agent with the PAN precursor, and activate the fiber during carbonization. Kim et al. have fabricated porous CNF with a surface area up to 550 m2 g−1 by carbonizing mixed ZnCl2/PAN nanofibers.21 Similarly, Tran et al. have used Nafion as the sacrificial agent in a Nafion/PAN blend fiber. The activated CNFs exhibited a specific surface area of 1600 m2 g−1 with a high specific capacitance of 210 F g−1.22 However, the reported ratios of the activation agents to PAN are usually high (1:2–4:1) and the sacrificial activation agents are very expensive.
In the present study, inexpensive, abundant H3PO4 is chosen as the activation agent. A mixture of H3PO4 and PAN is used as the electrospinning precursor to fabricate the porous carbon nanofibers. The introduction of a small amount (less than 1:10 to PAN) of H3PO4 can effectively activate the nanofibers during the carbonization process, and generate the desired porous structure for supercapacitor applications. Both the micropore volume and the mesopore/micropore volume ratio can be tuned by varying the H3PO4 concentration, which modulates the rate capability of the supercapacitor electrode.
Experimental
The electrospinning precursor was prepared by dissolving 10 wt% of polyacrylonitrile (PAN) in dimethylformamide (DMF) solvent (1 g PAN and 10 g DMF). Different amounts of H3PO4 powder were added into the precursor (accounting for 0.2%, 0.5% and 1% of the total electrospinning precursor). Electrospinning was conducted by applying a 15 kV voltage to the precursor. The distance from the precursor droplet to the fiber collector was 15 cm and the injection speed of the precursor was 0.5 ml h−1. The as-spun fibers were then stabilized at 280 °C in air for 1 h and carbonized in N2 at 800 °C for 3 h. Afterwards the CNFs were immersed in deionized (DI) water at 70 °C for 12 h to remove residual phosphorous impurities and then dried in an oven at 100 °C for 12 h. The samples containing 0.2%, 0.5% and 1% H3PO4 were labelled as P-CNF-2, P-CNF-5 and P-CNF-10, respectively. The CNF without H3PO4 was also prepared by carbonization of the PAN nanofibers under the same conditions.The morphology of the CNF electrodes was observed by scanning electron microscopy (SEM, Hitachi S-4800). The chemical structures were examined by X-ray photoelectron spectroscopy (XPS, PHI Versa Probe 5000). The surface areas and the pore structures were measured using a Micrometric ASAP 2020 analyzer. The pore size distributions were calculated using the H-K method.
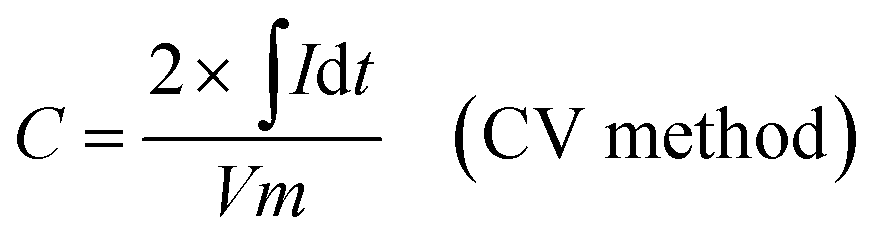
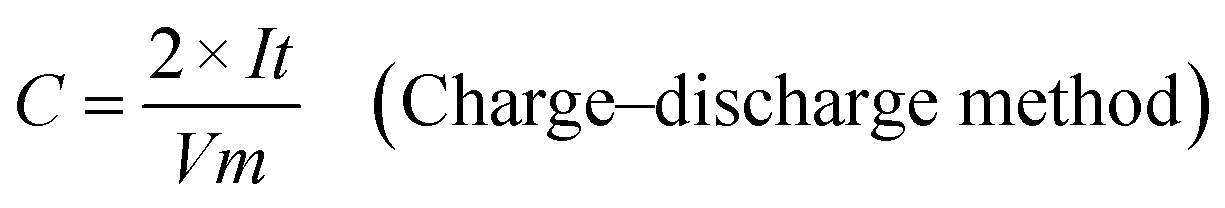
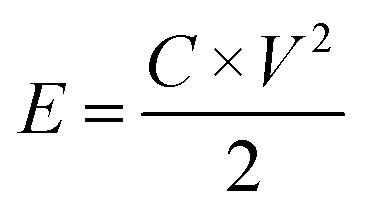
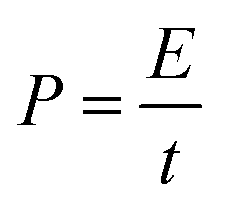
The as-prepared CNFs were cut to 1 cm × 1 cm pieces and directly used as the supercapacitor electrodes. The typical mass of a single electrode was ∼2 mg and no other conductive additives were used. A symmetrical two-electrode cell from MTI Corp (EQ-STC) was used to evaluate the electrochemical performance of the P-CNFs. A piece of filter paper was sandwiched between two pieces of identical P-CNF to form the supercapacitor assembly. 6 M KOH aqueous solution was used as the electrolyte. The electrochemical performance of the CNF electrodes was examined with a CHI-660E electrochemical workstation. Cyclic voltammetry (CV) and constant-current charge–discharge experiments were carried out in the voltage window from 0–1 V. The specific capacitance can be calculated as follows:
 | (1) |
 | (2) |
 | (3) |
 | (4) |
The electrochemical impedance spectra (EIS) were obtained from 30 kHz to 0.01 Hz with an AC voltage of 10 mV under open circuit conditions. The specific capacitance was also calculated from EIS by the equation
 | (5) |
Results and discussion
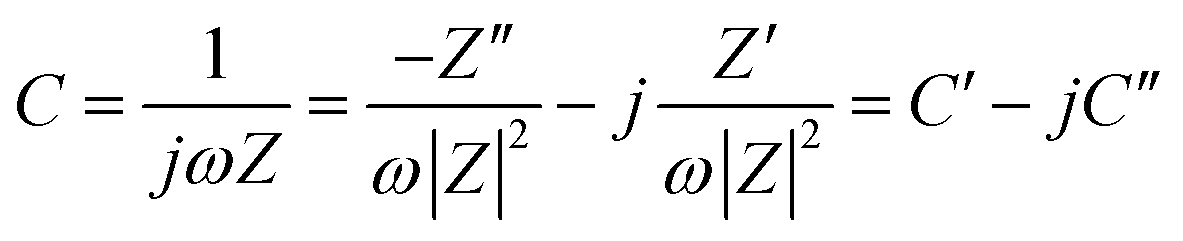
Fig. 1 shows the morphology of the CNFs and the P-CNFs. The diameter distribution of the CNFs was narrow and the average diameter was ∼200 nm. After addition of H3PO4, the fibers showed more curvatures and the diameter distribution was more decentralized. When H3PO4 was co-spun with PAN, the electrical conductivity of the electrospun precursor increased, which caused a stronger electrostatic force and a spinning eruption. Therefore the diameter of the P-CNF samples was less uniform compared with CNF.21 It should be noted that when the H3PO4 concentration was higher than 1%, the electrospun fibers tended to stand on the collector and shortcut the instrument, thus the H3PO4 concentration was limited to a maximum of 1% in the present work. Typical TEM images of the CNF and the P-CNFs can be found in Fig. S1.† Smooth and compact nanofibers with diameters of 200–300 nm can be observed for all the samples, which indicates the nanofibers were microporous in nature.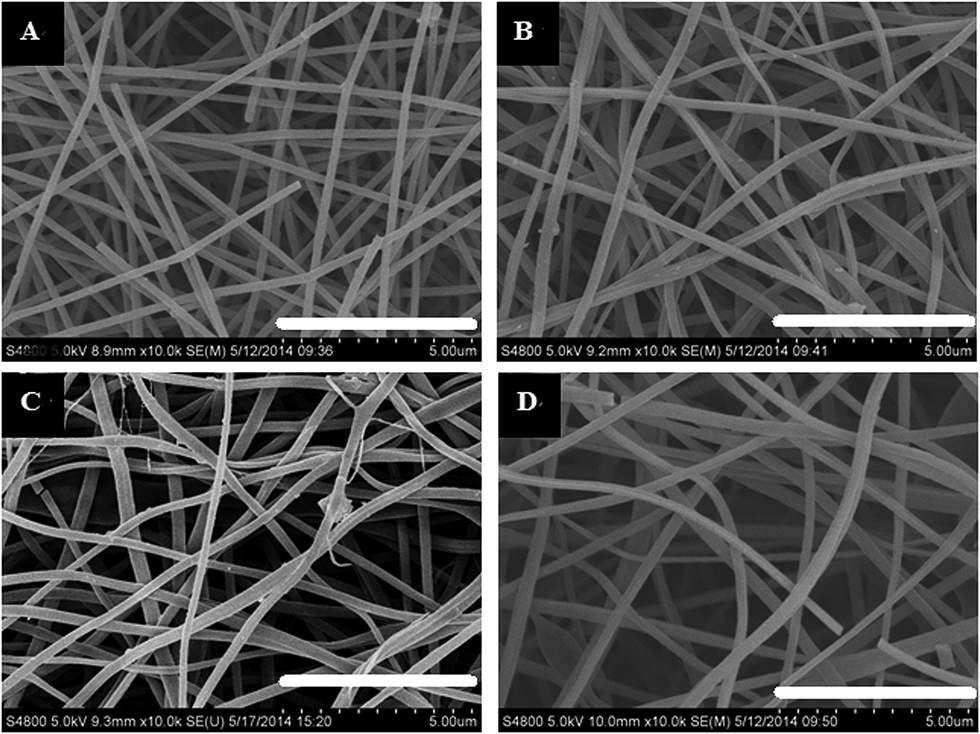 | ||
| Fig. 1 SEM images of the CNFs and the P-CNFs; (a) CNF, (b) P-CNF-2, (c) P-CNF-5 and (d) P-CNF-10 (The scale bar: 5 μm). | ||
Raman spectroscopy was used to characterize the chemical structure of carbon (see Fig. S2†). The peaks at 1350 cm−1 and 1590 cm−1 were assigned to the sp3 (D band) and sp2 (G band) hybridized carbon atoms, respectively. The D/G peak intensity ratio (ID/IG) of the fibers was plotted in Fig. S1(b).† The ID/IG value showed little change after addition of H3PO4, which indicated that the chemical structure in the CNFs and the P-CNFs was similar. XPS was further used to examine the surface functional groups of the CNFs. Fig. S3† shows the detailed scan of the C 1s core level. According to the literature,23 the C 1s component at 284.6 eV was ascribed to the C–C bond, the 285.7 eV component to C–O–C, the 286.7 eV component to C–OH or a C in –C–COOH, the 288.0 eV component to C![[double bond, length as m-dash]](https://www.rsc.org/images/entities/char_e001.gif) O and the 289.1 eV component to COOH. The relative intensity of the oxygen-containing peaks did not change after addition of H3PO4 (Fig. S4†). The surface chemistry of all the CNF samples had no evident differences.
O and the 289.1 eV component to COOH. The relative intensity of the oxygen-containing peaks did not change after addition of H3PO4 (Fig. S4†). The surface chemistry of all the CNF samples had no evident differences.
Cyclic voltammetry (CV) was used to evaluate the electrochemical performance of the CNF electrodes. Fig. 2(a) shows the CV curves obtained at a scan rate of 5 mV s−1 with a potential window from 0 to 1 V. The P-CNF samples showed a nearly rectangular shape, which was desirable for supercapacitor electrodes. The P-CNF-10 electrode had the largest specific current of ∼0.3 A g−1, which corresponded to ∼120 F g−1 specific capacitance. The current densities for the P-CNF-2 and P-CNF-5 samples were almost the same; the specific capacitances were 102 F g−1 and 103 F g−1, respectively. For the CNFs without H3PO4, a triangle-like CV shape was found, which indicated a less developed porous structure for ion adsorption. Fig. 2(b) displays the CV curves of different CNFs at a scan rate of 100 mV s−1. It can be seen that the P-CNF-10 electrode still had good capacitive behavior; and little distortion was observed in its CV curve. The CV curves of P-CNF-2 and P-CNF-10 electrodes showed a more distorted shape which deviated from rectangular, and lower current density. The rate capability (the capability of retaining the capacitance with increasing scan rate) was further examined by taking the CV scan at different scan rates. Fig. 2(c) shows the CV curves for the P-CNF-10 electrode at different scan rates. The specific capacitance was plotted as a function of the scan rate for different samples (Fig. 2(d)). The CNF sample without H3PO4 had a very small specific capacitance (18 F g−1) and a very low rate capability (22% of capacitance retention at 200 mV s−1). This result is consistent with the literature where negligible capacitance was observed for the un-activated CNF,17,24 and is much smaller than the steam activated CNF reported by Kim et al.25 This indicates that the CNF lacks the porosity needed for a supercapacitor electrode. The P-CNF-10 sample showed the highest specific capacitance of 132 F g−1 at 2 mV s−1; and the specific capacitance remained at 61% at 200 mV s−1, which was better than P-CNF-2 (106 F g−1, 45%) and P-CNF-5 (107 F g−1, 56%). These values are also comparable to the previous work by Kim et al.21 in which ZnCl2 was used as the activation agent.
 | ||
| Fig. 2 (a) CV of different CNFs at 5 mV s−1 scan rate, (b) CV of different CNFs at 100 mV s−1 scan rate, (c) CV of P-CNF-10 electrode from 2 mV s−1 to 200 mV s−1 and (d) the specific capacitance versus the scan rate. | ||
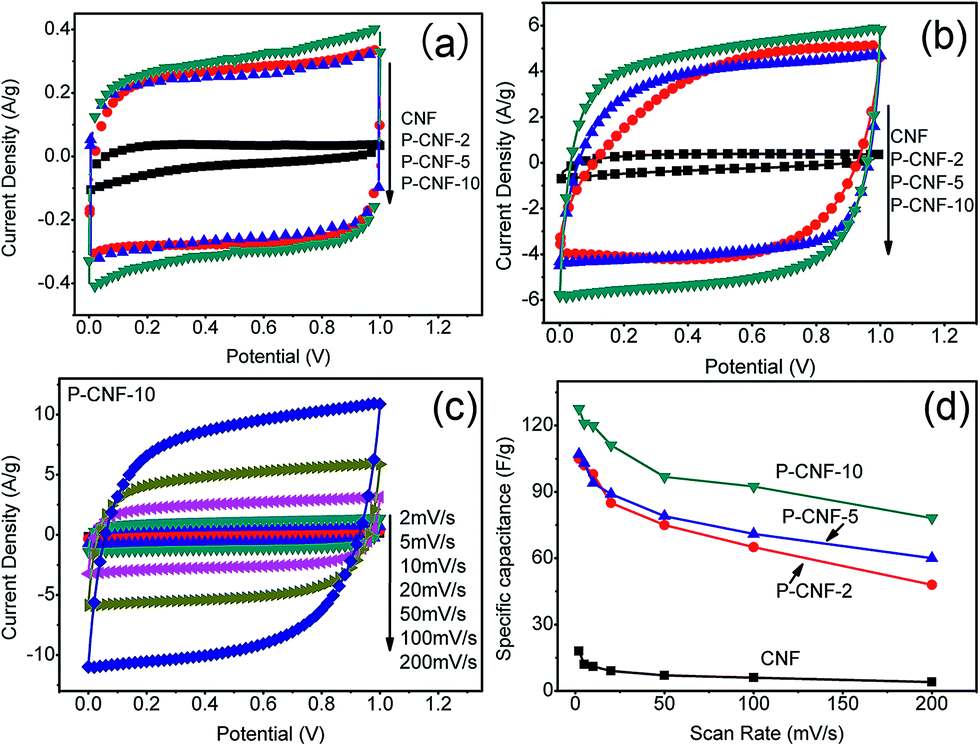
Fig. 3 depicts the galvanostatic charge–discharge testing results for the CNF electrodes. Fig. 3(a) shows the charge–discharge curves for the P-CNF-10 electrode with different current densities (0.5–10 A g−1). The symmetrical triangle shape indicates a good capacitive character with coulomb efficiency close to 1. The specific capacitance at a current density of 0.5 A g−1 was 156 F g−1, and yielded 80 F g−1 at 10 A g−1 of discharge. Fig. 3(b) reveals the behaviours of the different CNF electrodes at 5 A g−1 of discharge current. The P-CNF-10 electrode exhibited the longest discharge time and the highest specific capacitance, which was in good agreement with the CV measurement. The Ragone plot for the CNFs electrode is displayed in Fig. 3(c). The energy density of the P-CNF-10 electrode was 21.46 Wh kg−1 at 500 W kg−1 power density, and reached 10.98 Wh kg−1 at a power density of 10 kW kg−1, which is about 9 times higher than that of the CNF electrode without H3PO4 activation. Cyclic stability testing was performed on the P-CNF-10 electrode for 1000 cycles at 5 A g−1 of current density. Only ∼3.5% drop was observed in the specific capacitance during this period, which demonstrated the good cycling stability of the electrode.
 | ||
| Fig. 3 (a) constant-current charge–discharge results of the P-CNF-10 electrode at different current densities, (b) constant-current charge–discharge curves for the CNF and the P-CNF electrodes at 5 A g−1 of current density, (c) Ragone plot of the CNF and the P-CNF electrodes, (d) cyclic stability testing of the P-CNF-10 electrode for 1000 cycles. | ||
Electrochemical impedance spectroscopy (EIS) was further used to characterize the performance of the electrodes. Fig. S5† shows the typical EIS Nyquist spectrum for the P-CNF-10 electrode. A straight line was observed in the low-frequency range, which corresponded to the capacitive behavior of the supercapacitor. The ESR (equivalent series resistance) for all the CNFs electrodes was ∼0.2 Ω cm2, which mainly came from the resistance of the electrolyte. The Bode plot of the samples can be found in Fig. 4, which plots the frequency dependent C′ and C′′. The real specific capacitance (C′) increased as the frequency went below 1 Hz. The highest C′ for the P-CNF-10 electrode was ∼118 F g−1 at 0.01 Hz, which was close to the value obtained from the CV and the constant-current charge–discharge experiment. In addition, the imaginary specific capacitance (C′′) plot in Fig. 4(b) reveals the response time of the electrode. The frequency fm at which C′′ reached the maximum was defined as the characteristic frequency of the electrode, which was an indicator of the rate capability. High fm generally corresponds to better rate capability. It can be seen that the P-CNF-10 electrode had the highest fm of 0.30 Hz, followed by 0.29 Hz for P-CNF-5, 0.09 Hz for P-CNF-2 and 0.06 Hz for CNF. Such a sequence is consistent with the CV results. The response time of P-CNF-10 calculated from 1/fm was 3.3 s, which is better than that of commercial activated carbon based supercapacitors (10 s).26
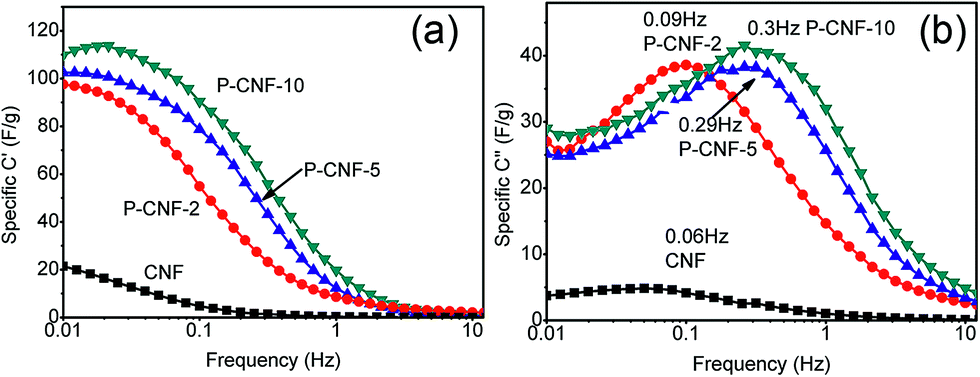 | ||
| Fig. 4 (a) Real part of the Bode plot of the CNF and P-CNF electrodes, (b) Imaginary part of the Bode plot of the CNF and P-CNF electrodes. | ||
It is well known that the electrochemical performance of an EDLC type supercapacitor electrode is determined by its pore structure.5,27 The micropores (less than 2 nm) are responsible for the ion adsorption, which determines the specific capacitance at a low rate. The mesopores (2–50 nm) serve as the ion transport pathway, which help the electrode maintain its capacitance at a fast rate. Therefore, N2 adsorption-desorption experiments were performed on the CNF samples to measure their pore structures. Fig. S6(a)† shows the isothermal curves. The adsorption amount increased as the amount of H3PO4 increased. The sharp increase in the low pressure region indicated that the curves were Type I, which is characteristic of microporous materials. The specific surface area and the pore volumes are summarized in Table 1. The highest specific surface area was observed for the P-CNF-10 electrode, which was 709 m2 g−1. The micropore volume and the mesopore volume reached 0.278 cm3 g−1 and 0.078 cm3 g−1, respectively. In contrast, the pure CNF had a much smaller specific surface area (102 m2 g−1), and the smallest pore volume (0.045 cm3 g−1). This was responsible for the different electrochemical energy storage properties of the electrodes. The addition of a small amount of H3PO4 (0.2–1%) can efficiently activate the nanofibers in situ during the carbonization process, creating the desirable pore structure for supercapacitor applications. The micropore volume increased with increasing H3PO4 concentration, which was responsible for the increased specific capacitance. As shown in the previous study,27 the rate capability of EDLC supercapacitors is governed by the mesopore/micropore volume ratio. Keeping this mind, it was not surprising that the P-CNF-10 electrode showed the best rate capability. This can be understood by the activation mechanism of H3PO4. Generally, the activation process is revealed as follows28
| 3H3PO4 = H5P3O10 + 2H2O (above 300 °C, H3PO4 hydrolyzed) | (6) |
| Sample ID | SA (m2 g−1) | TPV (cm3) | Vmicro (cm3 g−1) | Dmicro (nm) | Vmeso (cm3 g−1) | Vmeso/Vmicro |
|---|---|---|---|---|---|---|
| a SA: surface area; TPV: total pore volume; Vmicro: micropore volume; Dmicro: average diameter of the micropore; Vmeso: mesopore volume. | ||||||
| CNF | 102 | 0.045 | 0.039 | 0.95 | 0.006 | 0.15 |
| P-CNF-2 | 587 | 0.217 | 0.185 | 0.92 | 0.032 | 0.17 |
| P-CNF-5 | 651 | 0.252 | 0.210 | 1.01 | 0.042 | 0.20 |
| P-CNF-10 | 709 | 0.356 | 0.278 | 0.98 | 0.078 | 0.28 |
At higher temperatures, the hydrolyzed H3PO4 is believed to decompose and react with the carbon atoms, thus numerous micropores appear in the carbon nanofibers. As the H3PO4 concentration increases, more carbon atoms will be etched, thus the number of micropores will increase. The extra H3PO4 will result in a higher activation degree and generate more mesopores. On the other hand, H3PO4 has a low melting point (25 °C).28 This helps dispersion of H3PO4 in the nanofibers, especially at high temperature. The uniform distribution of H3PO4 ensures that only a small amount of H3PO4 is needed to create a large number of pores. Fig. S6(b)† shows the micropore distribution calculated by the H-K method. The median diameter of the micropores of the CNFs fell to ∼1 nm.
From the above results, one can see that the H3PO4 additive plays an important role in activation of CNFs. In previous literature, different activation agents were applied to electrospun carbon nanofibers. Table S1† lists the reported chemical activation agents, unit prices and their mass ratio to PAN. It can be seen that a high activation agent concentration (∼up to 4:1) was used in the previous studies. Expensive sacrificial agents such as Nafion were used to create the pores in the carbon nanofibers. Moreover, an ex situ activation process had to be adopted when KOH was used as the activation agent. The main advantage of our in situ activation strategy is that a small amount of inexpensive abundant activation agent (H3PO4) is very effective in producing the pore structure in carbon nanofibers for supercapacitor applications.
Conclusions
In summary, a facile activation method was developed to prepare electrospun porous carbon nanofibers. A small amount of H3PO4 was added into the electrospinning precursor (PAN) resulting in highly porous carbon nanofibers with specific surface area of ∼709 m2 g−1 and a total pore volume of 0.356 cm3 g−1, which was suitable for use in EDLC supercapacitors. Both the micropore volume and the mesopore/micropore volume ratio can be tailored by altering the H3PO4 concentration in the electrospinning precursor. The P-CNF-10 electrode exhibited a specific capacitance of 156 F g−1 at a current density of 0.5 A g−1. It showed an energy density of 10.98 Wh kg−1 at a power density of 10 kW kg−1, which was 9 times higher than the pristine CNF without H3PO4-based activation.Acknowledgements
This work was supported by NSFC in China (Grant no. 21303162) and the Fundamental Research Funds for the Central University (Grant no. 2014QNA4005).Notes and references
- U. Eberle and R. von Helmolt, Energy Environ. Sci., 2010, 3, 689 CAS.
- P. Simon and Y. Gogotsi, Nat. Mater., 2008, 7, 845 CrossRef CAS PubMed.
- A. Kuperman and I. Aharon, Renewable Sustainable Energy Rev., 2011, 15, 981 CrossRef PubMed.
- L. L. Zhang and X. S. Zhao, Chem. Soc. Rev., 2009, 38, 2520 RSC.
- M. Zhi, C. C. Xiang, M. Li, J. Li and N. Q. Wu, Nanoscale, 2013, 5, 72 RSC.
- X. Zhao, B. M. Sánchez, P. J. Dobson and P. S. Grant, Nanoscale, 2011, 3, 839 RSC.
- G. P. Wang, L. Zhang and J. J. Zhang, Chem. Soc. Rev., 2012, 41, 797 RSC.
- M. D. Stoller, C. W. Magnuson, Y. W. Zhu, S. Murali, J. W. Suk, R. Piner and R. S. Ruoff, Energy Environ. Sci., 2011, 4, 4685 CAS.
- E. Raymundo-PiMero, K. Kierzek, J. Machnikowski and F. Beguin, Carbon, 2006, 44, 2498 CrossRef PubMed.
- P. C. Chen, G. Shen, S. Sukcharoenchoke and C. Zhou, Appl. Phys. Lett., 2009, 94, 043113 CrossRef PubMed.
- C. Xiang, M. Li, M. Zhi, A. Manivannan and N. Q. Wu, J. Power Sources, 2013, 226, 65 CrossRef CAS PubMed.
- J. B. Mu, B. Chen, Z. C. Guo, M. Y. Zhang, Z. Y. Zhang, C. L. Shao and Y. C. Liu, J. Colloid Interface Sci., 2011, 356, 706–712 CrossRef CAS PubMed.
- Y. Hou, Y. W. Cheng, T. Hobson and J. Liu, ACS Nano, 2012, 6, 5404 CrossRef PubMed.
- L. H. Su, X. G. Zhang, C. Z. Yuan and B. Gao, J. Electrochem. Soc., 2008, 155, A110 CrossRef CAS PubMed.
- C. M. Chuang, C. W. Huang, H. Teng and J. M. Ting, Compos. Sci. Technol., 2012, 72, 1524 CrossRef CAS PubMed.
- J. G. Wang, Y. Yang, Z. H. Huang and F. Y. Kang, Electrochim. Acta, 2011, 56, 9240 CrossRef CAS PubMed.
- M. Zhi, A. Manivannan, F. Meng and N. Q. Wu, J. Power Sources, 2012, 208, 345 CrossRef CAS PubMed.
- H. S. Choi, T. H. Kim, J. H. Im and C. R. Park, Nanotechnology, 2011, 22, 405402 CrossRef PubMed.
- Q. Guo, X. Zhou, X. Li, S. Chen, A. Seema, A. Greiner and H. Hou, J. Mater. Chem., 2009, 19, 2810 RSC.
- E. J. Ra, E. Raymundo-Piñero, Y. H. Lee and F. Béguin, Carbon, 2009, 47, 2984 CrossRef CAS PubMed.
- C. Kim, B. T. N. Ngoc, K. S. Yang, M. Kojima, Y. A. Kim, Y. J. Kim, M. Endo and S. C. Yang, Adv. Mater., 2007, 19, 2341 CrossRef CAS PubMed.
- C. Tran and V. Kalra, J. Power Sources, 2013, 235, 289 CrossRef CAS PubMed.
- M. Li, S. K. Cushing, X. Zhou, S. Guo and N. Q. Wu, J. Mater. Chem., 2012, 22, 23374 RSC.
- J. G. Wang, Y. Yang, Z. H. Huang and F. Y. Kang, J. Mater. Chem., 2012, 22, 16943 RSC.
- C. Kim and K. S. Yang, Appl. Phys. Lett., 2003, 83, 1216 CrossRef CAS PubMed.
- C. Portet, P. L. Taberna, P. Simon, E. Flahaut and C. Laberty-Robert, Electrochim. Acta, 2005, 50, 4174 CrossRef CAS PubMed.
- M. Zhi, F. Yang, F. Meng, M. Li, A. Manivannan and N. Q. Wu, ACS Sustainable Chem. Eng., 2014, 2, 1592 CrossRef CAS.
- accessed on 2014-05-31, http://en.wikipedia.org/wiki/Phosphoric_acid.
Footnote |
| † Electronic supplementary information (ESI) available: Raman and XPS spectra of the CNFs, Nyquist plot of the P-CNF electrode, Isotherm adsorption–desorption curves and the pore size distributions of the CNFs, and Table S1 which summarizes the different activation agents used to prepare porous CNFs. See DOI: 10.1039/c4ra05512h |
| This journal is © The Royal Society of Chemistry 2014 |