 Open Access Article
Towards urban drainage sediment accumulation monitoring using temperature sensors†
Manuel
Regueiro-Picallo
 *ac,
Jose
Anta
 a,
Acacia
Naves
 b,
Alejandro
Figueroa
 c and
Jörg
Rieckermann
 c
c
aUniversidade da Coruña, Water and Environmental Research Team (GEAMA), Centro de Innovación Tecnolóxica en Edificación e Enxeñaría Civil (CITEEC), 15071 A Coruña, Spain. E-mail: manuel.regueiro1@udc.es
bUniversidade da Coruña, Centro de Investigaciones Científicas Avanzadas (CICA), 15071 A Coruña, Spain
cEawag, Swiss Federal Institute of Aquatic Science and Technology, CH-8600 Dübendorf, Switzerland
First published on 31st March 2023
Abstract
Sewer sediments are among the main concerns related to urban drainage system management as they represent the largest contribution of suspended solid loads during rainfall events due to their resuspension. This study presents a novel methodology to detect and assess bed deposits in urban drainage systems based on temperature monitoring by using well-known thermodynamics and sediment properties. To illustrate the heat transfer processes in a liquid–sediment system and their relation to accumulation, a lab-scale experimental campaign was performed using sewer sediments and simulating water temperature gradients in sewers. Wastewater temperatures showed a marked daily pattern, while the presence of sediment dampened dynamics. Sediment thickness could therefore be estimated from the time evolution of the temperature differences measured between the bottom of the sediment bed and the water phase. Likewise, experimental data were used to calibrate a 1D heat transfer model, from which several sediment accumulation scenarios were simulated by using real wastewater temperature series. Thus, the influence of sediment properties on accumulation processes was assessed, and the range of potentially measurable sediments within an optimal range of [5–20] cm was identified. As a conclusion, temperature measurements and heat transfer model analysis can be used to approximate and monitor the sediments deposited in urban drainage systems. Future studies will extend the method to spatially-resolved sediment monitoring and active temperature sensing to improve sediment accumulation monitoring capabilities.
Water impactAn innovative technique based on temperature measurements promises to better understand and manage sediments in urban drainage systems. We present a methodology to measure sewer sediment accumulation, including lab-scale experiments and the assessment of data-driven and physically-based models. This methodology has the potential to develop sediment clean-up strategies and more reliable particle transport models. |
1. Introduction
Handling sediment accumulation in urban drainage systems (UDS) is a recurrent problem faced by operators and local administrations since it implies significant maintenance efforts and operating costs of urban drainage assets. The presence of sediments is associated with a loss of the hydraulic capacity for which UDS were designed. The loss of performance increases the risk of overflows and flooding during rainfall events, such as combined sewer overflows (CSO), significantly impacting from an environmental and a socio-economic perspective, e.g., pollution in natural water bodies and physical and material damages, respectively.1,2Sediment sources are diverse on UDS. For instance, sediment accumulation in sewer pipes occurs due to particles carried by domestic and industrial wastewater that settle mainly because of low flow velocities during dry weather flow (DWF) periods.3 Sewer sediment accumulation shows long-term dynamics with accumulation rates ranging from 0.8 to 6.2 mm per day.4 Conversely, sewer sediments may erode under wet weather flow (WWF) conditions due to increased flow, such as during rainfall events. Sediment erosion occurs on smaller time periods compared to accumulation processes, resulting in resuspension and entrainment of pollutants that can lead to overloads at wastewater treatment plants (WWTP) and combined sewer overflow impacts into aquatic media.5 Another well-known example is the presence of sediments in gully pots, whose main sources are particles settling from surface runoff and wash-off.6 Gully pots often operate as small sediment traps preventing particles from entering the drainage pipe system. Under those conditions, sediment bed deposits increase depending on the particle loads during surface wash-off processes, leading to the implementation of cleaning and maintenance strategies.
Most UDS operators rely on previous experiences to clean and maintain these systems regarding sediment accumulation. However, there is no comprehensive understanding to determine the optimal period to perform these tasks due to the lack of measurements on sediment deposits. Some devices allow the presence of accumulated sediments in UDS to be measured or, at least, revealed, but their main disadvantage is the need for performing on-site manual measurements. For instance, sediment bed deposits in sewers and gully-pots can be measured by using graduated metal rods,7,8 acoustic profilers,9 or computer vision techniques.10,11 Nevertheless, monitoring continuously sediment accumulation is still limited by both their confined space and the lack of remote data transmission because of the feeble signal coverage in underground infrastructures.12
This study aims to estimate sediment accumulation by both monitoring temperatures and using thermodynamic models. Temperature measurements have been used to characterize sediments, i.e., to estimate accumulation processes and thermal properties, mainly in rivers and groundwater applications. At a laboratory scale, the analysis of temperature time series was used to develop methodologies based on active sensors, which introduced heat pulses, to determine the thermal properties of soils as well as their moisture content.13–15 Field studies were focused on monitoring passive temperature in water and soil to both detect sediment accumulation and erosion processes and estimate groundwater fluxes in river streambeds.16–18 To perform these determinations, the 1D heat transfer equation was simplified as the boundary conditions involve sinusoidal temperature series, such as temperature daily patterns in rivers.19 These studies focused on the fact that the thermal properties of the sediment deposited between two temperature sensors are related to the differences in the amplitudes and phase shifts between their signals.
There are also extensive examples of the application of process-based heat transfer techniques in UDS. For instance, temperature sensors were coupled inside sewer pipes to estimate and monitor flow rates by applying the dynamic time warping (DTW) technique.20 In addition, there are models, such as SWMM-HEAT, that allow the spatial and temporal evolution of heat transfer processes within a pipeline network to be simulated, e.g., to predict efficiently water-energy dynamics.21 Nevertheless, according to the authors' knowledge, few studies have used temperature-based sensors to estimate sediment accumulation in UDS. Van Hoestenberghe et al. (2016) monitored temperature oscillations by using a fibre optic distributed temperature sensing (FO-DTS) device on vertical poles installed in a sediment trap to estimate sediment accumulation and scouring.22 However, no method analyzes the relationship between in-sewer sediment thickness and heat transfer processes.
This study proposes a new methodology to measure sediment deposits in UDS with both passive temperature measurements and heat transfer model analysis by detecting the dampening of temperature dynamics. Specifically, this study focuses on measuring sediment accumulations in sewers by analysing the differences between daily temperature patterns in wastewater (liquid medium) and at the bottom of the pipe, where sediments (solid medium) are expected to accumulate. For this purpose, only the analysis of temperature series under DWF were considered, in which we can assume small daily differences in sediment accumulation. Thus, the novelty of this methodology lies in, i) adapting a research method from river streambed and groundwater studies to UDS, ii) performing dedicated laboratory tests to show heat transfer processes and the relation to sediment thickness, and iii) implementing data-driven and physically-based models to relate the dampening in temperature oscillations to the bed deposit thickness, thus estimating the measuring range.
Promising results were obtained in terms of sediment thickness estimation with temperature sensors. As a constraint, field experiments were not considered in this study to reduce the uncertainty of external factors, such as sensor deployment. The theory and methodology analysis are first presented, including a detailed discussion about the implications for real applications. Further steps will validate this approach by both performing experimental campaigns in real UDS and adapting this methodology.
2. Material
2.1. Lab-scale temperature measurements
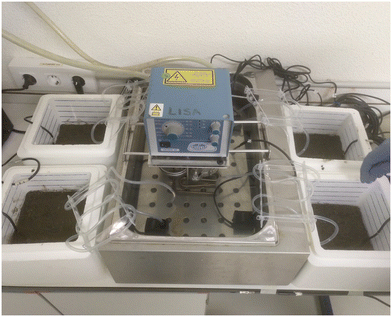
A lab-scale experimental campaign was performed to show the output information due to a variation in temperatures within a liquid–sediment system under highly controlled experimental conditions. Consequently, the relationship between sediment bed deposits and the attenuation and time lag of the temperature series in the liquid and sediment bed is reported. The data were used to test a 1D heat transfer model and to calibrate the parameters that describe this process. The dataset obtained from the experimental campaign, the detailed sensor information and calibration and the standardized methods to determine sediment composition are included in Anta et al. (2022).23The experimental campaign and the subsequent analysis were performed without considering the effects of the flow hydrodynamics on the heat transfer processes. Although the flow velocity defines the convection process at the interface between the liquid and the sediment, its impact on the heat transfer processes in the sediment layer is negligible compared to the diffusion process.25 Omitting the analysis of the convective term means a great advantage of the present methodology as it avoids measuring the hydraulics and reduces the setup to only temperature sensors.
2.2. Temperature dynamics in a sewer system
The analysis of temperature dynamics was focussed on sewer systems pipes, as a particular case within UDS. For this purpose, real temperature observations in sewer pipes were collected from the data repository of the Urban Water Observatory (UWO), which is openly accessible.26 DS18B20 temperature sensors (accuracy ±0.25 °C) are deployed at UWO's sewer network to measure wastewater temperatures. However, no information regarding sediment bed deposits or sediment-bed temperatures were available. Note that temperature oscillations from UWO inspired the experimental configurations described in the previous section.For this study, two 10 day time series were selected from a pipe of 0.7 m of diameter under DWF conditions. The first time series showed a weak daily pattern with absolute temperature oscillations which barely exceeded 1 °C (DW1, Fig. 2a). The second time series corresponded to a period with greater maximum daily differences (ΔT > 4 °C) than the previous time series (DW2, Fig. 2b). Note that UWO's wastewater temperature time series were used as a realistic example to generate surrogate sediment-bed temperatures by applying a 1D heat transfer model to subsequently analyze the attenuation and time lag between both temperature series. Indeed, the methods proposed in the following sections for measuring sediment thickness could be adapted as well for other spatial and seasonal features of sewers, which would lead to different wastewater temperature daily patterns.
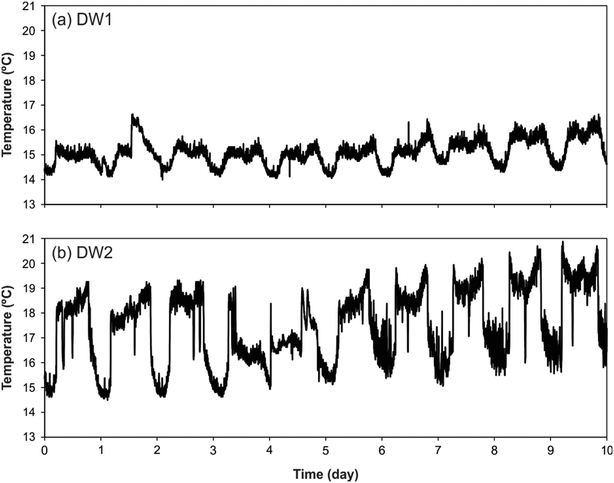 | ||
| Fig. 2 Wastewater temperature measurements under DWF conditions downloaded from the UWO repository:26 DW1 (a) and DW2 (b). | ||
3. Methods
3.1. Simplified liquid–sediment heat transfer model
 | (1) |
 | (2) |
 | (3) |
Sediment layer domains were defined with a spatial resolution (dx) of 1 mm to simulate each box. Water temperature oscillations were introduced as a Dirichlet-type boundary condition in the upper side of the domain, with a time step of 5 s. In addition, a Cauchy-type boundary condition was used in the lower side of the domain to describe the heat energy that might be lost through the thickness of the boxes. This Cauchy boundary condition can be expressed as follows:
 | (4) |
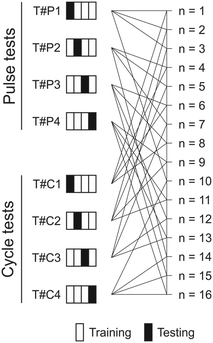
These parameters (ke and α) were calibrated by minimizing the root mean squared error (RMSE) between temperature measurements and numerical predictions at the bottom of the sediment layer. To avoid overfitting, a cross-validation procedure was applied by dividing the set of 8 lab-scale experiments into two groups of 4 experiments, corresponding to the pulse and cycle configurations. Each n-step of the cross-validation system consisted of 3 experiments from each group to calibrate the model, and 1 to test it (Fig. 3). Thus, the experiment combination was based on n = 16 steps (further details in ESI†). The objective function to obtain the best combination of parameters for each n-step was defined by the sum of the RMSE in the calibration set. The best parameter estimate was obtained by averaging the ke and α values resulting from the 16 steps of the cross-validation process. These values were implemented in the 1D heat transfer model to simulate sediment-bed temperature time series.
Temperature time series simulated at the sediment bottom were strongly conditioned by the initial conditions set in the model during the first timesteps. Based on the results of a previous research study (further details in the ESI,† Fig. S2), a 24 hours warm up of the model was considered to determine the initial conditions. Furthermore, the resulting synthetic sediment-bed temperatures did not consider the spontaneous temperature and sensor artifacts in UDS. For this purpose, these surrogate time series were modified by introducing a normal random noise signal (σ = 0.1 °C). A total of 1000 random samples were generated by each simulated sediment-bed temperature to analyze the sensitivity in sediment thickness estimation.
3.2. Sediment thickness estimation
Fig. 4 shows the scheme followed to develop sediment thickness estimation models and their validation. For this purpose, wastewater temperature data from UWO were used as input of the calibrated 1D heat transfer model to obtain synthetic sediment-bed temperatures. Once wastewater and sediment-bed temperature time series were established, local maxima and minima (local max/min method) and the harmonic features (dynamic harmonic regression method) were used to obtain features of the temperature series. Results from both methods were applied to build two data driven models that relate features of the daily temperature patterns to the sediment thickness set in the sediment bed temperature simulations. Temperature time series were split to build the data-driven models and test their performance, respectively. In addition, a third method to obtain the sediment thickness was also analyzed by applying the analytical approach proposed by Luce et al. (2013).19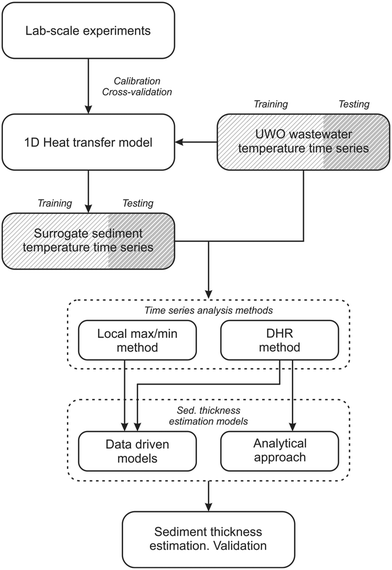 | ||
| Fig. 4 Scheme to develop and evaluate sediment thickness estimation models from wastewater and sediment-bed temperature time series. | ||
Wastewater (denoted with subindex – w) and sediment (denoted with – s) temperature peaks were paired by obtaining local maximum or minimum in the sediment temperatures after the respective peak in the liquid time series (Fig. 5). As a result, temperature ratios between water and sediment-bed temperature peaks were calculated by subtracting daily mean temperatures (![[T with combining macron]](https://www.rsc.org/images/entities/i_char_0054_0304.gif) ), thus allowing ratios to be compared independently of the base temperature (Ar = Ts/Tw). Furthermore, time lag differences (Δt) were calculated by considering the pair of times in which the maximum (or minimum) temperatures occurred. To compare this feature with the following method, time lag differences were transformed to phase differences by considering a daily-scale period (Δϕ = 2πΔt).
), thus allowing ratios to be compared independently of the base temperature (Ar = Ts/Tw). Furthermore, time lag differences (Δt) were calculated by considering the pair of times in which the maximum (or minimum) temperatures occurred. To compare this feature with the following method, time lag differences were transformed to phase differences by considering a daily-scale period (Δϕ = 2πΔt).
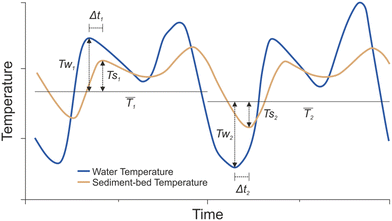 | ||
| Fig. 5 Local max/min method scheme (based on Luce et al., 2013).19 Definition for time differences (Δt1 and Δt2) and temperature ratios (Ts1/Tw1 and Ts2/Tw2) between local maxima and minima. Note that the sketch for the daily mean temperatures was simplified as these values might not coincide for liquid and sediment-bed time series. | ||
Matlab VFLUX toolbox was used to analyze asymmetric cyclic series.36 In this case, there was no flux through the sediment, so the analysis was simplified. The first step was formatting and synchronising the two temperature time series to establish both a common time range and a sample frequency. A low-pass filter was applied to reduce the noise of the synchronized series and to decrease the sample rate per fundamental cycle, i.e., daily samples. Gordon et al. (2012) suggested a reduction to 12 samples per day to improve the fundamental signal estimation using the DHR method because it is sensitive to oversampling.36 The next step was extracting the information that corresponded to the amplitude (Aw, As) and phase (ϕw, ϕs) features from the fundamental frequency of water and sediment-bed temperature time series, respectively. Finally, the output parameters were the amplitude ratio (Ar = As/Aw) and the time phase difference (Δϕ = ϕs − ϕw) to quantify the attenuation and the time-phase lag among the temperature time series caused by the sediment deposits.
 | (5) |
 | (6) |
The remaining 4 days of both dry weather flow time series (DW1 and DW2) were used to evaluate the performance of the thickness estimation models (testing dataset). For this purpose, the errors between the thickness estimations performed by the testing dataset and the values established in the simulations were calculated. Moreover, errors in the sediment thickness estimations based on the analytical approach were evaluated. In this case, the features obtained by the DHR method were applied to the formula proposed by Luce et al. (2013) to calculate the thickness (eqn (5)) and compare it with the value set in the simulations.19
Furthermore, a sensitivity analysis was performed to determine the influence of the variables associated with heat transfer processes on sediment thickness estimation models. For this purpose, new surrogate sediment-bed temperature time series were simulated by modifying the sediment thermal properties (ke) and the low-boundary condition parameters (α and T∞) in the 1D heat transfer model by factors of ±10% and ±25, like the analysis by Figueroa et al. (2021).21 Sediment thicknesses were subsequently calculated and compared with those obtained by applying the original sediment thickness estimation models.
4. Results
4.1. Heat transfer dynamics in laboratory experiments
Results from the lab-scale experiments showed an attenuation and phase lag in the temperature time series between the sensors deployed in water and at the bottom of the sediment layer by applying heat pulses and cycles in the liquid. As for pulse experiments, temperature measurements in both sensors gradually converged after the initial temperature increase in water of 2 °C. This convergence temperature was not equal in all tests because there was a reciprocal heat transfer between the liquid and sediments. Regarding cycle experiments, after the progressive heating and subsequent cooling of water, maximum temperatures at the bottom of the sediment-bed were attenuated [0.24–1.42] °C and phase lagged [8–68] min compared to the water temperature maxima. The attenuation and phase lag were greater the thicker the sediment layer, thus preventing from observing the temperature peak in the lab-scale experiment with 8 cm sediment thickness (further details in the ESI,† Fig. S1).4.2. Calibration of the 1D heat transfer model
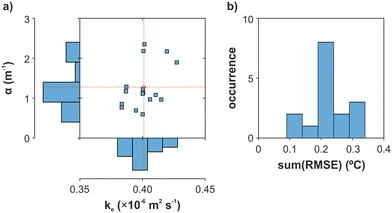
Temperature measurements from the lab-scale experiments were used to calibrate the 1D heat transfer model (eqn (2)). As described in section 3.1.3, the best fitting parameters ke and α were identified by cross-validation. After performing 16 calibrating steps, the resulting range of ke values was very low [0.38–0.43] m2 s−1, whereas α values showed a wider dispersion [0.6–2.3] m−1 (Fig. 6a). Average ke and α values were 0.40 × 10⁻⁶ m2 s−1 and 1.3 m−1, respectively. Calibration resulted in a low value of thermal diffusivity, like saturated clays.27 Considering the reference values of both the EPS convective heat transfer coefficient and saturated clay thermal conductivity,27,28 the average leakage coefficient was in the same order of magnitude. The performance of the cross-validation process was assessed by the RMSE between temperature measurements and the numerical results at the bottom of the sediment layer in the testing set, i.e., the sum of the RMSE of one pulse and cycle test for each n-step. The overall performance was satisfactory because most testing sets showed a RMSE ≤ 0.25 °C (Fig. 6b, further details in the ESI†).4.3. Sediment thickness estimation
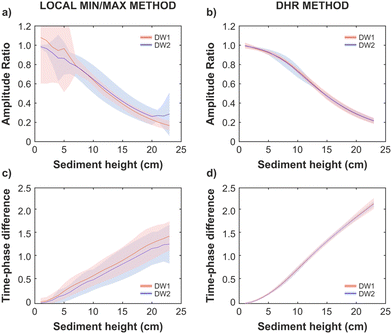
Sediment thickness was estimated by comparing the sediment-bed and wastewater temperature time series. Surrogate synthetic sediment-bed temperature time series were obtained by simulating heat transfer processes for each sediment thickness using the previous calibrated 1D model, considering the daily patterns of wastewater temperatures and including random noise signals (further details in the ESI,† Fig. S3). The qualitative analysis revealed the same trends obtained in the laboratory tests, i.e., the greater the sediment thickness, the greater the attenuation and time-phase lag of the temperature peaks in the sediment-bed compared to wastewater measurements.The relationships derived from the analysis of the training dataset, comprising 6 day temperature series under dry weather conditions (DW1 and DW2), showed that amplitude ratios determined with local max/min and DHR methods decreased as the sediment thickness increased (Fig. 7a and b). Thus, obtaining values close to 1 for small sediment thicknesses as temperature series were almost identical under these circumstances. Inversely, the time phase differences were greater as the thickness increased, thus being equal to zero in absence of sediment deposits (Fig. 7c and d). The average values of the amplitude ratios were obtained in the same range for both methods. However, the time-phase differences obtained with the local max/min method were lower than those calculated by the DHR method.
An overall smaller standard deviation of the amplitude ratio and time-phase difference relationships was obtained by applying the DHR method compared to local max/min method. The results obtained with the local max/min method displayed a high deviation of the amplitude ratio, especially when the sediment thickness was less than 7 cm (Fig. 7a). For higher thicknesses, the largest deviations of the amplitude ratio occurred in the analysis of DW2 temperature time series. Regarding the differences in the time phase of the temperature series, their deviation increased proportionally to the sediment thickness, similarly in both DW1 and DW2 temperature time series (Fig. 7c).
On the other hand, the amplitude ratio values obtained with DHR method and DW1 temperature oscillations showed a slight increasing deviation as a function of the sediment thickness (Fig. 7b). Conversely, largest deviations between 5 and 12 cm of the sediment thickness were found in the analysis of DW2 temperature time series. Furthermore, the largest deviations observed in time-phase difference relationships were found in DW1 temperature gradients and high sediment thicknesses (Fig. 7d).
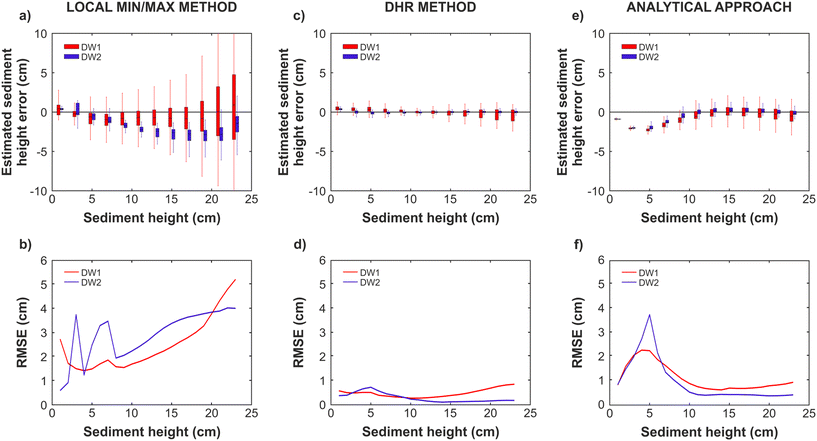
To evaluate the performance of the trained data driven models, sediment thicknesses were calculated for the testing dataset, comprising 4-day temperature time series, by averaging previous relationships. Sediment thickness estimations obtained with the data driven models showed a large deviation by using the relationships obtained by the local max/min method (Fig. 8a). In addition, Fig. 8b displays an increase in the estimation errors for greater sediment heights, as well as a clear dependency on the temperature series tested. On the other hand, the estimations performed with the features obtained from the DHR method showed a smaller spread (Fig. 8c) and a better approach compared to the local max/min method (Fig. 8d, RMSE < 1.1 cm). Comparing results from both temperature time series, the estimation of large sediment thicknesses showed an increasing variability for time series with a small daily temperature gradient.
Sediment thickness was also estimated by applying eqn (5). Fig. 8e shows the results based on the DHR method application, since the time-phase differences obtained with local max/min method were lower than expected. Therefore, great sediment height underestimations were predicted by applying the analytical approach. Significant differences were obtained up to a sediment height of 10 cm, from which the predictions of the analytical formula matched the expected values (RMSE < 1 cm for DW1 and DW2 temperature series, Fig. 8f).
The sensitivity analysis was performed to quantify the influence of the parameters that describe the diffusion heat transfer process (section 3.1.) on the sediment height estimation. For this purpose, surrogate sediment-bed temperature series were re-evaluated with the 1D heat transfer model by introducing variations of ±10% and ±25% to the parameters previously fixed based on the lab-scale experiments (ke and α), and to the low-boundary temperature (T∞). This analysis aimed to reproduce temporal variations in the sediment thermal properties, which are related to the physical–chemical properties and cohesion, and in the low-boundary, which most likely are due to seasonal oscillations in soil temperature. Fig. 9 shows the relative errors of the sediment thickness estimation using the data-driven model based on the DHR method. In the following, we describe the results of the sensitivity analysis:
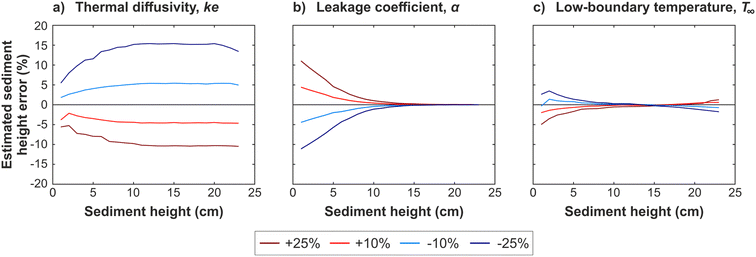 | ||
| Fig. 9 Relative error of the sediment height estimations due to the change of thermal properties (a) and low-boundary conditions (b and c). | ||
• Variations in thermal diffusivity generate an inversely proportional shift in thickness estimation, thus reaching constant relative errors for thicknesses greater than 10 cm. This parameter is the most sensitive, so it is important to determine its value and range under real accumulation conditions.
• The impact of the leakage coefficient is directly proportional to its variation, but its influence decreases as the detected thickness increases (errors < ±2% above thicknesses of 10 cm).
• The temperature at the low contour hardly influences (errors < ±5%) the thickness estimation when using the data-driven model obtained by the DHR method.
5. Discussion
Comparing liquid and sediment-bed temperature time series we could reliably measure sediment accumulation, especially applying data driven models based on harmonic feature analysis (RMSE < 1.1 cm). However, to better understand the results, the following aspects are discussed: i) the calibration of a 1D heat transfer model based on laboratory experiments; ii) its application to simulate sediment-bed temperatures in sewer pipes; iii) the performance of data-driven and analytical methods to estimate sediment thickness; iv) the limitations of the methodology; and, v) the alternatives to improve monitoring strategies.Lab-scale modules were developed to approach liquid–sediment heat transfer processes, like those that can be found in UDS, to relate temperature measurements to the presence of sediment accumulation in these systems. The experimental results showed evidence of attenuation in temperature oscillations as a function of the sediment thickness. These results were used to calibrate a numerical model by performing a cross-validation. For this purpose, the unknown parameters related to both the sediment thermal properties (thermal diffusivity, ke) and the heat loss at the bottom boundary (leakage coefficient, α) were adjusted. Thermal diffusivity was conditioned by the type of solids (sewer sediments) and its compaction and consolidation, while leakage coefficient was related to the type of material used as container, i.e., EPS in the laboratory experiments. Sewer pipes or other UDS, such as gully pots, are usually made of plastic materials or concrete, which could lead to different heat transfer processes close to the bottom boundary. Moreover, the out-of-domain temperature represents an additional factor in the heat loss in the low boundary. In these lab experiments, there was a constant room temperature. A similar trend could also be assumed in sewer pipes since small-amplitude daily oscillations of soil temperature were observed, following reference measurements from UWO.26 Although seasonal ground temperature variations could be considered, their influence on the sediment thickness estimation methodology is of no significance (Fig. 9c).
The numerical simulations strongly fit with the experimental data, especially when thickness was greater than 4 cm, while largest differences were found in tests with a sediment deposit less than 2 cm (further details in the ESI,† Fig. S1). A possible reason for these discrepancies is that the simplifications made for the 1D diffusion heat transfer model were not fulfilled by small thicknesses. Therefore, the use of more detailed models, i.e., 2D or 3D, could improve the simulations under these low sediment height conditions. Despite the interest in improving the simulation of heat transfer processes for small thicknesses, their associated sediment volume causes no operation risk in most UDS. Thus, the use of more complex models was not considered. The calibrated 1D heat transfer model was therefore used to simulate sediment-bed temperature data series from a range of sediment thicknesses and real wastewater temperature daily patterns due to the lack of real measurements.
Convective heat transfer processes between wastewater and sediments, which depend on the flow velocity, were not considered. Regueiro-Picallo et al. (2022) showed that hydrodynamics can be neglected from heat transfer processes in sewer pipes, especially for sediment thicknesses that imply a significant reduction in the hydraulic capacity of these systems (hsed > 5 cm).25 Therefore, the methodology presented in this study only focused on the analysis of diffusion heat transfer processes, which only depend on the temperatures, sediment thermal properties, and heat loss at the bottom-boundary. Consequently, we avoid measuring hydraulic parameters, which also simplifies the sensor setup.
Sediment thickness estimation models based on the relationships between attenuation and time lag of temperature series, i.e., DHR and local min/max methods, showed satisfactory results within the range of thicknesses and the type of time series analyzed. The DHR method generally showed better performance than the local max/min method because the entire temperature data series was considered to obtain the amplitudes and their respective time lags, while the local max/min model obtained these parameters by identifying 2 or 3 daily temperature peaks. The performance of both methods to estimate sediment heights was influenced by the temperature gradient in the time series, among others. Large daily gradients in wastewater and sediment-bed temperature series provided more accurate determination of local maxima and minima, and harmonic characteristics. As a result, better estimations were observed in cases where the average daily wastewater temperature gradient was 4 °C (DW2) in comparison to the time series with a daily temperature gradient of 1.5 °C (DW1). An optimal range for sediment thickness estimation could be therefore established between 5 and 20 cm by applying these two methods. If the sediment thickness is thin (<5 cm), differences between wastewater and sediment-bed temperature series are hard to observe. Conversely, if the sediment thickness is thick (>20 cm), the attenuation in the sediment-bed temperature series considerably increases, so the accuracy of calculating the time-phase decreases.
An alternative strategy to improve sediment height estimation is to develop other procedures to analyze temperature series. For instance, a DHR model could also be applied to identify not just the fundamental frequency in temperature time series, but also their consecutive harmonics, mainly the second harmonic. This parameter might be useful because, unlike studies conducted in rivers,16,17 temperature daily patterns in UDS showed two marked peaks. Another potential advantage of this strategy might be the improvement of thickness estimation during rainfall events, since the period in which they occur was shorter than the fundamental frequency, so it will be better approximated to second or third harmonics.
As for the sediment height estimations obtained with the analytical equation proposed by Luce et al. (2013),19 the results were accurate for thicknesses greater than 10 cm regarding the sediment properties and the bottom-boundary heat loss conditions proposed in this study. Thicknesses below this threshold were underestimated because homogeneous soil assumptions were not satisfied. The parameters involved in the heat transfer process due to cyclic temperature series should be thoroughly analyzed to propose corrective factors and modify this solution for a non-infinite domain.
This study was performed by assuming a constant sediment bed when analyzing temperature time series. This is not a real scenario in a UDS as dry weather periods and rainfall events cause accumulation, erosion, and sediment transport. As previously mentioned, sediment accumulation rates are low under dry weather periods, thus uniform sediment thickness conditions could be assumed for several days. Therefore, the accuracy of sediment estimations depends on the duration of the preceding temperature periods analyzed (further details in the ESI,† Fig. S4). Conversely, rainfall events could cause the scouring of some or all accumulated particles, which would significantly change sediment-bed temperature time series. Hence, short-term scouring dynamics could not be characterized with the methodology proposed in this study. Consequently, to evaluate the erosion caused by a rainfall event it is necessary to wait for the next dry weather period.
Another limitation of the proposed methodology is the potential change in sediment thermal properties. Degradation and consolidation processes, especially in organic sewer sediments,4 should be considered because they could alter thermal properties. To the authors' knowledge, there are no studies reporting on the relationships between thermal properties in sewer sediments as a function of the degree of consolidation or organic matter content. To tackle this research gap, the passive temperature monitoring system was combined with the development of an active system to measure the sediment thermal properties, like Ravazzani (2017).37
The resolution and accuracy of the temperature sensors is also a major factor to estimate sediment thickness positively because daily temperature gradients are sometimes less than 2 °C. The PT100 sensors were chosen as they offer a good compromise of price, resolution, and accuracy. However, non-contact sensors, such as infrared thermometers, could also be used to measure temperatures in the water layer, thus avoiding occasional non-submergence due to low flow rates, humidity or the growth of biofilms that could influence measurements.
Single site temperature measurements were only considered throughout this study, which is a significant development in the field of sediment accumulation monitoring. However, the application of other temperature sensor configurations to estimate the spatial distribution of sediment accumulation in UDS could be considered in further analyses, such as the use of FO-DTS at the bottom of sewer pipes. FO-DTS sensors have the advantage of measuring the temporal and spatial distribution of temperatures. Their use in the field of urban drainage has been widely reported, e.g., to detect both infiltrations due to the deterioration of pipe systems,38,39 or illicit connections of separating systems.40 In addition, FO-DTS sensors allow an active system to be integrated to obtain thermal properties, like the studies by Shehata et al. (2019) and Simon et al. (2020), which were based on characterizing soils and groundwater fluxes, respectively.14,15 Conversely, the disadvantages of these sensors are a rather complicated installation due to the control of the inflows and high operational and maintenance costs.
6. Conclusions
In-sewer sediment deposits cause substantial environmental pollution and consume operation and maintenance resources. The results of this study show that the analysis between the temperature time series measured in the liquid medium and at the bottom of bed deposits can overcome the challenges of traditional monitoring approaches to measure sediment accumulation in sewers or gully-pots. The lab-scale experimental campaign proved the dependency of sediment thickness and temperature attenuation between water and sediment-bed layers. These measurements were used to calibrate a 1D heat transfer model, which was applied to generate synthetic temperature time series in sewer pipes by simulating various accumulation scenarios. Thus, temperature measurements that would be obtained inside pipes with different sediment thicknesses could be simulated.Two methods were presented to quantify the attenuation and the time lag of wastewater and surrogate sediment-bed temperature series. These features were correlated with simulated thicknesses to develop data-driven models for sediment thickness estimation. The DHR method showed better performance (RMSE < 1.1 cm) compared to the local max/min method (RMSE < 10.0 cm). This analysis suggests that the current method works best for sediment thicknesses between 5 and 20 cm and taking various-day temperature measurements under dry weather flow conditions. The estimate of sediment thickness with data-driven models could be further improved by considering more advanced features, such as second harmonics within the DHR method because of the inherent characteristics of the temperature series in sewers under dry weather conditions. Regarding the physics-based models, which were suitable for sediment thicknesses greater than 10 cm, correction factors could improve the measurement of small sediment heights.
Further alternatives to monitor strategies include the use of various sensors or active temperature sensing strategies. Sensors, such as infrared thermometers or fibre-optic distributed temperature sensing, could provide valuable information on spatial–temporal dynamics of sediment accumulation processes. Likewise, active temperature sensing could be used to measure sediment thermal properties and open new doors for physics-based models.
Next studies should focus on the heat transfer processes in different UDS. For instance, this methodology is suitable for measuring sediment accumulation in sewer pipes because we can assume that the wastewater-depth temperature is constant and heat transfer processes occur instantly at the sediment-liquid interface as convection effects are negligible. Nevertheless, the dynamics in other UDS, e.g. gully pots, are different and another approach is required. Therefore, a better understanding of heat transfer processes will improve the use of temperature sensors to measure sediment bed deposits in UDS. The practical application of this methodology will allow sediment accumulation to be monitored and more efficient cleaning strategies to be defined. Moreover, the dynamics of sediment transport will be better understood to improve existing models.
Conflicts of interest
There are no conflicts of interest to declare.Acknowledgements
The work developed by Manuel Regueiro-Picallo is funded within the postdoctoral fellowship programme from the Xunta de Galicia (Consellería de Cultura, Educación e Universidade). This work was partially founded by the EU under the Horizon 2020 program within a contract for Integrating Activities for Starting Communities (Co-UDlabs project. GA No.101008626). Finally, the authors would like to thank Raúl Pernas for his collaboration during part of the experimental campaign.References
- H. De Man, H. H. J. L. Van Den Berg, E. J. T. M. Leenen, J. F. Schijven, F. M. Schets, J. C. Van Der Vliet, F. Van Knapen and A. M. de Roda Husman, Quantitative assessment of infection risk from exposure to waterborne pathogens in urban floodwater, Water Res., 2014, 48, 90–99 CrossRef CAS PubMed
.
- M. Van Bijnen, H. Korving, J. Langeveld and F. Clemens, Quantitative impact assessment of sewer condition on health risk, Water, 2018, 10(3), 245 CrossRef
.
-
R. M. Ashley, J. L. Bertrand-Krajewski, T. Hvitved-Jacobsen and M. Verbanck, Solids in sewers, IWA Publishing, London, UK, 2004 Search PubMed
.
- M. Regueiro-Picallo, J. Suárez, E. Sañudo, J. Puertas and J. Anta, New insights to study the accumulation and erosion processes of fine-grained organic sediments in combined sewer systems from a laboratory scale model, Sci. Total Environ., 2020, 716, 136923 CrossRef CAS PubMed
.
- M. Bartos, B. Wong and B. Kerkez, Open storm: a complete framework for sensing and control of urban watersheds, Environ. Sci.: Water Res. Technol., 2018, 4(3), 346–358 RSC
.
-
M. W. J. Rietveld, On the build-up of storm water solids in gully pots, TU Delft, 2021 Search PubMed
.
- J. L. Bertrand-Krajewski, J. P. Bardin and C. Gibello, Long term monitoring of sewer sediment accumulation and flushing experiments in a man-entry sewer, Water Sci. Technol., 2006, 54(6–7), 109–117 CrossRef CAS PubMed
.
- M. W. J. Rietveld, F. H. L. R. Clemens and J. G. Langeveld, Monitoring and statistical modelling of the solids accumulation rate in gully pots, Urban Water J., 2020, 17(6), 549–559 CrossRef
.
- M. Lepot, T. Pouzol, X. Aldea Borruel, D. Suner and J. L. Bertrand-Krajewski, Measurement of sewer sediments with acoustic technology: from laboratory to field experiments, Urban Water J., 2017, 14(4), 369–377 CrossRef
.
- C. Oms, M. C. Gromaire and G. Chebbo, In situ observation of the water-sediment interface in combined sewers, using endoscopy, Water Sci. Technol., 2003, 47(4), 11–18 CrossRef CAS PubMed
.
- G. Shahsavari, G. Arnaud-Fassetta and A. Campisano, A field experiment to evaluate the cleaning performance of sewer flushing on non-uniform sediment deposits, Water Res., 2017, 118, 59–69 CrossRef CAS PubMed
.
-
J. L. Bertrand-Krajewski, F. Clemens-Meyer and M. Lepot, Metrology in urban drainage and stormwater management: Plug and pray, IWA Publishing, London, UK, 2021 Search PubMed
.
- J. Benítez-Buelga, C. Sayde, L. Rodríguez-Sinobas and J. S. Selker, Heated fiber optic distributed temperature sensing: A dual-probe heat-pulse approach, Vadose Zone J., 2014, 13(11), 1–10 CrossRef
.
- M. Shehata, J. Heitman, J. Ishak and C. Sayde, High-resolution measurement of soil thermal properties and moisture content using a novel heated fiber optics approach, Water Resour. Res., 2020, 56(7), e2019WR025204 CrossRef
.
- N. Simon, O. Bour, N. Lavenant, G. Porel, B. Nauleau, B. Pouladi, L. Longuevergne and A. Crave, Numerical and experimental validation of the applicability of active-DTS experiments to estimate thermal conductivity and groundwater flux in porous media, Water Resour. Res., 2021, 57(1), e2020WR028078 CrossRef
.
- D. Tonina, C. Luce and F. Gariglio, Quantifying streambed deposition and scour from stream and hyporheic water temperature time series, Water Resour. Res., 2014, 50(1), 287–292 CrossRef
.
- E. Sebok, P. Engesgaard and C. Duque, Long-term monitoring of streambed sedimentation and scour in a dynamic stream based on streambed temperature time series, Environ. Monit. Assess., 2017, 189(9), 1–15 CrossRef PubMed
.
- E. Sebok and S. Müller, The effect of sediment thermal conductivity on vertical groundwater flux estimates, Hydrol. Earth Syst. Sci., 2019, 23(8), 3305–3317 CrossRef
.
- C. H. Luce, D. Tonina, F. Gariglio and R. Applebee, Solutions for the diurnally forced advection-diffusion equation to estimate bulk fluid velocity and diffusivity in streambeds from temperature time series, Water Resour. Res., 2013, 49(1), 488–506 CrossRef
.
- D. J. Dürrenmatt, D. Del Giudice and J. Rieckermann, Dynamic time warping improves sewer flow monitoring, Water Res., 2013, 47(11), 3803–3816 CrossRef PubMed
.
- A. Figueroa, B. Hadengue, J. P. Leitão, J. Rieckermann and F. Blumensaat, A distributed heat transfer model for thermal-hydraulic analyses in sewer networks, Water Res., 2021, 204, 117649 CrossRef CAS PubMed
.
-
T. Van Hoestenberghe, R. Vanthillo, M. De Paepe, N. Dezillie and N. Van Ransbeeck, Continuous grid monitoring to optimize sedimentation management, in River Sedimentation, ed. S. Wieprecht, S. Haun, K. Weber, M. Noack and K. Terheiden, CRC Press, London, UK, 1st edn, 2016, pp. 1295–1298 Search PubMed
.
-
J. Anta, M. Regueiro-Picallo, A. Naves and R. Pernas, SEDTEMP. Identifying sediment deposits from temperature signals, ZENODO, 2022, DOI:10.5281/zenodo.7258998
.
- A. Montserrat, O. Gutiérrez, M. Poch and L. Corominas, Field validation of a new low-cost method for determining occurrence and duration of combined sewer overflows, Sci. Total Environ., 2013, 463, 904–912 CrossRef PubMed
.
- M. Regueiro-Picallo, A. Figueroa and J. Rieckermann, Improving sediment monitoring strategies based on analysing heat transfer processes in sewer pipes, presented in part at 10th International Conference on Sewer Processes and Networks, Graz, Austria, 2022 Search PubMed.
- The Urban Water Observatory - Long-term monitoring of urban water resources dynamics in very high spatiotemporal resolution using low-power sensor and data communication techniques, https://uwo-opendata.eawag.ch/, (accessed 16 August 2022).
- I. N. Hamdhan and B. G. Clarke, Determination of thermal conductivity of coarse and fine sand soils, presented in part at World Geothermal Congress, Bali, Indonesia, 2010 Search PubMed.
- S. M. Koju, Thermal behaviour of expanded polystyrene based lightweight concrete sandwich panel at various temperatures, J. Eng. Sci., 2017, 4, 47–52 CrossRef
.
- R. M. Ashley, B. P. Coghlan and C. Jefferies, The quality of sewage flows and sediment in Dundee, Water Sci. Technol., 1990, 22(10–11), 39–46 CrossRef
.
- M. Verbanck, Sewer sediment and its relation with the quality characteristics of combined sewer flows, Water Sci. Technol., 1990, 22(10–11), 247–257 CrossRef
.
- R. L. Lange and M. Wichern, Sedimentation dynamics in combined sewer systems, Water Sci. Technol., 2013, 68(4), 756–762 CrossRef PubMed
.
- M. Rinas, J. Tränckner and T. Koegst, Sedimentation of raw sewage: Investigations for a pumping station in northern germany under energy-efficient pump control, Water, 2018, 11(1), 40 CrossRef
.
- P. C. Young, D. J. Pedregal and W. Tych, Dynamic harmonic regression, J Forecast., 1999, 18(6), 369–394 CrossRef
.
- C. E. Hatch, A. T. Fisher, J. S. Revenaugh, J. Constantz and C. Ruehl, Quantifying surface water–groundwater interactions using time series analysis of streambed thermal records: Method development, Water Resour. Res., 2006, 42(10), W10410 CrossRef
.
- J. Keery, A. Binley, N. Crook and J. W. Smith, Temporal and spatial variability of groundwater–surface water fluxes: Development and application of an analytical method using temperature time series, J. Hydrol., 2007, 336(1–2), 1–16 CrossRef
.
- R. P. Gordon, L. K. Lautz, M. A. Briggs and J. M. McKenzie, Automated calculation of vertical pore-water flux from field temperature time series using the VFLUX method and computer program, J. Hydrol., 2012, 420, 142–158 CrossRef
.
- G. Ravazzani, Open hardware portable dual-probe heat-pulse sensor for measuring soil thermal properties and water content, Comput. Electron. Agric., 2017, 133, 9–14 CrossRef
.
- R. Schilperoort, H. Hoppe, C. De Haan and J. Langeveld, Searching for storm water inflows in foul sewers using fibre-optic distributed temperature sensing, Water Sci. Technol., 2013, 68(8), 1723–1730 CrossRef PubMed
.
- O. Panasiuk, A. Hedström, J. Langeveld, C. de Haan, E. Liefting, R. Schilperoort and M. Viklander, Using distributed temperature sensing (DTS) for locating and characterising infiltration and inflow into foul sewers before, during and after snowmelt period, Water, 2019, 11(8), 1529 CrossRef CAS
.
- J. Nienhuis, C. de Haan, J. Langeveld, M. Klootwijk and F. Clemens, Assessment of detection limits of fiber-optic distributed temperature sensing for detection of illicit connections, Water Sci. Technol., 2013, 67(12), 2712–2718 CrossRef PubMed
.
Footnote |
| † Electronic supplementary information (ESI) available. See DOI: https://doi.org/10.1039/d2ew00820c |
| This journal is © The Royal Society of Chemistry 2023 |

