 Open Access Article
Unravelling and quantifying the aging processes of commercial Li(Ni0.5Co0.2Mn0.3)O2/graphite lithium-ion batteries under constant current cycling†
Jia
Guo
 ab,
Siyu
Jin
 *a,
Xin
Sui
 a,
Xinrong
Huang
c,
Yaolin
Xu
*d,
Yaqi
Li
ab,
Peter Kjær
Kristensen
b,
Deyong
Wang
b,
Kjeld
Pedersen
b,
Leonid
Gurevich
b and
Daniel-Ioan
Stroe
a
aAAU Energy, Aalborg University, Aalborg 9220, Denmark. E-mail: sji@energy.aau.dk
bDepartment of Materials and Production, Aalborg University, Aalborg 9220, Denmark
cSchool of Electronic and Control Engineering, Chang'an University, Xi'an 710064, China
dDepartment of Chemistry, Humboldt-Universität zu Berlin, Brook-Taylor-Str. 2, 12489 Berlin, Germany. E-mail: yaolin.xu@hu-berlin.de
First published on 7th November 2022
Abstract
Constant current charging and discharging is widely used nowadays for commercial lithium (Li) ion batteries (LIBs) in applications of portable electronic devices and electric vehicles. However, the main battery degradation mechanism during constant current cycling remains unclear. In this work, electrochemical cycling, real-time temperature monitoring, and operando electrochemical impedance spectroscopy of a fresh and an aged battery have been carried out to unveil the aging mechanism during constant current cycling. The results of the incremental capacity analysis (ICA) indicate that polarization is the main reason for the capacity fading during operation. Besides, post-mortem analysis of the electrodes reveals that the formation of a solid–electrolyte interphase (SEI) and cathode–electrolyte interphase (CEI) is the leading cause of electrode degradation. The interface formation and evolution over cycling (including thickening and chemical variation) leads to continuous loss of active materials. The presence of a SEI and CEI also increases the impedance for charge transfer and transport and reduces the kinetics of electrochemical Li-ion redox on the electrodes. Moreover, the irreversible Li loss due to Li plating and SEI formation has been quantified, which accounts for 16.8% of the total Li in the battery. This work provides a mechanistic understanding of the degradation mechanism of commercial LIBs, guides the rational design of commercial batteries and inspires the design of charging and discharging protocols toward enhanced cycling stability and prolonged cycle life.
1. Introduction
Achieving the fast-charging goal without negatively impacting the lifetime and safety is a key challenge nowadays in lithium-ion battery research.1,2 Compared with the standard constant current–constant voltage (CC–CV) charging protocol, the constant current (CC) charging mode without the CV segment not only significantly shortens the charging time but also effectively prolongs 20% of the battery service life.3–5 Based on the CC charging protocol, a series of optimized charging protocols, such as pulse charging6 and multistage constant current charging,7 are designed to extend the battery life further or shorten charging time. However, most of these protocols are derived from extensive testing campaigns performed at the full cell level, rather than being rationally designed based on the degradation mechanism of the battery, due to the very limited understanding of the battery degradation mechanism in CC cycling. Therefore, mechanistic insights into the failure mechanisms of batteries during CC cycling are necessary for designing a more rational battery charging protocol.Battery degradation involves many possible degradation modes under various aging conditions, which are caused by internal structural changes and/or chemical side reactions. The main issues related to battery degradation include loss of lithium inventory (LLI) and loss of active material (LAM) at both positive and negative electrodes, resulting in capacity fade and resistance increase (RI).8 Specifically, the loss of lithium inventory may be caused by the interphase formation and its continuous thickening and Li plating.8 The loss of active materials may occur due to transition metal dissolution, graphite exfoliation or structure collapse, and isolation of active materials from ionic or electronic conduction.9 In addition, the resistance increase is mainly caused by interphase growth and crack formation.10 Although all the aforementioned modes arise often in most aging situations, their impact degrees and the primary aging mode vary significantly under different battery operation conditions.
Moreover, various analytical techniques have been reported in the literature to identify the aging mechanism of rechargeable batteries, from the level of full cells to materials. Among them, incremental capacity analysis (ICA) and a close-to-equilibrium open-circuit voltage (cte-OCV) are always used to qualitatively analyze the battery aging at the full cell level.11,12 ICA can also be used to quantify the loss of lithium inventory and the loss of active materials. Still, the results are greatly affected by the magnification of the charging–discharging curves, resulting in ambiguous results.13,14 Besides, operando electrochemical impedance spectroscopy (EIS) can be employed to derive the cell impedance.
To quantify the aging effects on batteries, post-mortem analysis of the electrodes is necessary. Because LLI mainly occurs on the negative electrode, Fang et al.15 quantified the inactive lithium on the lithium metal anode surface (based on the gas produced from some lithium compounds reacting with water) by an innovative analysis combining titration gas chromatography and X-ray photoelectron spectroscopy (XPS) analysis. To evaluate the loss of active materials, multiple characterization techniques such as SEM imaging and Raman and XPS tests have been employed to quantify the areal crack formation16 and transition metal dissolution.17 Furthermore, some researchers quantified the loss of active materials by means of manufacturing and testing coin cells with a Li–metal counter electrode in coin cells, in which the capacity decrease for the aged vs. fresh electrode corresponds to the amount of loss of active materials.18,19
In this work, we have performed battery aging tests and post-mortem analysis to unravel the major processes related to the degradation of commercial Li(Ni0.5Co0.2Mn0.3)O2 (NMC 532)/graphite LIBs under CC cycling and identified the primary aging mechanism. In particular, we have quantified the LLI on a graphite anode with a novel procedure combining pH measurement with XPS analysis. Compared to titration gas chromatography, the pH measurement worked out much more easily and also potentially more reliably. Moreover, the loss of active materials of the NMC 532 cathode and graphite anode was evaluated with a coin cell, and the resistance increase was analyzed by operando EIS in full cell and coin cell tests at the electrode level. Furthermore, the interfacial film was analyzed by the XPS test on the surfaces of the positive electrode and negative electrode. Finally, we conclude this work by providing a comprehensive aging mechanism evaluation for Li-ion batteries that are aged under CC cycling conditions and a perspective for the application of batteries as well as the design of next-generation Li-ion batteries.
2. Methodology
2.1 Battery and cycling protocols
In this study, a commercial 18650-type Li-ion battery (model: HTCNR18650-2200mAh-3.6V) with NCM 532 and graphite as the cathode and anode, respectively, was used. During the aging, the battery was placed in a climatic chamber, which was set at 35 °C. The battery was aged by charging with 2.2 A (1C-rate) from 2.5 to 4.2 V and immediately discharging with 4.4 A (2C-rate) to 2.5 V. No constant voltage stage was considered during charging or discharging. Furthermore, there was no relaxation time between the charge and discharge processes. The test platform and electrical connections between the battery cell and the battery test station are shown in Fig. S1.† A temperature sensing probe was mounted onto the battery surface to monitor the real-time temperature variation during cycle aging. After every 100 cycles, reference performance tests (RPTs) were carried out to measure the battery capacity and determine its incremental degradation. The capacity was measured in CC–CV mode by charging the battery with 0.55 A (0.25C-rate) until a maximum voltage of 4.2 V was achieved. The charging process was considered finished when a cut-off current of 0.11 A was reached. After an hour break, the battery was discharged by CC with 0.55 A (0.25C-rate) until it reached a minimum voltage of 2.5 V followed by an hour break. After the break, the measured voltage value is considered to be the cte-OCV of the battery. The state of health (SOH) was determined according to the discharge capacity. Furthermore, the electrochemical impedance spectroscopy (EIS) technique was used for measuring the battery impedance with a Digatron potentiostat for the fresh cell and the 1000 cycle-aged one at 10%, 30%, 50%, 70%, and 90% state-of-charge with a frequency from 6.5 kHz to 10 mHz. The obtained EIS spectra were fitted with an appropriate equivalent circuit model using the ZsimDemo software (provided by Ametek company).2.2 Disassembly of commercial LIBs, pH test and coin cell evaluation
![[thin space (1/6-em)]](https://www.rsc.org/images/entities/char_2009.gif) :
:![[thin space (1/6-em)]](https://www.rsc.org/images/entities/char_2009.gif) 1. The capacities of the assembled coin cells were measured using a Land CT 2001A battery tester, in the voltage range from 2.75 V to 4.2 V for the NMC 532/Li cell and from 0.001 V to 1.0 V for the graphite/Li cell. Furthermore, their impedance was measured by means of EIS using a Palmsens potentiostat.
1. The capacities of the assembled coin cells were measured using a Land CT 2001A battery tester, in the voltage range from 2.75 V to 4.2 V for the NMC 532/Li cell and from 0.001 V to 1.0 V for the graphite/Li cell. Furthermore, their impedance was measured by means of EIS using a Palmsens potentiostat.
2.3 Materials characterization
A Zeiss EVO 60 scanning electron microscope (SEM) was employed to image the morphologies and measure the thicknesses of the positive and negative electrodes. X-ray photoelectron spectroscopy (XPS) measurements were performed using a Specs XR50 with a non-monochromated Al Kα (1487 eV) X-ray source and a Phobos 150 1D-DLD electron detector. The crystalline structure of the electrode materials was characterized at 40 kV with X-ray diffraction (XRD) using a device manufactured by Panalytical and was also measured with Raman spectroscopy using a 532 nm laser.3. Results and discussion
3.1 Aging of the full cell
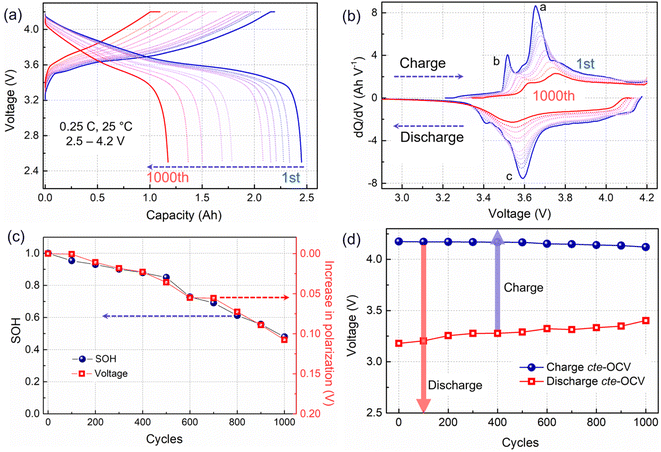
ICA and cte-OCV techniques were employed to preliminarily diagnose the battery degradation mechanisms. The charging/discharging curves from eleven RPTs are presented in Fig. 1a. With the battery aging evolution, the charging plateau shows an increasing trend, whereas the discharge plateau becomes lower. Then, the voltage gap between the charging and discharging plateaus, which is associated with the battery impedance, is gradually increasing. Meanwhile, the voltage plateau is significantly shortened, corresponding to a decrease in capacity. To further clarify the process of voltage plateau evolution, ICA was applied to the charging–discharging curves in Fig. 1a, and the obtained results are shown in Fig. 1b. The IC curves are associated with the phase transitions of active materials during the Li+ shuttle, corresponding to the a and b peaks in the charging process and c peak in the discharging process. Along with cycling, the IC peaks in the charging process show an obvious shift toward a higher voltage, implying a polarization increase.20 Usually, the shift of the higher voltage peak a may be related to a disproportionate loss of the active material at the positive and negative electrodes.21 In this work, we choose the shift of the b peak at a lower potential to quantify the increase in polarization, as shown in Fig. 1c. The progression of the capacity fade (expressed as SOH) is clearly related to the increase in polarization.A close-to-equilibrium open-circuit voltage (cte-OCV) measurement was carried out to analyze the OCV behavior with battery aging, as shown in Fig. 1d. The discharging cte-OCV increases gradually, due to the increase in polarization. As expected, the charging cte-OCV did not increase, instead a slightly decreasing trend is observed. This will lead to a decreased charging OCV range as well as a decreased charging capacity.
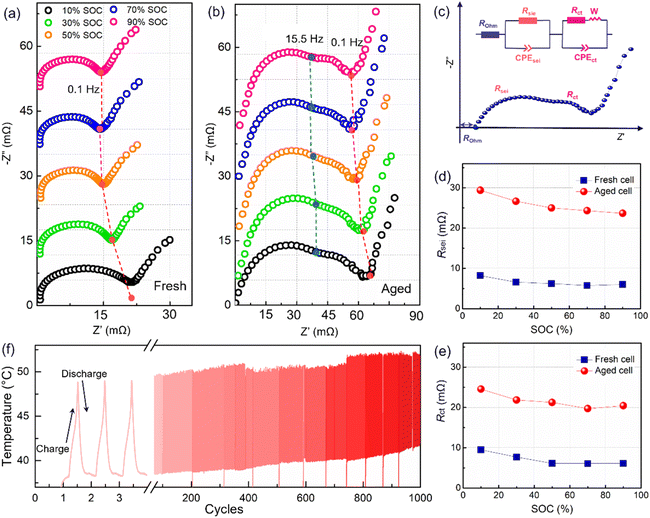
The polarization was evaluated by performing an operando electrochemical impedance spectroscopy (EIS) test. As shown in Fig. 2a and b, the measured results are Nyquist plots, which are composed of three parts with different frequency ranges, representing the bulk resistance (Rohm), the solid electrolyte interface resistance (Rsei), and the charge transfer resistance (Rct), respectively.3 The inserted equivalent circuit was employed to fit the Nyquist plots, as shown in Fig. 2c. The obtained results are presented in Fig. 2d and e. Here, the Rohm will not be adopted due to an unstable ohmic impedance caused by the connector of the electrochemical workstation, and this always shows little change in battery aging.3,12 Therefore, the Nyquist plots were translated to the origin of the coordinates. After 1000 cycles, a four-fold increase in the Rsei from below 8 mΩ to about 30 mΩ is observed (Fig. 2c). Besides, Rct has increased to over 20 mΩ (Fig. 2d), indicating an overall degradation at the electrode interface and charge transfer. Furthermore, Rsei and Rct decrease with the battery charging. Rsei is related to the diffusion of Li ions at the interface and the Rct is linked to the electrochemical reaction.22 As reported in ref. 22 the SEI film is partially ruptured at high SOC due to the increased volume of lithiation graphite, and recovers in the followed discharge process. So, the Rsei decreased with battery charge. Furthermore, a high SOC is linked to a high voltage as well as an active state of the electrochemical reaction, resulting in a lower Rct. The temperature of the battery surface was detected in the aging process, as shown in Fig. 2f. The temperature changes periodically with the charge–discharge cycle. Besides, the temperature range fluctuates, due to an uncontrollable change in the sticking position or tightness of the thermal probe on the battery surface. With the increase in the cycle number, the temperature of the battery surface gradually increases (varying from a low temperature of 42 °C to a high temperature close to 55 °C). The temperature increment will lead to a series of side reactions inside the battery during electrochemical cycling, for example, the rupture and reformation of the interfacial film at high temperatures, resulting in a continuous increase of the internal impedance. This is consistent with the discharge cte-OCV trend, further illustrating that the internal impedance continues to increase with battery cycling.
It can be concluded from the above operando diagnosis that the battery capacity fade during operation is dominated by the internal resistance in constant current cycling, especially for the Rsei increase. For further quantifying the degradation, a post-mortem analysis is necessary to be performed.
3.2 Post-mortem analysis
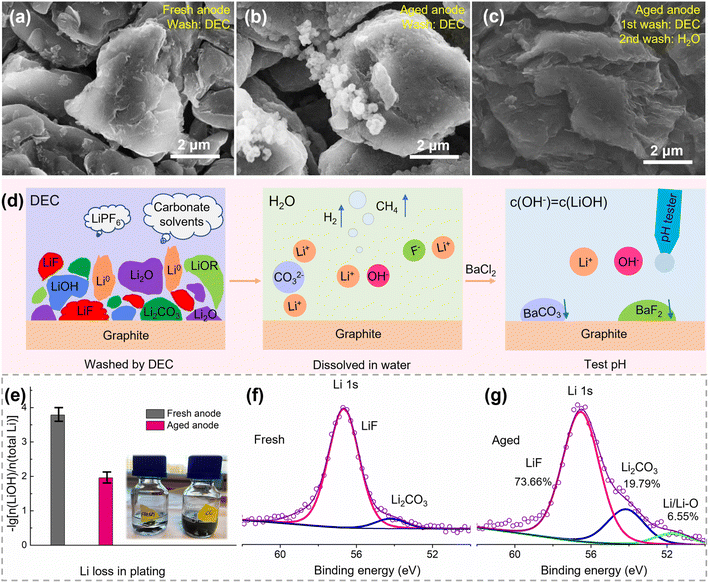
The aged cell and fresh cell were disassembled to evaluate the loss of lithium, loss of active materials, and increase of impedance in a qualitative or quantitative way. Upon opening the battery, liquid electrolyte was present in the disassembled cell and the electrodes were wet, suggesting that the consumption of electrolyte is not the major factor for battery failure. The retrieved electrodes are shown in Fig. S2.† Both the fresh positive and negative electrodes showed smooth surfaces. The positive electrode was black and shiny, and the negative electrode showed a dark gray color. In contrast, the surfaces of both electrodes in the aged cell appeared rough, and some cathode materials peeled off the positive electrode. Besides, the surface of the negative electrode was covered with a layer of a dark yellow substance, which could be SEI/lithium-rich regions caused by the electrolyte decomposition or Li plating.23| Components | Reactions with water | Species in solution |
|---|---|---|
| Li | 2Li + 2H2O = 2LiOH + H2↑ | Li+, OH− |
| Li2O | Li2O + H2O = 2LiOH | |
| CH3Li | CH3Li + H2O = LiOH + CH4↑ | |
| ROLi | ROLi + 2H2O = 2LiOH + H2↑ | |
| LiOH | N.A. | |
| LiF | N.A. | Li+, F− |
| Li2CO3 | N.A. | Li+, CO32− |
The pH values are 10.64 and 8.81 for the aged and fresh negative electrodes, respectively, corresponding to a lithium loss of 1.10% and 0.02% in the form of Li0, Li2O, LiOH, CH3Li, and ROLi, as shown in Fig. 3e. Furthermore, the XPS spectrum of Li 1s was measured for the electrodes of Fig. 3a and b, as shown in Fig. 3f and g, respectively. There are three fitted peaks for the aged negative electrode, which belong to LiF, Li2CO3, and Li/Li–O compounds, corresponding to an amount of 73.66%, 19.79%, and 6.55% Li, respectively. Here, the Li/Li–O compounds correspond to the pH quantified part (1.10%). Therefore, the lithium loss in the aged negative electrode can be quantified as 16.82%. Note that some active Li inserted in graphite during the voltage recovery from a fully discharged state. So, the pH test and XPS results establish that the lithium loss is much lower compared with the capacity loss (over 50%). This further proves that there is no significant amount of inactive lithium on the negative surface. Furthermore, the quantified Li loss in our research is close to other reported Li contents in SEI films.15,27
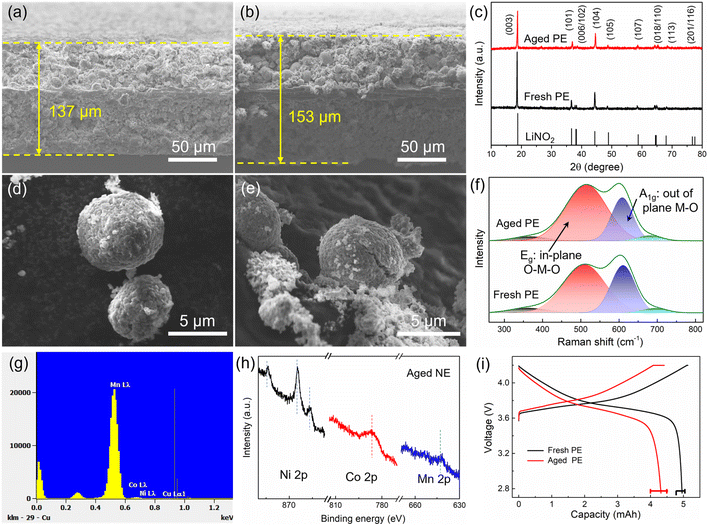
Another reason is the increased volume of cathode grains, which can be evaluated by the left shift of the XRD pattern as shown in Fig. 4c. This will lead to an increase in the paths of charge transfer and Li diffusion as well as an increased internal resistance. Besides, the inconspicuous splitting peaks (006/012) mean a decreased crystallinity, and the increased I(003)/I(104) means increased Li/Ni cation mixing for the aged positive electrode.28 Furthermore, the deterioration of the material is also reflected in particle morphology. The surface of the fresh cathode particles (Fig. 4d) is smooth, and then, pulverization and cracking happen during aging (Fig. 4e). Besides, the presence of residue powders on the cathode particle surface seems to be due to interface compositions, and this was tested by XPS as shown in Section 3.2.3. The cracks are also reflected in the Raman spectrum (Fig. 4f), where NMC can be thought of as a solid solution of LiNiO2, LiMnO2, and LiCoO2. Among them, layered LiNiO2 and LiCoO2 contribute only two Raman-active modes, one is the A1g mode at 609 cm−1 and the other is the Eg mode at 503 cm−1, corresponding to the out-of-plane M–O stretch and in-plane O–M–O band, respectively.29 The additional weak bands were contributed by LiMnO2. After aging, the increased Eg mode means an increase in the amount of the in-plane O–M–O band, which is consistent with the crack formation and inside-surface exposure as shown in Fig. 4e. As reported, the HF from electrolyte decomposition is easy to penetrate into cathode particles and induce serious side reactions, causing the transition metal to dissolve in the electrolyte and then deposit on the negative electrode surface. EDS point scans were performed to verify the presence of transition metal elements Ni, Co, and Mn, as shown in Fig. 4g. Furthermore, Ni, Co, and Mn elements can also be observed by XPS from the surface of the aged negative electrode (Fig. 4h). As reported in ref. 30 and 31, the Co deposits on the graphite surface can also accelerate the exfoliation of graphite, leading to a severe degradation of the full cell.
The factors of particle cracks, increase in grain volume, Li/Ni mixing, and transition metal dissolution have an impact on electrode capacity degradation, which can be evaluated using coin cells. As shown in Fig. 4i, the aged positive electrode shows a higher charge plateau and a lower discharge plateau, which are caused by polarization. Furthermore, there is no evident constant-voltage charging segment for the aged positive electrode, which means that the positive electrode has been fully charged before the constant-voltage charging period with a 0.05C current. In contrast, the battery voltage of the aged positive electrode prematurely reaches the upper cut-off voltage during charging due to a high internal resistance, resulting in a long constant-voltage charging period as well as a decreased battery capacity. However, over 86% of the initial capacity is still maintained.
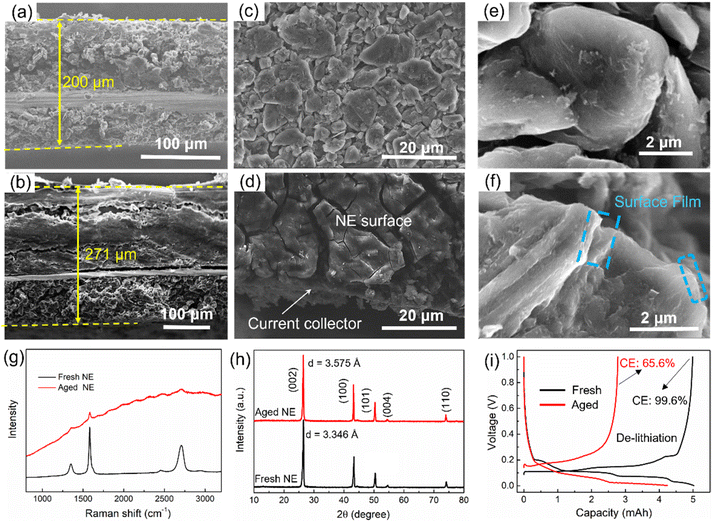
Similarly, the negative electrode also becomes thicker after aging. The thickness of the fresh negative electrode is 200 μm (Fig. 5a), which increased to 271 μm (i.e., 30.5% increase) after aging (Fig. 5b). There are a lot of cracks and exfoliated pieces in the aged negative electrode, which is a key reason for the thickening of the negative electrode. Besides, the materials are stripped from the current collector, leading to an increase in Rct, as illustrated in Fig. 2e. From the top view, the surface film, which has a thick and cracked surface, can be observed on the top of the aged negative electrode (Fig. 5d), and a surface film also can be observed from the edges of the graphite particles in the SEM image (Fig. 5f), which is the main reason for surface impedance in batteries. Besides, the graphite particles collapse into irregular shapes after degradation. Furthermore, Raman measurements with laser wavelengths of 532 nm were performed to test the interface structures of both fresh and aged negative electrodes (Fig. 5g). However, Raman spectroscopy can only detect a very weak graphitic phase from the aged negative electrode interface, implying that the thickness of the interfacial precipitates is close to 500 nm. XRD patterns were recorded to evaluate the structure change, as shown in Fig. 5h. Layer spacing of graphite increased from 3.346 Å to 3.575 Å with the aging, resulting in a volume expansion of the negative electrode. This is another reason for the electrode thickening.
The influence on negative electrode capacity is shown in Fig. 5i. The lithiation process of the graphite anode can be fully carried out with a lower cut-off voltage (0.001 V). The capacity fade of the lithiation process represents the loss of lithium-intercalated graphite, which is less than 15%. However, the de-lithiation process is easily affected by the initial charging voltage caused by an internal impedance, and the coulombic efficiency of the aged negative electrode is only 65.6%, resulting in a 44% capacity loss in the de-lithiation process compared with that of the fresh negative electrode.
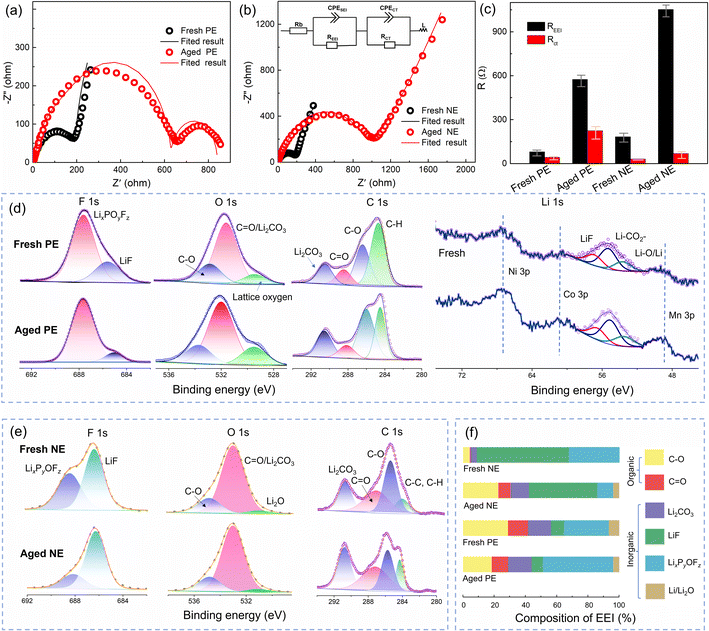
From the above analysis, it was found that an increase in impedance is the main reason for the capacity fading of the full cell, positive electrode, and negative electrode. Fig. 6a and b compare the impedance evolution of both positive and negative electrodes upon cycling, and the fitted results are shown in Fig. 6c. The Rcei of the aged positive electrode is 574.5 Ω which is higher than that of the fresh one (42.47 Ω). Besides, an extra semicircle appears in the impedance spectra of the aged positive electrode (Fig. 6a), indicating deteriorated electronic conductivity,33 which is related to the cracks and pulverization on the cathode. Furthermore, the impedance spectra of the negative electrode are shown in Fig. 6b. The Rsei of the aged negative electrode is 1052 Ω, while the Rsei of the fresh one is only 183 Ω. Therefore, the impedance of the positive and negative electrodes is mainly contributed by the interface film.
Here, XPS was performed to probe the EEI compositional information on the fresh and aged batteries.
XPS was performed to identify the CEI composition, and the results of F 1s, O 1s, C 1s, and Li 1s are shown in Fig. 6d. This indicates that CEI films are mainly composed of LixPyOFz (peaks at 688.5 eV in the F 1s spectrum), LiF (peaks at 56.5 eV in the Li 1s spectrum, and 686.3 eV in the F 1s spectrum), C–O (peaks at 535.3 eV in the O 1s spectrum), CO (peaks at 288.9 eV in the C 1s spectrum), Li2CO3 (peaks at 55.6 eV in the Li 1s spectrum and 291.0 eV in the C 1s spectrum), and Li–O (peaks at 51.5 eV in the Li 1s spectrum). It is worth noting that the percentage of lattice oxygen increases obviously for the aged positive electrode in the O 1s spectrum, which is related to the crack formation and exposing a vast fresh surface inside secondary particles,34 which is consistent with the SEM analysis in Fig. 4e. Furthermore, this was further confirmed by the enhanced bands of Ni–Li, Co–Li, and Mn–Li in the Li 1s spectrum.
For the SEI film (Fig. 6e), the formation of LixPyOFz originates from the reactions of trace H2O and LiPF6 in electrolyte,35 which belongs to the primary precipitated solid and can decompose to form Li3PO4 and LiF.36,37 In the Li 1s spectrum, Li2CO3 is mainly derived from electrolyte decomposition.36 Besides, Li2O (peak at 52.4 eV) can be attributed to Li reducing CO2 that comes from the decomposition of Li2CO3 at a high voltage (about 4.2 V).38
However, the percentage of Li–O in our research is not as high as that in other related reports,39 due to the low upper cut-off voltage (4.2 V) and the absence of the constant-voltage charging stage. Besides, the C–O and CO compounds are from the reduction of the electrolyte solvent, such as diethyl carbonate (DEC).
A quantitative analysis of the XPS data was performed for further analysis. As shown in Fig. 6f, inorganic compositions are the major EEI components, which play an essential role in achieving the electronic insulation of the EEI.32 For the SEI film, the increased content of organic compositions (such as C–O and CO) on the aged NE originates from the decomposition of ethylene carbonate (EC), which is related to a degraded electrolyte.35 Furthermore, Li2CO3 and LiF are the main ionic carriers for Li+ diffusion at the interface. The decreased percentage of LiF in the aged anode will hinder the diffusion of Li-ions, as well as lead to an increased Rsei as shown in Fig. 2d and 6b. Unlike the SEI film, the most occupied components in the CEI film are LixPyOFz and organic components, due to LiPF6 decomposition at high voltage on the positive electrode side.35 Besides, the percentage of inorganic compounds (LixPyOFz, Li2CO3, LiF, and Li2O) changed after aging, due to the further reformation of the CEI and SEI that is more easily damaged at high operation temperature. As a result, the interface composition changes in both the negative and positive electrodes along cycling.
3.3 Discussion on the degradation mechanism and perspectives for stabilization
The battery finally drops to 52% capacity in CC cycling, which is due to the loss of active materials on the negative electrode, the loss of active materials on the positive electrode, the loss of Li-ions, and an increased interfacial impedance, as summarized in Fig. 7. We quantify the available electrode materials based on the amount of Li that can be inserted into the electrode during lithiation in coin cell tests. The results show that less than 15% loss of active materials occurs on the negative and positive electrodes. Furthermore, the loss of Li-ions is also not the key limiting factor for the battery capacity fading, which only accounts for 16.8% from the pH and XPS analyses. Significantly, the resistance increase is the limiting factor for the battery capacity retention rate, resulting in 44% capacity loss for the negative electrode and 14% capacity loss for the positive electrode. The increased resistance is mainly caused by the interface films, such as the SEI film on the negative electrode and CEI film on the positive electrode.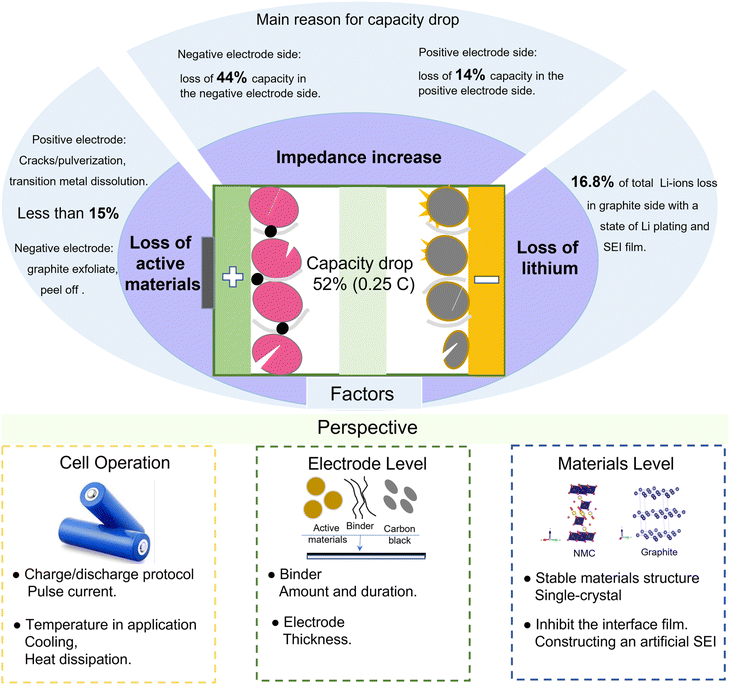 | ||
| Fig. 7 Overview of the processes related to battery capacity fade and perspectives for extending the cycle life. | ||
To further extend the battery life, some measures can be taken to stabilize the battery performance from the aspects of full-cell operation, electrode fabrication, or electrode material preparation. At the full-cell application level, the impedance increase can be inhibited by some reasonable charging/discharging protocols, such as dynamic pulse current.6 The thickening of the SEI film is mainly caused by the repeated formation and cracking processes, resulting in an increased interface impedance and a deteriorated battery performance. The application of pulse current in LIBs can construct a high stability and low impedance SEI film.40 Then, the increase in interface impedance can be effectively inhibited. Furthermore, adjusting the frequency and duty cycle of pulse current can achieve a fast charging. Besides, the temperature of the battery during operation is high and the surface temperature is close to 50 °C, even at room temperature. The high temperature will exacerbate the side reactions at the electrode interface, and then transition metals from the positive electrode will dissolve in the electrolyte and deposit on the graphite surface, resulting in the loss of active materials and an impedance increase. Therefore, heat dissipation or cooling systems are needed for the battery to operate in high-temperature environments.
At the electrode level, the phenomenon of active materials peeling is obvious for both aged positive and negative electrodes, and the formed debris detaches from the electrodes and current collectors, not only causing the loss of active materials but also hindering the diffusion of Li-ions. A durable binder is necessary to build a tight connection between the active materials and the current collector. Besides, the thickness of electrodes is also an important parameter for the battery performance. With a thicker electrode, the Li-ion transport path is longer, resulting in a battery impedance increase. However, a smaller electrode thickness will lead to a low energy density. Furthermore, the thickness of electrodes is also related to the ratio of the negative electrode capacity and positive electrode capacity, i.e., the N/P ratio. A high N/P ratio means excess graphite as well as SEI film formation, while a lower N/P will lead to the formation of Li-plating.8 Therefore, the thickness of electrodes (N/P) can be optimized to reduce the loss of active materials and inhibit the impedance increase.
At the material level, the pulverization and volume expansion of the cathode particles are serious, which will enlarge the transfer path of Li-ions, resulting in an increased impedance. The cathode materials with a single-crystal structure will effectively inhibit pulverization and volume expansion. Besides, the lower specific surface area of single-crystal particles also inhibits the amount of interface film and the dissolution of transition metals.41 For the interface film, constructing an artificial SEI on the graphite surface can inhibit the deposition derived from electrolyte decomposition and the anion solvation effect, resulting in a stable electrode/electrolyte interface as well as superior cycling stability.42
4. Conclusions
This study identifies the dominant aging mechanism of commercial Li(Ni0.5Co0.2Mn0.3)O2/graphite batteries under CC cycling conditions at the full cell, electrode and material levels. After a controlled aging test for 1000 cycles, the cell capacity drops by 52% (0.25C), which is mainly caused by the increased internal impedance. In particular, both the positive and negative electrodes show a significant increase in impedance, especially the interface resistance ascribed to the formation of the EEI films, which leads to more rapid voltage collapse to cut-off voltage and hence reduced capacity. Moreover, the increased internal impedance aggravates the heat generation during battery operation which exacerbates the parasitic reactions and accelerates the battery degradation. At the material level, the cracking/pulverization of NCM particles and transition metal dissolution are the main degradation processes on the positive electrode side, while the >35% capacity drop of the negative electrode is mainly caused by the increased interfacial impedance. Besides, the Li-plating and SEI films are the main causes for the loss of active Li-ions, accounting for 16.8% of the total Li ions in the battery.The degradation mechanisms of commercial NCM/graphite LIBs identified in this work provide guidance to rationalize the discharging and charging protocols for enhanced cycling stability and cycle life. The aging mechanisms and the methodology for identifying them could also be generalized and extended to other types of rechargeable batteries or electrochemical energy storage devices.
Author contributions
Jia Guo: methodology, experiments, and writing. Siyu Jin and Xin Sui: methodology, coordination, and experiments. Xinrong Huang, Yaqi Li, Peter Kjær Kristensen, and Deyong Wang: experiments. Yaolin Xu, Kjeld Pedersen, Leonid Gurevich, and Daniel-Ioan Stroe: resources, supervision, review, and editing.Conflicts of interest
The authors declare that they have no conflict of interest.Acknowledgements
Jia Guo and Yaqi Li were supported by a grant from the China Scholarship Council (no. 202006370035 and no. 202006220024). We would like to thank Lars Rosgaard Jensen for their help in performing the Raman test.References
- Y. Liu, Y. Zhu and Y. Cui, Nat. Energy, 2019, 4, 540–550 CrossRef.
- G. L. Zhu, C. Z. Zhao, J. Q. Huang, C. He, J. Zhang, S. Chen, L. Xu, H. Yuan and Q. Zhang, Small, 2019, 15, 1–14 Search PubMed.
- J. Zhu, M. S. Dewi Darma, M. Knapp, D. R. Sørensen, M. Heere, Q. Fang, X. Wang, H. Dai, L. Mereacre, A. Senyshyn, X. Wei and H. Ehrenberg, J. Power Sources, 2020, 448, 28–30 CrossRef.
- J. Guo, Y. Li, K. Pedersen and D. Stroe, Energies, 2021, 14, 1–22 CAS.
- T. R. Tanim, Z. Yang, A. M. Colclasure, P. R. Chinnam, P. Gasper, Y. Lin, L. Yu, P. J. Weddle, J. Wen, E. J. Dufek, I. Bloom, K. Smith, C. C. Dickerson, M. C. Evans, Y. Tsai, A. R. Dunlop, S. E. Trask, B. J. Polzin and A. N. Jansen, Energy Storage Mater., 2021, 41, 656–666 CrossRef.
- X. Huang, W. Liu, A. B. Acharya, J. Meng, R. Teodorescu and D. I. Stroe, IEEE Trans. Ind. Electron., 2021, 69, 10144–10153 Search PubMed.
- A. Laforgue, X.-Z. Yuan, A. Platt, S. Brueckner, F. Perrin-Sarazin, M. Toupin, J.-Y. Huot and A. Mokrini, J. Electrochem. Soc., 2020, 167, 140521 CrossRef CAS.
- X. Han, L. Lu, Y. Zheng, X. Feng, Z. Li, J. Li and M. Ouyang, eTransportation, 2019, 1, 100005 CrossRef.
- M. Dubarry, C. Truchot and B. Y. Liaw, J. Power Sources, 2012, 219, 204–216 CrossRef CAS.
- K. Guo, R. Kumar, X. Xiao, B. W. Sheldon and H. Gao, Nano Energy, 2020, 68, 104257 CrossRef CAS.
- J. Guo, Y. Li, J. Meng, K. Pedersen, L. Gurevich and D. Stroe, J. Energy Chem., 2022, 74, 34–44 CrossRef CAS.
- M. Dubarry, V. Svoboda, R. Hwu and B. Y. Liaw, Electrochem. Solid-State Lett., 2006, 9, A454–A457 CrossRef CAS.
- C. Pastor-Fernández, K. Uddin, G. H. Chouchelamane, W. D. Widanage and J. Marco, J. Power Sources, 2017, 360, 301–318 CrossRef.
- L. Wu, K. Liu and H. Pang, Electrochim. Acta, 2021, 368, 137604 CrossRef CAS.
- C. Fang, J. Li, M. Zhang, Y. Zhang, F. Yang, J. Z. Lee, M. H. Lee, J. Alvarado, M. A. Schroeder, Y. Yang, B. Lu, N. Williams, M. Ceja, L. Yang, M. Cai, J. Gu, K. Xu, X. Wang and Y. S. Meng, Nature, 2019, 572, 511–515 CrossRef CAS PubMed.
- K. J. Park, J. Y. Hwang, H. H. Ryu, F. Maglia, S. J. Kim, P. Lamp, C. S. Yoon and Y. K. Sun, ACS Energy Lett., 2019, 4, 1394–1400 CrossRef CAS.
- D. S. Ko, J. H. Park, S. Park, Y. N. Ham, S. J. Ahn, J. H. Park, H. N. Han, E. Lee, W. S. Jeon and C. Jung, Nano Energy, 2019, 56, 434–442 CrossRef CAS.
- D. Ren, H. Hsu, R. Li, X. Feng, D. Guo, X. Han, L. Lu, X. He, S. Gao, J. Hou, Y. Li, Y. Wang and M. Ouyang, eTransportation, 2019, 2, 100034 CrossRef.
- T. R. Tanim, Z. Yang, D. P. Finegan, P. R. Chinnam, Y. Lin, P. J. Weddle, I. Bloom, A. M. Colclasure, E. J. Dufek, J. Wen, Y. Tsai, M. C. Evans, K. Smith, J. M. Allen, C. C. Dickerson, A. H. Quinn, A. R. Dunlop, S. E. Trask and A. N. Jansen, Adv. Energy Mater., 2022, 2103712 CrossRef CAS.
- X. G. Yang, S. Ge, T. Liu, Y. Leng and C. Y. Wang, J. Power Sources, 2018, 395, 251–261 CrossRef CAS.
- D. Anseán, M. Dubarry, A. Devie, B. Y. Liaw, V. M. García, J. C. Viera and M. González, J. Power Sources, 2016, 321, 201–209 CrossRef.
- Y. Wen, J. Fan, C. Shi, P. Dai, Y. Hong, R. Wang, L. Wu, Z. Zhou, J. Li, L. Huang and S. G. Sun, Nano Energy, 2019, 60, 162–170 CrossRef CAS.
- H. J. Gonzalez Malabet, G. M. Cavalheiro, T. Iriyama, A. Gabhart, G. J. Nelson and G. Zhang, J. Electrochem. Soc., 2021, 168, 100507 CrossRef.
- H. Zheng, L. Tan, L. Zhang, Q. Qu, Z. Wan, Y. Wang, M. Shen and H. Zheng, Electrochim. Acta, 2015, 173, 323–330 CrossRef CAS.
- P. Zhang, T. Yuan, Y. Pang, C. Peng, J. Yang, Z.-F. Ma and S. Zheng, J. Electrochem. Soc., 2019, 166, A5489–A5495 CrossRef CAS.
- X. Xing, Y. Li, S. Wang, H. Liu, Z. Wu, S. Yu, J. Holoubek, H. Zhou and P. Liu, ACS Energy Lett., 2021, 6, 1831–1838 CrossRef CAS.
- J. Wandt, P. Jakes, J. Granwehr, R. A. Eichel and H. A. Gasteiger, Mater. Today, 2018, 21, 231–240 CrossRef CAS.
- H. Wei, Y. Huang, L. Tang, C. Yan, Z. He, J. Mao, K. Dai, X. Wu, J. Jiang and J. Zheng, Nano Energy, 2021, 88, 106288 CrossRef CAS.
- R. E. Ruther, A. F. Callender, H. Zhou, S. K. Martha and J. Nanda, J. Electrochem. Soc., 2015, 162, A98–A102 CrossRef CAS.
- A. Ejigu, K. Fujisawa, B. F. Spencer, B. Wang, M. Terrones, I. A. Kinloch and R. A. W. Dryfe, Adv. Funct. Mater., 2018, 28, 1804357 CrossRef.
- K. Wang, L. Xing, K. Xu, H. Zhou and W. Li, ACS Appl. Mater. Interfaces, 2019, 11, 31490–31498 CrossRef CAS PubMed.
- C. Yan, R. Xu, Y. Xiao, J. F. Ding, L. Xu, B. Q. Li and J. Q. Huang, Adv. Funct. Mater., 2020, 30, 1–21 Search PubMed.
- Y. Shi, Z. Wang, L. Wen, S. Pei, K. Chen, H. Li, H. M. Cheng and F. Li, Adv. Sci., 2022, 9, 1–9 Search PubMed.
- Y. Mao, X. Wang, S. Xia, K. Zhang, C. Wei, S. Bak, Z. Shadike, X. Liu, Y. Yang, R. Xu, P. Pianetta, S. Ermon, E. Stavitski, K. Zhao, Z. Xu, F. Lin, X. Q. Yang, E. Hu and Y. Liu, Adv. Funct. Mater., 2020, 13, 4087–4097 Search PubMed.
- M. Liu, J. Vatamanu, X. Chen, L. Xing, K. Xu and W. Li, ACS Energy Lett., 2021, 6, 2096–2102 CrossRef CAS.
- W. Zhao, G. Zheng, M. Lin, W. Zhao, D. Li, X. Guan, Y. Ji, G. F. Ortiz and Y. Yang, J. Power Sources, 2018, 380, 149–157 CrossRef CAS.
- W. Deng, W. Dai, X. Zhou, Q. Han, W. Fang, N. Dong, B. He and Z. Liu, ACS Energy Lett., 2021, 6, 115–123 CrossRef CAS.
- J. N. Zhang, Q. Li, Y. Wang, J. Zheng, X. Yu and H. Li, Energy Storage Mater., 2018, 14, 1–7 CrossRef.
- N. Mao, T. Zhang, Z. Wang and Q. Cai, J. Power Sources, 2022, 518, 230767 CrossRef CAS.
- S. Zhu, C. Hu, Y. Xu, Y. Jin and J. Shui, J. Energy Chem., 2020, 46, 208–214 CrossRef.
- J. Guo and W. Li, ACS Appl. Energy Mater., 2022, 5, 397–406 CrossRef CAS.
- W. H. Li, Q. L. Ning, X. T. Xi, B. H. Hou, J. Z. Guo, Y. Yang, B. Chen and X. L. Wu, Adv. Mater., 2018, 31, 1804766 CrossRef PubMed.
Footnote |
| † Electronic supplementary information (ESI) available: Supplementary methods and video. See DOI: https://doi.org/10.1039/d2ta05960f |
| This journal is © The Royal Society of Chemistry 2023 |

