Quasi-Cu-MOFs: highly improved water stability and electrocatalytic activity toward H2O2 reduction among pristine 3D MOFs†
Duanping
Sun
 *ab,
Linxi
Chen
a,
Lizhu
Zeng
c,
Xianhua
Shi
a and
Jing
Lu
 *ac
*ac
aKey Laboratory of New Drug Discovery and Evaluation, Guangdong Provincial Key Laboratory of Pharmaceutical Bioactive Substances, Center for Drug Research and Development, Guangdong Pharmaceutical University, Guangzhou 510006, Guangdong, China. E-mail: sundp@gdpu.edu.cn; lujing28@mail.sysu.edu.cn
bKey Specialty of Clinical Pharmacy, The First Affiliated Hospital of Guangdong Pharmaceutical University, Guangzhou 510699, Guangdong, China
cNational and Local United Engineering Lab of Druggability and New Drugs Evaluation, School of Pharmaceutical Sciences, Sun Yat-Sen University, Guangzhou 510006, Guangdong, China
First published on 2nd November 2022
Abstract
Metal–organic frameworks (MOFs) with multienzyme activity have been used as direct surrogates for conventional enzymes, while the catalytic activity of pristine MOFs is lacking, and further improvements are needed. We can accelerate electron transfer to enhance the catalytic activity by exposing catalytically active metal sites in MOFs with maintained porosity. In this work, the catalytic activity of five kinds of pristine 3D MOFs was investigated. Among these typical MOFs, HKUST-1 exhibits the best electrocatalytic activity toward H2O2 reduction and the highest peroxidase-mimicking activity. Then, quasi-HKUST-1 (QHKUST-1) products were obtained from the low-temperature calcination of HKUST-1 in an air atmosphere and controlled partial pyrolysis. Remarkably, the QHKUST-1 material (calcined at 250 °C for 1 h) maintains the perfect octahedral morphology of HKUST-1 while having more exposed active centers and exhibiting better electrical conductivity. The peroxidase-mimicking and electrocatalytic activities of QHKUST-1 for sensing are greatly improved. Moreover, QHKUST-1 exhibits superior moisture stability and catalytic properties compared to the originally water-sensitive HKUST-1. QHKUST-1 was further explored in the detection of H2O2 from living cells with an impressive detection limit of 0.3 μM. This work opens a new way to design 3D quasi-MOFs for enhanced electrochemical sensing and catalysis.
Introduction
Metal–organic frameworks (MOFs), formed by the coordination of organic linkers with metal clusters/ions, have become a promising class of crystalline materials.1–3 The majority of MOFs have a large number of properties, including porous structure, high surface area, and flexible composition.4–8 As a result, MOFs have been widely used in gas storage,9,10 electrochemical catalysis,11–16 and drug delivery17–20 due to these unique properties. Recently, some pristine MOFs with different metal centers (such as Fe, Cu and Co) have been reported with an instinct enzyme-mimicking catalytic activity.17,21,22 For instance, MIL-type MOFs have been found to exhibit peroxidase-mimicking catalytic properties, including MIL-53, MIL-88, and MIL-101.However, the good crystallinity of pristine MOFs is a double-edged sword. In most cases, the coordination spheres of the metal ions/clusters are mostly blocked by the organic linkers in the crystalline materials, leading to the poor activities of pristine MOFs.23 For example, when pristine MOFs are used for electrochemical sensors, some specific properties, such as the electrical conductivity, catalytic activity, water stability, and biocompatibility, should be greatly improved.24
Recently, a thermal transformation strategy has been applied to partially break the connection between organic linkers and metal clusters/ions.25–28 This strategy can be used to synthesize metal oxide, porous carbon, metal/carbon, and metal-oxide/carbon composites by using precursor-template original MOFs.29–32 In this regard, most of the unique properties of the MOFs are lost. Therefore, many studies have attempted to prepare activated MOFs with the structural advantages of the original MOFs by calcining MOFs at low temperatures.23,33 Furthermore, the low-temperature calcination method can also lead to the exposure of more active metal centers, which may introduce new properties or improve the original properties of MOFs.33–37
Tsumori et al. proposed “quasi-MOFs” (QMOFs) by removing organic linkers, with a transition-state structure between metal oxides and MOFs in 2018.33 This thermal conversion method can remove organic ligands through partially controllable exfoliation to form QMOF materials. Pang et al. proposed a strategy for synthesizing a “quasi-Ce-MOF” composite by using one-dimensional nanorods.35 The fabricated quasi-Ce-MOF has more exposed active metal centers while maintaining the porous structure of the precursor. QMOFs can not only retain the porosity of the framework to a certain extent, but also expose the inorganic nodes and metal centers. It is important to improve the intrinsic properties of MOFs via the controlled transformation of MOFs into QMOFs.38–40 To the best of our knowledge, this is the first report on the optimal QMOFs for the reduction of cell-released hydrogen peroxide (H2O2) for drug evaluation.
Here, the catalytic activity of five kinds of three-dimensional (3D) MOFs, including HKUST-1, ZIF-8, ZIF-67, MIL-101 and UIO-66, are investigated for the first time. Among these 3D typical MOFs, HKUST-1 exhibits the best electrocatalytic activity toward H2O2 reduction and the highest peroxidase-mimicking activities. Taking HKUST-1 as a representative, it is directly heat-treated in an air atmosphere, and controlled partial pyrolysis results in the formation of “quasi-HKUST-1” (QHKUST-1). Importantly, QHKUST-1 produces more accessible active sites for promoting the catalytic activity and still retains its intrinsic properties. The electrocatalytic activity of QHKUST-1 is greatly improved for electrochemical sensors. Moreover, the optimal QHKUST-1 exhibits superior moisture stability and catalytic properties compared to the original water-sensitive HKUST-1. QHKUST-1 was further explored in the detection of H2O2 from living cells with an impressive detection limit of 0.3 μM for drug evaluation.
Results and discussion
Characterization of the five types of typical MOFs
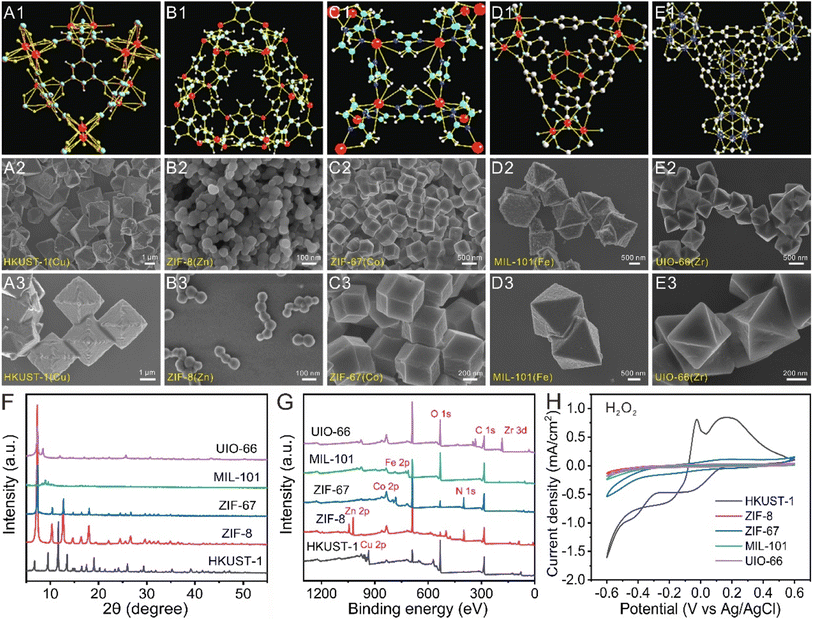
Recently, a variety of MOFs have been explored with multienzyme activity. For instance, MOFs containing Cu, Co, Zn, or Fe metal centers can exhibit enzyme-like catalytic properties because of the existence of these metal redox couples. In this work, we selected five types of 3D MOFs (HKUST-1, ZIF-8, ZIF-67, MIL-101, and UIO-66) with different metal centers to demonstrate their catalytic activity (Table S1†).First, the morphologies and sizes of the pristine 3D MOFs were investigated using scanning electron microscopy (SEM), and their structures and morphologies are shown in Fig. 1A–E. As seen in Fig. 1A, the as-prepared HKUST-1(Cu) MOFs show an octahedron morphology and are highly uniform with an average edge length of 2 μm. A magnified SEM image shows that the surfaces of these octahedron-like HKUST-1(Cu) MOFs are very smooth and have crystal planes. As depicted in Fig. 1B, the ZIF-8(Zn) MOFs are nanocrystals with sharp hexagonal facets and show uniform monodisperse nanostructures with an average size of 150 nm. The ZIF-67(Co) MOFs display a rhombic dodecahedron crystalline morphology with a uniform size of 500 nm (Fig. 1C). As shown by the SEM images in Fig. 1D, MIL-101(Fe) MOFs show an octahedron morphology with an average edge length of 1.5 μm. UiO-66(Zr) MOFs also show an octahedral morphology with particle sizes ranging from 500 to 1000 nm (Fig. 1E). These results indicated that the five types of 3D MOFs have a good dispersion.
Fig. S1† shows the five types of MOF powders and water solutions with different colours prepared in this work. Fig. 1F, S2 and S3† present the X-ray diffraction (XRD) and Fourier transform infrared (FT-IR) patterns of the five types of 3D MOFs. The XRD peak of MOFs matched well with the simulated XRD pattern. All the diffraction peaks of the formed MOFs are in agreement with previously reported results.41–43 X-ray photoelectron spectroscopy (XPS) spectra were used to characterize the elemental compositions and electronic structures of MOFs (Fig. 1G). These results are in good agreement with those of the reported papers.41–43 Therefore, all these results demonstrate the successful synthesis of the five types of 3D MOFs.
To investigate the catalase-like activity of MOFs, H2O2 was decomposed by MOFs to generate oxygen, resulting in gas bubble production. As shown in Fig. S4,† the gas bubble formation in the HKUST-1–H2O2 and ZIF-67–H2O2 systems is much greater than that in the ZIF-8–H2O2, MIL-101–H2O2, and UIO-66–H2O2 systems. The results showed that HKUST-1 and ZIF-67 have higher catalase-like activity than ZIF-8, MIL-101, and UIO-66. To further investigate the catalase-like activity of MOFs, UV-visible spectroscopy was performed to monitor the H2O2 concentration. Fig. S5† shows that the absorbance of the remaining H2O2 in the HKUST-1–H2O2 system was lower than that in the other four systems, suggesting that HKUST-1 exhibited higher catalase-like activity toward the reduction of H2O2.
To confirm the peroxidase-like activity of MOFs, o-phenylenediamine (OPD) was used as the substrate. OPD could be oxidized to produce 2,3-diaminophenazine (DPA) with a yellow color in the presence of peroxidase and H2O2. As displayed in Fig. S6,† the absorbance intensity in the HKUST-1–OPD–H2O2 system was higher than that in the ZIF-67–OPD–H2O2 system or the MIL-101–OPD–H2O2 system, revealing that HKUST-1 had the highest peroxidase-like activity.
To investigate the electrocatalytic activity of MOFs toward H2O2 reduction, cyclic voltammograms (CVs) of the different MOFs in the presence and absence of H2O2 were recorded. In Fig. 1H and S7,† the reduction current density (the current density is calculated by dividing the current response by the geometric surface area of the bare electrode) in the absence of H2O2 is much higher than that in the presence of H2O2, demonstrating the electrocatalytic activity of the five types of MOFs. The CV curves revealed that the HKUST-1-modified electrode has the largest current density under the same electrochemical detection conditions, showing the highest electrocatalytic properties for the reduction of H2O2. Among these pristine 3D MOFs with similar sizes and morphologies, the different metal centers play an important role in MOF catalysis. Therefore, HKUST-1(Cu) exhibits the highest peroxidase-mimicking activities and the best electrocatalytic activity for the reduction of H2O2 among the typical 3D MOFs.
Material characterization vs. calcination temperature
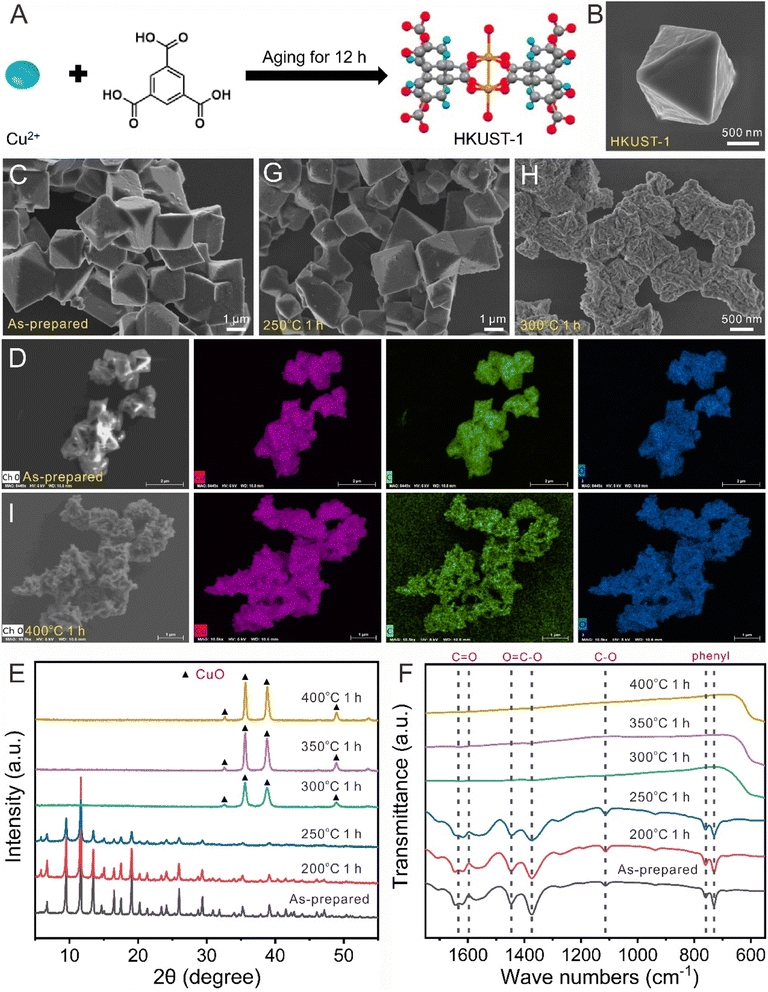
The calcination temperature and time are important for the preparation of QHKUST-1. First, thermogravimetric analysis (TGA) was used to determine the calcination temperature based on the thermal behavior of HKUST-1 (Fig. S8†). When the temperature increased to 295 °C in an air atmosphere, the weight percent decreased to 72% due to the dehydration of physically adsorbed water in HKUST-1. However, the weight percent decreased to 28% and 72% mass was lost abruptly at 312 °C, which was attributed to MOF decomposition (organic combustion) in air.Then, we calcined pristine HKUST-1 samples (Fig. 2A–D and S9†) at different temperatures for 1 h. With lower calcination temperatures (200 and 250 °C), the color of the calcined HKUST-1 powder changed from light blue to dark blue (Fig. S10†).The structural and phase changes in HKUST-1 were characterized using XRD, FT-IR, SEM, and energy dispersive spectroscopy (EDS). When HKUST-1 was calcined at 200 or 250 °C, no phase changes were observed for HKUST-1 (Fig. 2E and F). The FT-IR peak wavenumbers were identical for both as-prepared HKUST-1 and calcined HKUST-1 (200 and 250 °C). They also retained the size and octahedral shape of the HKUST-1 materials well (Fig. 2G).
With higher calcination temperatures (300, 350 and 400 °C), the color of the calcined HKUST-1 powder became black because of the existence of CuO materials (Fig. S10†). At temperatures of 300, 350 and 400 °C, the XRD peaks for the HKUST-1 phase disappeared, while the XRD peaks for pure CuO were detected, indicating that the MOF phase was converted to crystalline Cu oxide phases (Fig. 2E). When the temperature increased to 300 °C, octahedron-like porous materials were found to collapse forming flower-like cluster structures (Fig. 2H). When the temperature increased to 400 °C, the initial octahedral morphology entirely disappeared, and some CuO nanocrystals with non-regular shapes were formed (Fig. 2I and S11†). The distribution of Cu, C, and O in the EDS mapping matched well with the shape of calcined HKUST-1. These results suggested that 250 °C was chosen as the heating temperature for the conversion of the HKUST-1 template into the QHKUST-1 materials by detaching carboxylate moieties for catalytic site activation.
Material characterization vs. calcination time
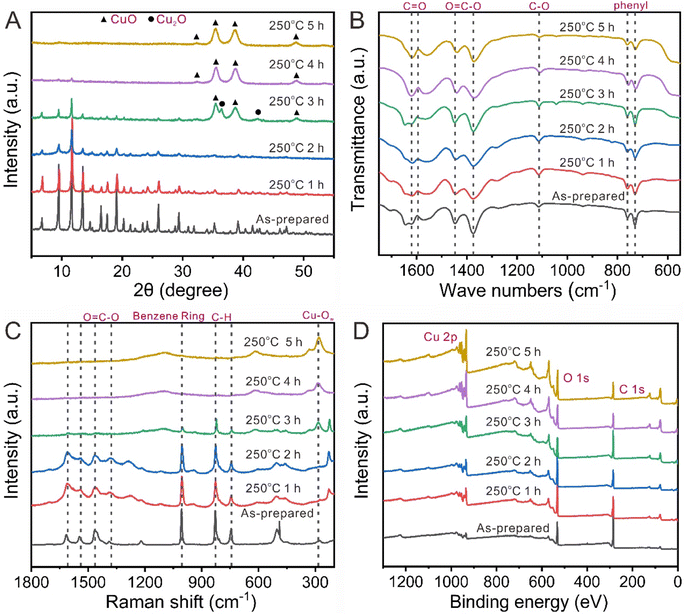
To prepare the optimal QHKUST-1 products, the calcination isothermal time was changed from 1 to 5 h at 250 °C. Fig. 3 shows the effect of calcination time on the bonding nature and crystallinity of HKUST-1. When HKUST-1 was calcined for 2 h at 250 °C, the color of the HKUST-1 powder changed from light blue to dark green (Fig. S12†). We also observed major XRD peaks for HKUST-1 with 1 and 2 h of thermal treatment. However, when the calcination time increased to 3 h, the XRD peaks for the HKUST-1 phase disappeared while the peaks for a mixture of CuO and Cu2O could be detected. When we increased the calcination time to 4 h or 5 h, the XRD peaks for pure CuO were detected (Fig. 3A). With longer calcination times (3, 4, and 5 h), the color of calcined HKUST-1 powders also changed from dark green to black due to the pure CuO (Fig. S12†).Then, we investigated the bonding features of organics by changing the calcination time to 250° via FT-IR spectroscopy and Raman analysis. The FT-IR peak wavenumbers for the vibration mode of phenyl (752, and 729 cm−1), vibration mode of C–O (1114 cm−1), symmetric vibration mode of O![[double bond, length as m-dash]](https://www.rsc.org/images/entities/char_e001.gif) C–O (1370 cm−1), asymmetric vibration mode of O
C–O (1370 cm−1), asymmetric vibration mode of O![[double bond, length as m-dash]](https://www.rsc.org/images/entities/char_e001.gif) C–O (1645, and 1440 cm−1), and symmetric vibration mode of C
C–O (1645, and 1440 cm−1), and symmetric vibration mode of C![[double bond, length as m-dash]](https://www.rsc.org/images/entities/char_e001.gif) O (1618 cm−1) were identical for the pristine HKUST-1 and calcined HKUST-1 samples (1, 2, 3, 4 and 5 h) (Fig. 3B).
O (1618 cm−1) were identical for the pristine HKUST-1 and calcined HKUST-1 samples (1, 2, 3, 4 and 5 h) (Fig. 3B).
We also observed the presence of major peaks for the C![[double bond, length as m-dash]](https://www.rsc.org/images/entities/char_e001.gif) C symmetric stretch of the Cu–O stretch, C–H bend, and benzene ring in the Raman spectra of HKUST-1 and calcined HKUST-1 samples, revealing that the organic bonding and mainframe of HKUST-1 were maintained at 250 °C for 1 or 2 h. However, as the calcination time increased from 3 to 5 h, the relative peak intensity of the asymmetric stretch of O
C symmetric stretch of the Cu–O stretch, C–H bend, and benzene ring in the Raman spectra of HKUST-1 and calcined HKUST-1 samples, revealing that the organic bonding and mainframe of HKUST-1 were maintained at 250 °C for 1 or 2 h. However, as the calcination time increased from 3 to 5 h, the relative peak intensity of the asymmetric stretch of O![[double bond, length as m-dash]](https://www.rsc.org/images/entities/char_e001.gif) C–O decreased, and the symmetric stretch in O
C–O decreased, and the symmetric stretch in O![[double bond, length as m-dash]](https://www.rsc.org/images/entities/char_e001.gif) C–O disappeared. The full width at half-maximum associated with the C–H bending peak and C
C–O disappeared. The full width at half-maximum associated with the C–H bending peak and C![[double bond, length as m-dash]](https://www.rsc.org/images/entities/char_e001.gif) C symmetric stretch of the benzene ring peak increased with decreasing peak intensity. The Cu oxidation state generation was observed and a Cu–O bonding peak around 300 cm−1 was observed at 250 °C for 3, 4 and 5 h (Fig. 3C). Therefore, we propose that carboxylic moieties are sequentially detached in the thermal activation process based on the atomic bonding nature of HKUST-1.
C symmetric stretch of the benzene ring peak increased with decreasing peak intensity. The Cu oxidation state generation was observed and a Cu–O bonding peak around 300 cm−1 was observed at 250 °C for 3, 4 and 5 h (Fig. 3C). Therefore, we propose that carboxylic moieties are sequentially detached in the thermal activation process based on the atomic bonding nature of HKUST-1.
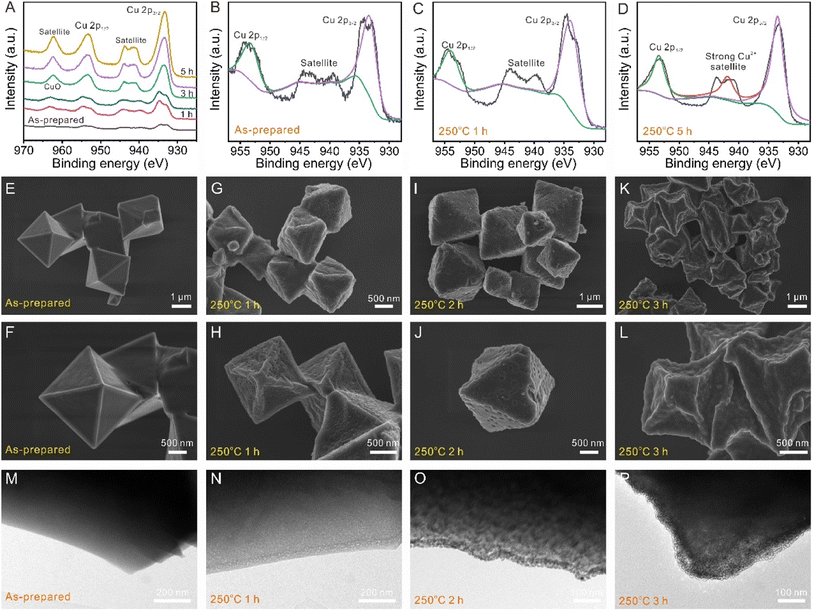
X-ray photoelectron spectroscopy (XPS) was used to further demonstrate the electronic state variation and surface element composition upon thermal treatment. The survey scan spectrum (Fig. 3D) demonstrates the presence of Cu, O, and C elements in HKUST-1 and calcined HKUST-1. The Cu2+ oxidation state of the dimer was also determined by using XPS. Compared with the as-prepared HKUST-1, the XPS peak widths of Cu 2p1/2 and 2p3/2 in the calcined HKUST-1 increased. The shape of the Cu2+ satellite peak changed to a single feature due to the “shake up” phenomenon (Fig. 4A–D). Table S2† shows the elemental quantification of the as-prepared HKUST-1 and calcined HKUST-1 determined by using XPS spectra. Table S3† shows the atomic ratios of C![[thin space (1/6-em)]](https://www.rsc.org/images/entities/char_2009.gif) :
:![[thin space (1/6-em)]](https://www.rsc.org/images/entities/char_2009.gif) Cu, O
Cu, O![[thin space (1/6-em)]](https://www.rsc.org/images/entities/char_2009.gif) :
:![[thin space (1/6-em)]](https://www.rsc.org/images/entities/char_2009.gif) Cu, and Cu
Cu, and Cu![[thin space (1/6-em)]](https://www.rsc.org/images/entities/char_2009.gif) :
:![[thin space (1/6-em)]](https://www.rsc.org/images/entities/char_2009.gif) N for the as-prepared HKUST-1 and calcined HKUST-1 determined by using XPS spectra. Thus, structural defects caused by more oxygen vacancies and higher concentrations of Cu may largely improve the catalytic performance of calcined HKUST-1 materials.
N for the as-prepared HKUST-1 and calcined HKUST-1 determined by using XPS spectra. Thus, structural defects caused by more oxygen vacancies and higher concentrations of Cu may largely improve the catalytic performance of calcined HKUST-1 materials.
As shown in Fig. 4E and F, we observed a smooth structure at the surface of HKUST-1 via SEM images for surface structure investigation. More interestingly, the surface of calcined HKUST-1 samples (1 and 2 h) is decorated with a number of holes, suggesting that the pores can be formed during the calcination process. The calcined HKUST-1 samples (1 and 2 h) have good stability without cracking or agglomeration and there are no major differences in their micromorphology (Fig. 4G–J). With the increase in calcination time to 3 h, some octahedron-like porous materials were found to collapse, forming flower-like cluster structures (Fig. 4K and L and S14†). Accordingly, with increasing calcination time, the high-magnification transmission electron microscopy (TEM) images in Fig. 4M–P and S15† revealed that a number of holes and nanoparticles were observed for the calcined HKUST-1 materials (1, 2, and 3 h). When the calcination time was increased to 4 h or 5 h, some agglomerates with non-regular shapes were observed (Fig. S16†). The electronic configuration and local atomic structure of Cu atoms can be controlled by the calcination time at 250 °C toward an asymmetric paddle-wheel dimer. Therefore, QHKUST-1 was prepared through calcination of the HKUST-1 precursor in air at 250 °C for 1, 2, or 3 h (denoted as QHKUST-1-1, QHKUST-1-2 or MHKUST-1-3).
Moisture stability and catalytic properties of QHKUST-1
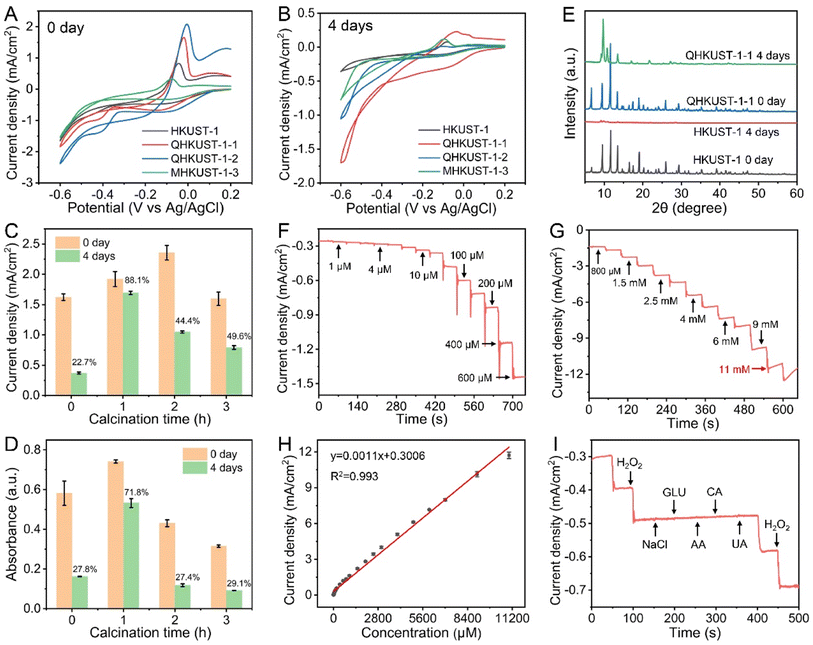
To demonstrate the impact of moisture stability on the catalytic activity, the electrocatalytic activity of HKUST-1 and QHKUST-1 was first investigated using cyclic voltammetry. As expected, QHKUST-1-2 exhibits the best electrocatalytic activity compared to the as-prepared HKUST-1, QHKUST-1-1 and MHKUST-1-3 (Fig. 5A). Then, the original HKUST-1 and calcined QHKUST-1 samples were exposed to water for 4 days. With water treatment for 4 days, QHKUST-1-1 possessed better electrocatalytic activity than the as-prepared HKUST-1, QHKUST-1-2 and MHKUST-1-3 (Fig. 5B). QHKUST-1-1 shows remarkable electrocatalytic activity with a high yield of >88% upon water treatment (Fig. 5C). As displayed in Fig. 5D and S17,† the UV absorbance intensity in the QHKUST-1-1–OPD–H2O2 system was much higher than that in the HKUST-1–OPD–H2O2 system or the QHKUST-1-2–H2O2–OPD system upon water treatment, revealing that QHKUST-1-1 had the highest peroxidase-like activity and enhanced water stability.To confirm the water stability of QHKUST-1-1, both the HKUST-1 and QHKUST-1 samples were exposed to water for 4 days. Because of the hydrophilicity behavior, the HKUST-1 and QHKUST-1-1 materials are uniformly distributed in the water solution. We can observe the white blue colour of the HKUST-1 water solution after 4 days of the hydrostability test (Fig. S18†). After water treatment for 4 days, we could not observe the XRD peaks of HKUST-1. Accordingly, the XRD pattern of QHKUST-1-1 exhibits sharp characteristic peaks indexed to the as-prepared HKUST-1, revealing the crystallinity retention of QHKUST-1-1 (Fig. 5E). The morphology of HKUST-1 and QHKUST-1-1 was further examined using SEM. After water treatment for 4 days, the octahedral morphology of HKUST-1 nearly disappeared (Fig. S19A and B†). Compared to HKUST-1, the octahedral morphology of QHKUST-1-1 was well preserved after water treatment under the same conditions (Fig. S19C and D†). QHKUST-1 becomes stabilized owing to the formation of asymmetric motifs by heat-treatment separation of adjacent phenyl tricarboxylate moieties. Therefore, QHKUST-1-1 was chosen as the best material among the QHKUST-1 samples and used for the subsequent experiments.
To reveal the interfacial behavior of the electrocatalysts and investigate the charge-transfer possibility, electrochemical impedance spectra (EIS) were recorded. As shown in Fig. S20,† Nyquist plots were performed to understand the reaction kinetics of the materials. Compared with HKUST-1, all calcined materials show an obvious reduction in the electro-transfer resistance, suggesting the good conductivity of the calcined HKUST-1 samples. The peroxidase-like activity of HKUST-1 and QHKUST-1 was further studied in the presence of OPD and H2O2 by using the Michaelis constant (Km) via nonlinear Hill function simulation. As shown in Fig. S21 and S22,† the Km of OPD in the QHKUST-1 system is 0.035 mM, which is lower than that of HKUST-1 (1.05 mM). These results showed that QHKUST-1 possesses higher peroxidase-like activity.
We further confirmed the electrocatalytic activity of HKUST-1 towards H2O2 reduction. Fig. S23A† shows the typical CVs of H2O2 reduction by QHKUST-1 in 10 mM PBS containing different H2O2 concentrations. We can observe a sharp increase in the reduction peak with increasing H2O2 concentration. Furthermore, when plotting the reduction current density as a function of the H2O2 concentration, a good linear relationship was obtained (Fig. S23B†), indicating that HKUST-1-1 exhibits effective electrocatalytic activity towards H2O2 reduction.
The H2O2 detection sensitivity of QHKUST-1 was examined through a current–time technique at a constant potential. The amperometric responses were observed on the successive additions of H2O2 at different potentials (from −0.4 V to −0.6 V) (Fig. S24†). The potential of −0.55 V can be selected as the optimum potential for H2O2 reduction. Fig. 5F and G show the electrochemical curves of the QHKUST-1–modified electrode with the successive addition of H2O2 into PBS solution at −0.55 V. The current density shows good linear dependence on the H2O2 concentration in the range of 1 μM to 11 mM, and a detection limit down to 0.3 μM at a signal-to-noise (S/N) ratio of 3 (Fig. 5H and S25†). The performance of the QHKUST-1-based H2O2 sensor was better than that of reported nanocomposite-based electrochemical sensors (Table S4†), revealing the great potential of QHKUST-1 as a new kind of electrochemical catalyst for H2O2 reduction.
Furthermore, we investigated the selectivity, stability, and reproducibility of the QHKUST-1-based sensors. As shown in Fig. 5I, we could not observe any interference signal for the detection of H2O2 upon the addition of potential interfering substances, such as NaCl, glucose (GLU), ascorbic acid (AA), citric acid (CA), and uric acid (UA), indicating the perfect selectivity of QHKUST-1 for H2O2 reduction. To investigate the electrode-to-electrode reproducibility, the current densities of seven different modified electrodes in PBS solution containing 3 mM H2O2 were recorded. The relative standard deviation (RSD) was 2.3%, indicating good reproducibility (Fig. S26†). Finally, we evaluated the long-term storage stability of QHKUST-1 by investigating the signal response (Fig. S27†). After five days, 96% of the original current response was still maintained, indicating the good stability of the QHKUST-1 materials.
Cellular H2O2 sensing and drug evaluation
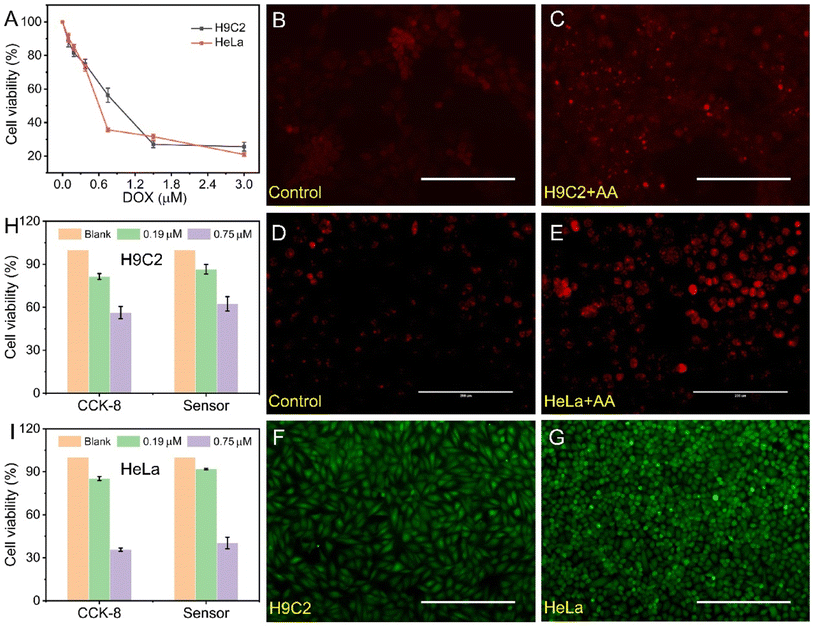
Real-time detection of H2O2 (ref. 44,45,46,47,48 or NO49,50 released from living cells is important for drug evaluation by using H2O2 or NO as biomarkers. In this work, a QHKUST-1-based electrochemical sensor was used for the in situ detection of extracellular H2O2 from cells to demonstrate the possibility of practical application. Herein, a cancer cell line (i.e., HeLa cells) and cardiac cell line (i.e., H9C2 cells) were chosen as model cells. Live cells can be activated to release H2O2 under the stimulation of ascorbic acid (AA).To evaluate the cytotoxicity of doxorubicin (DOX) in H9C2 cells and HeLa cells, cell counting kit-8 (CCK-8) and calcein-AM single staining methods were performed. As indicated in Fig. 6A, S28 and S29,† the cell number of live cells decreased as the DOX concentration increased, demonstrating that the cell cytotoxicity increased along with the DOX concentration. Then, dehydrogenate (DHE) staining was performed to detect cellular superoxide generation. As displayed in Fig. 6B–E, the DHE fluorescence images demonstrated that the cellular H2O2 levels of untreated HeLa cells and untreated H9C2 cells were much lower than those of the AA-treated HeLa cells and AA-treated H9C2 cells.
The cytotoxicity of the QHKUST-1-modified electrodes was proposed via CCK-8 and calcein-AM/propidium iodide (PI) double stain assays. When the concentration of QHKUST-1 was 60 μg mL−1, the H9C2 and HeLa cells still had a survival rate of approximately 95% (Fig. S30†). Cells were incubated on the QHKUST-1-modified electrode surface for 24 h, and the fluorescent images in Fig. 6F and G show the viable (green) cells dyed via the double stain assay. The results reveal that there are more than 99% living cells on the electrode surface, demonstrating that the QHKUST-1 materials have excellent biocompatibility.
The amount of H2O2 released from living cells is dependent on the cell number. Next, the sensor was used to determine H2O2 secreted from H9C2 and HeLa cells upon drug treatment. As shown in Fig. 6H and I, different electrochemical signals were observed after the addition of AA solution into HepG2 cells cultured with 0.19 and 0.75 μM DOX. Moreover, the cellular viability obtained from the electrochemical sensor (the ratio of the current value) is consistent with that from CCK-8 assay, demonstrating that the QHKUST-1-based electrochemical method may be a potential platform for drug evaluation.
Conclusions
In summary, a novel strategy was reported to optimize the electrocatalytic activity of QHKUST-1 by promoting undercoordinated Cu sites. By keeping the calcination temperature and varying the calcination time, we controlled the distortion of QHKUST-1 while maintaining the original HKUST-1 structure. Remarkably, QHKUST-1 calcined at 250 °C for 1 h maintains the perfect octahedral morphology of HKUST-1 while having more exposed active centers and exhibiting better electrical conductivity. Moreover, QHKUST-1 exhibits superior moisture stability and enhanced electrocatalytic activity compared to the original water-sensitive HKUST-1. QHKUST-1 was further explored in the detection of H2O2 from living cells for drug evaluation. This work suggests a new approach to explore enhanced MOF catalysts in electrocatalysis and electrochemical sensors.Author contributions
Duanping Sun: conceptualization, funding acquisition, investigation, project administration, software, supervision, writing – original draft, and writing – review & editing. Linxi Chen: data curation, formal analysis, software, and visualization. Lizhu Zeng: methodology, and software. Xianhua Shi: validation and software. Jing Lu: funding acquisition, resources, supervision, writing – original draft, and writing – review & editing.Conflicts of interest
The authors declare no competing financial interests.Acknowledgements
This work was supported by the National Natural Science Foundation of China (82003710 and 82173808), the Natural Science Foundation of Guangdong Province (2020A1515010075 and 2021B1515020100), the Project of Educational Commission of Guangdong Province (2021ZDZX2012), the Guangzhou Basic and Applied Basic Research Project (202102020173), the National Key Clinical Specialty Construction Project (Clinical Pharmacy), and High-Level Clinical Key Specialty (Clinical Pharmacy) in Guangdong Province.References
- H. Furukawa, K. E. Cordova, M. O'Keeffe and O. M. Yaghi, Science, 2013, 341, 1230444 CrossRef PubMed.
- M. T. Zhao, K. Yuan, Y. Wang, G. D. Li, J. Guo, L. Gu, W. P. Hu, H. J. Zhao and Z. Y. Tang, Nature, 2016, 539, 76–80 CrossRef CAS PubMed.
- Q. L. Zhu and Q. Xu, Chem. Soc. Rev., 2014, 43, 5468–5512 RSC.
- M. Safaei, M. M. Foroughi, N. Ebrahimpoor, S. Jahani, A. Omidi and M. Khatami, TrAC, Trends Anal. Chem., 2019, 118, 401–425 CrossRef CAS.
- L. Jiao, J. Y. R. Seow, W. S. Skinner, Z. U. Wang and H. L. Jiang, Mater. Today, 2019, 27, 43–68 CrossRef CAS.
- S. A. Patil, S. Cho, Y. Jo, N. K. Shrestha, H. Kim and H. Im, Chem. Eng. J., 2021, 426, 130773 CrossRef CAS.
- S. A. Patil, N. K. Shrestha, A. I. Inamdar, C. Bathula, J. Jung, S. Hussain, G. Nazir, M. Kaseem, H. Im and H. Kim, Nanomaterials, 2022, 12, 1916 CrossRef CAS PubMed.
- N. K. Shrestha, S. A. Patil, S. Cho, Y. Jo, H. Kim and H. Im, J. Mater. Chem. A, 2020, 8, 24408–24418 RSC.
- M. Woellner, S. Hausdorf, N. Klein, P. Mueller, M. W. Smith and S. Kaskel, Adv. Mater., 2018, 30, 1704679 CrossRef PubMed.
- H. Li, L. B. Li, R. B. Lin, W. Zhou, Z. J. Zhang, S. C. Xiang and B. L. Chen, EnergyChem, 2019, 1, 100006 CrossRef.
- S. Kempahanumakkagari, K. Vellingiri, A. Deep, E. E. Kwon, N. Bolan and K. H. Kim, Coord. Chem. Rev., 2018, 357, 105–129 CrossRef CAS.
- Y. X. Xu, Q. Li, H. G. Xue and H. Pang, Coord. Chem. Rev., 2018, 376, 292–318 CrossRef CAS.
- L. T. Liu, Y. L. Zhou, S. Liu and M. T. Xu, ChemElectroChem, 2018, 5, 6–19 CrossRef CAS.
- C. S. Liu, J. J. Li and H. Pang, Coord. Chem. Rev., 2020, 410, 213222 CrossRef CAS.
- S. Y. Liu, C. Lai, X. G. Liu, B. S. Li, C. Zhang, L. Qin, D. L. Huang, H. Yi, M. M. Zhang, L. Li, W. J. Wang, X. R. Zhou and L. Chen, Coord. Chem. Rev., 2020, 424, 213520 CrossRef CAS.
- Y. Q. Xue, S. S. Zheng, H. G. Xue and H. Pang, J. Mater. Chem. A, 2019, 7, 7301–7327 RSC.
- J. Yang and Y. W. Yang, Small, 2020, 16, 1906846 CrossRef CAS PubMed.
- L. Jiao, H. Y. Yan, Y. Wu, W. L. Gu, C. Z. Zhu, D. Du and Y. H. Lin, Angew. Chem., Int. Ed., 2020, 59, 2565–2576 CrossRef CAS PubMed.
- D. D. Wang, D. L. Jana and Y. L. Zhao, Acc. Chem. Res., 2020, 53, 1389–1400 CrossRef CAS PubMed.
- S. Y. Chen, J. Lu, T. H. You and D. P. Sun, Coord. Chem. Rev., 2021, 439, 213929 CrossRef CAS.
- S. Q. Li, X. D. Liu, H. X. Chai and Y. M. Huang, TrAC, Trends Anal. Chem., 2018, 105, 391–403 CrossRef CAS.
- X. L. Zhang, G. L. Li, D. Wu, X. L. Li, N. Hu, J. Chen, G. Chen and Y. N. Wu, Biosens. Bioelectron., 2019, 137, 178–198 CrossRef CAS PubMed.
- L. Y. Chen, N. Tsumori and Q. Xu, Sci. China Chem., 2020, 63, 1601–1607 CrossRef CAS.
- M. L. Ding and H. L. Jiang, CCS Chem., 2020, 2, 2740–2748 Search PubMed.
- S. Dang, Q. L. Zhu and Q. Xu, Nat. Rev. Mater., 2018, 3, 17075 CrossRef CAS.
- L. Y. Chen, H. F. Wang, C. X. Li and Q. Xu, Chem. Sci., 2020, 11, 5369–5403 RSC.
- X. H. Niu, X. Li, Z. Y. Lyu, J. M. Pan, S. C. Ding, X. F. Ruan, W. L. Zhu, D. Du and Y. H. Lin, Chem. Commun., 2020, 56, 11338–11353 RSC.
- X. T. Pan, L. X. Bai, H. Wang, Q. Y. Wu, H. Y. Wang, S. Liu, B. L. Xu, X. H. Shi and H. Y. Liu, Adv. Mater., 2018, 30, 1800180 CrossRef PubMed.
- R. B. Wu, X. K. Qian, F. Yu, H. Liu, K. Zhou, J. Wei and Y. Z. Huang, J. Mater. Chem. A, 2013, 1, 11126–11129 RSC.
- D. H. Nam, O. S. Bushuyev, J. Li, P. De Luna, A. Seifitokaldani, C. T. Dinh, F. P. G. de Arquer, Y. H. Wang, Z. Q. Liang, A. H. Proppe, C. S. Tan, P. Todorovic, O. Shekhah, C. M. Gabardo, J. W. Jo, J. M. Choi, M. J. Choi, S. W. Baek, J. Kim, D. Sinton, S. O. Kelley, M. Eddaoudi and E. H. Sargent, J. Am. Chem. Soc., 2018, 140, 11378–11386 CrossRef CAS.
- J. K. Sun and Q. Xu, Energy Environ. Sci., 2014, 7, 2071–2100 RSC.
- B. L. Xu, H. Wang, W. W. Wang, L. Z. Gao, S. S. Li, X. T. Pan, H. Y. Wang, H. L. Yang, X. Q. Meng, Q. W. Wu, L. R. Zheng, S. M. Chen, X. H. Shi, K. L. Fan, X. Y. Yan and H. Y. Liu, Angew. Chem., Int. Ed., 2019, 58, 4911–4916 CrossRef CAS PubMed.
- N. Tsumori, L. Y. Chen, Q. J. Wang, Q. L. Zhu, M. Kitta and Q. Xu, Chem, 2018, 4, 845–856 CAS.
- B. Liu, W. F. Han, X. L. Li, L. C. Li, H. D. Tang, C. S. Lu, Y. Li and X. N. Li, Appl. Catal., B, 2019, 257, 117939 CrossRef CAS.
- Y. Cheng, X. Xiao, X. W. Guo, H. Yao and H. Pang, ACS Sustainable Chem. Eng., 2020, 8, 8675–8680 CrossRef CAS.
- R. M. Zhu, J. W. Ding, J. P. Yang, H. Pang, Q. Xu, D. L. Zhang and P. Braunstein, ACS Appl. Mater. Interfaces, 2020, 12, 25037–25041 CrossRef CAS PubMed.
- M. Bagheri, A. Melillo, B. Ferrer, M. Y. Masoomi and H. Garcia, ACS Appl. Mater. Interfaces, 2022, 14, 978–989 CrossRef CAS PubMed.
- L. L. Fan, F. G. Zhao, Z. L. Huang, B. Chen, S. F. Zhou and G. W. Zhan, Appl. Catal., A, 2019, 572, 34–43 CrossRef CAS.
- M. Lu, H. Hou, C. Y. Wei, X. H. Guan, W. Wei and G. S. Wang, Catalysts, 2020, 10, 140 CrossRef CAS.
- Y. Shen, L. W. Bao, F. Z. Sun and T. L. Hu, Mater. Chem. Front., 2019, 3, 2363–2373 RSC.
- G. S. Chen, S. M. Huang, X. X. Kou, S. B. Wei, S. Y. Huang, S. Q. Jiang, J. Shen, F. Zhu and G. F. Ouyang, Angew. Chem., Int. Ed., 2019, 58, 1463–1467 CrossRef CAS PubMed.
- G. S. Chen, S. M. Huang, X. X. Kou, F. Zhu and G. F. Ouyang, Angew. Chem., Int. Ed., 2020, 59, 13947–13954 CrossRef CAS PubMed.
- G. S. Chen, X. X. Kou, S. M. Huang, L. J. Tong, Y. J. Shen, W. S. Zhu, F. Zhu and G. F. Ouyang, Angew. Chem., Int. Ed., 2020, 59, 2867–2874 CrossRef CAS PubMed.
- D. P. Sun, D. C. Yang, P. Wei, B. Liu, Z. G. Chen, L. Y. Zhang and J. Lu, ACS Appl. Mater. Interfaces, 2020, 12, 41960–41968 CrossRef CAS PubMed.
- Y. Z. Ling, Q. X. Lyu, Q. F. Zhai, B. W. Zhu, S. Gong, T. Zhang, J. Dyson and W. L. Cheng, ACS Sens., 2020, 5, 3165–3171 CrossRef CAS PubMed.
- Q. Lyu, Q. F. Zhai, J. Dyson, S. Gong, Y. M. Zhao, Y. Z. Ling, R. Chandrasekaran, D. S. Dong and W. L. Cheng, Anal. Chem., 2019, 91, 13521–13527 CrossRef CAS PubMed.
- X. Zhao, K. Q. Wang, B. Li, C. Wang, Y. Q. Ding, C. Q. Li, L. Q. Mao and Y. Q. Lin, Anal. Chem., 2018, 90, 7158–7163 CrossRef CAS PubMed.
- W. Ling, G. Liew, Y. Li, Y. F. Hao, H. Z. Pan, H. J. Wang, B. A. Ning, H. Xu and X. Huang, Adv. Mater., 2018, 30, 1800917 CrossRef PubMed.
- R. F. Li, H. Qi, Y. Ma, Y. P. Deng, S. N. Liu, Y. S. Jie, J. Z. Jing, J. L. He, X. Zhang, L. Wheatley, C. X. Huang, X. Sheng, M. L. Zhang and L. Yin, Nat. Commun., 2020, 11, 3207 CrossRef CAS PubMed.
- M. Zhou, Y. Jiang, G. Wang, W. J. Wu, W. X. Chen, P. Yu, Y. Q. Lin, J. J. Mao and L. Q. Mao, Nat. Commun., 2020, 11, 3188 CrossRef CAS PubMed.
Footnote |
| † Electronic supplementary information (ESI) available. See DOI: https://doi.org/10.1039/d2ta05833b |
| This journal is © The Royal Society of Chemistry 2023 |

