Effects of side reactions on the kinetics of nanoporous gold formation revealed by real-time X-ray scattering during electrolytic dealloying†
Samuel S.
Welborn
 ab,
John S.
Corsi
 ab,
Lin
Wang
 a,
Asaph
Lee
ac,
Jintao
Fu
 a and
Eric
Detsi
 *ab
*ab
aDepartment of Materials Science & Engineering, University of Pennsylvania, Philadelphia, PA 19104-6272, USA. E-mail: detsi@seas.upenn.edu
bVagelos Institute for Energy Science and Technology (VIEST), Philadelphia, PA 19104, USA
cDepartment of Physics and Astronomy, University of Pennsylvania, Philadelphia, Pennsylvania 19104, USA
First published on 30th July 2021
Abstract
Nanoporous gold (NP-Au) is used in various energy applications. However, little attention has been paid to the nature of surface films which can grow via side reactions during the formation of NP-Au by selective leaching. These films could significantly impact both the kinetics of NP-Au formation by selective leaching, and the performance of this NP-Au in specific energy applications. While it has been reported that complete removal of Ag from a Au–Ag parent alloy by selective leaching is kinetically more sluggish in HClO4 than in HNO3, and that the resulting structure size of NP-Au is smaller when formed in HClO4 compared to HNO3, these findings were not attributed to the growth of surface film via side reactions during selective leaching. In this work, small-angle and wide-angle X-ray scattering (SAXS and WAXS) are used in real time during NP-Au formation by selective electrolytic leaching of Ag from a Au–Ag parent alloy in 1 M HClO4 and 1 M HNO3 to demonstrate that the sluggish dealloying behavior in HClO4 results from the growth of a surface film during dealloying. In HClO4, Ag+ ions released from the Au–Ag working electrode spontaneously react with Cl− ions released from ClO4− reduction at the counter electrode to form an insoluble AgCl passive film on NP-Au. The AgCl hinders Ag dissolution and surface diffusion of Au atoms, slowing down the reaction kinetics and the rate of ligament growth. Our findings shed light on dealloying reaction mechanisms and will contribute to better control of the morphology and surface chemical state of nanoporous metals for energy applications.
Introduction
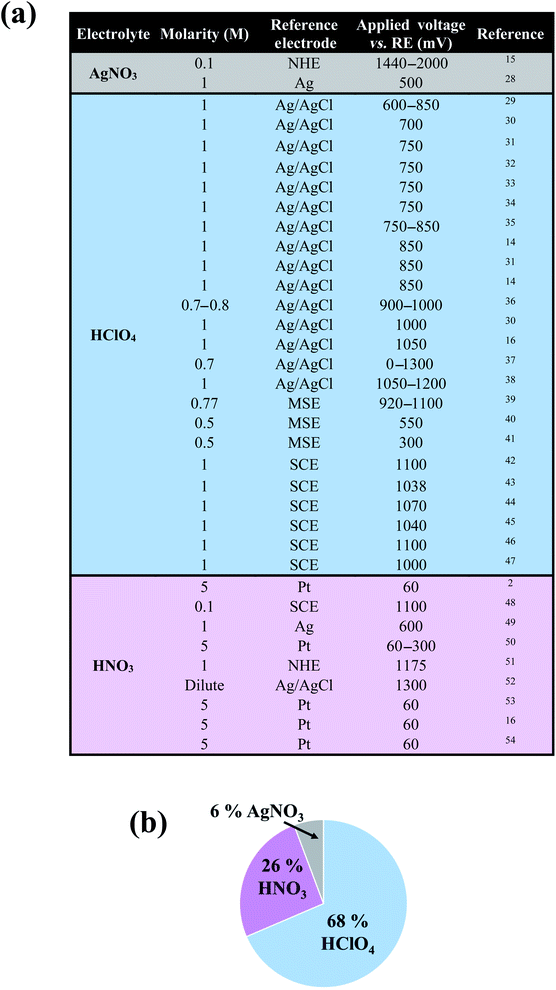
In the past decades, nanoporous metals have been the subject of intense research, partly owing to their wide range of potential energy applications as heterogeneous (electro)catalysts,1–3 battery electrodes,4,5 supercapacitors,6,7 3D current collectors,8 3D nanocapacitors,9 and plasmonic materials.10–12 Nanoporous metals are typically created by selectively removing a sacrificial element from a parent alloy using a variety of methods including free corrosion dealloying,13 electrolytic dealloying,14–16 liquid metal dealloying,17 vapor phase dealloying,18,19 galvanic replacement,20 reduction-induced decomposition,21,22 and thermal decomposition.18,23 Nanoporous gold (NP-Au), made by selectively etching Ag from a Au–Ag parent alloy using free corrosion13 or electrolytic14,15 dealloying, is the most commonly studied nanoporous metal system. Despite its success in various energy applications, however, the effects of side reactions on both the kinetics of NP-Au formation by electrolytic dealloying, and its resulting morphology are not well-understood.14,15,24 It is well-established that during electrochemical processes the electrolyte and the electrode may undergo irreversible decompositions through side reactions, which can result in the deposition of solid products in the form of a surface film with thickness ranging from a few molecular layers up to a few nanometers at the electrode/electrolyte interface.25,26 While many efforts under the umbrella of battery research focus on understanding and controlling these surface films to prevent material loss and stabilize the electrode material (i.e. the solid electrolyte interphase—SEI—layer in lithium-ion and sodium-ion batteries),25,26 less attention has been paid to the impact of passive surface films on aqueous electrochemical systems outside of the battery community. For instance, in the case of nanoporous metal formation by dealloying, only a handful of works by Weissmüller and co-workers,14 de Hosson and co-workers,24 and Erlebacher and co-workers15 suggest the formation of a solid passive film on the ligaments of NP-Au during dealloying. Understanding the nature of such a passive film, and the conditions under which this film forms during electrolytic dealloying, is critical to determining its impact on both dealloying kinetics and the properties/performance of as-synthesized NP-Au in energy applications. For example, a passive surface film created on NP-Au during dealloying may affect its porosity development mechanism by cutting off pathways for surface diffusion, thereby limiting ligament coarsening, and ultimately resulting in a smaller structure size.27 When tested for its catalytic activity after dealloying, for example, the performance of this surface passivated NP-Au could yield different results compared to pure, non-passivated NP-Au. Considering that the formation of such a passive surface film directly depends on the nature of the electrolyte and the electrode used in an electrochemical process, to better serve the nanoporous metals community we performed a broad literature search to identify the type of electrolytes widely used in the field to fabricate NP-Au from Au–Ag alloys. As shown in the table and corresponding pie chart in Fig. 1, we found that perchloric acid (HClO4) and nitric acid (HNO3) are the most used electrolytes for electrolytic dealloying. Interestingly, Weissmüller and co-workers carried out a comparative study on electrolytic dealloying of NP-Au in HClO4versus HNO3, and reported the following key findings (among others):16 (i) the complete removal of Ag from the Au–Ag parent alloy is slower in HClO4 compared to HNO3; (ii) the coarsening of the ligament/pore structures during dealloying is more severe in HNO3 than in HClO4. In the present study, we hypothesized that the phenomena in (i) and (ii) are associated with the nature of the passive surface film formed with respect to the electrolyte. Thus, this article describes novel fundamental research aimed at identifying and understanding the conditions under which a passive surface film arises via side reactions during NP-Au formation by electrolytic dealloying in HClO4, the most used electrolyte for selective electrolytic leaching of Au–Ag alloys. In this work, we aim to shed light on passive surface films, which could drastically impact the performance of NP-Au in its various energy applications.Experimental
In situ dealloying
We used a custom Kapton pouch cell containing three electrodes and 2 mL of electrolyte to dealloy the parent Au–Ag alloy. A 5 μm-thick Au–Ag parent alloy (Custom Order, Imtradex Corp.) with composition Au35Ag65 (at%) was used as the working electrode, an Ag/AgCl in 1 M KCl was used as the reference electrode, and Pt foil was used as the counter electrode. The masses of the parent alloys for HClO4 dealloying and HNO3 dealloying were 7.2 mg and 5.2 mg, respectively. The pouch cell was mounted to a sample stage in the environmental chamber at the Dual-Source and Environmental X-ray Scattering Facility at Penn and filled with either 1 M HClO4 or 1 M HNO3, depending on the experiment. The environmental chamber was left at atmospheric pressure to avoid electrolyte evaporation. A BioLogic VMP-300 potentiostat was used to apply an oxidizing potential of 950 mV between the Au–Ag parent alloy and the Ag/AgCl reference electrode. The microstructural and crystallographic evolution was probed by aiming the Cu Kα beam at the Au–Ag parent alloy and detecting the scattered waves as Ag was oxidized. Microstructural data was gathered on a small-angle 1 M pixel Pilatus detector down an evacuated flight path, and crystallographic data was gathered on a 100 K pixel Pilatus wide-angle detector in the environmental chamber nearby the sample. Each acquisition was 180 seconds. After dealloying, the sample was washed in DI water several times to remove residual electrolyte and dried in air. We used 17 M liquid ammonia in water to remove AgCl from the HClO4-dealloyed sample.SAXS fitting
Each SAXS dataset was fit using the Teubner–Strey model, which captures the characteristic spacing d in bicontinuous materials.55,56Ex situ dealloying
Samples were dealloyed in the same electrolyte concentration (1 M HNO3 and 1 M HClO4) and at the same potential (950 mV) as the in situ experiments discussed above, this time with 10× volume of electrolyte (20 mL). The Hg/Hg2SO4 (in K2SO4, sat.) control experiment was performed in 2 mL of 1 M HClO4 at potential of 530 mV under nitrogen purge to suppress the oxygen reduction reaction (ORR, see eqn (4) under Elucidation of the reaction mechanisms).Characterization
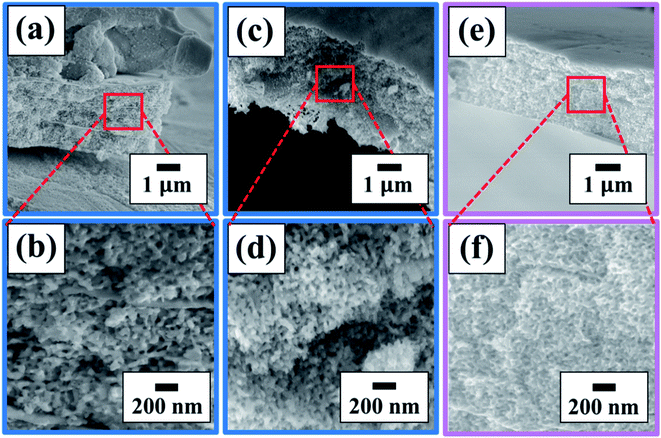
Scanning electron microscopy (SEM, JEOL 7500F) and energy dispersive X-ray spectroscopy (EDX, EDAX Octane Elect Super) were used to investigate the microstructure and elemental composition of the in situ dealloyed samples. Ex situ XRD patterns were collected using a Rigaku MiniFlex powder diffractometer with Cu Kα radiation. X-ray photoelectron spectroscopy (XPS) analysis was performed using PHI Versa Probe I instrument using a 200 μm 50 W beam for acquisition. A pass energy (PE) of 23 eV for high resolution spectra windows, and PE of 117 eV was used for the survey analysis. Dual source (electron and ion gun) charge compensation was used during analysis to compensate for the shifts in the BE of the spectra. The adventitious C 1s C–C peak at 285.0 eV was used to calibrate binding energy positions.Results and discussion
(1) Overview
As mentioned in the Introduction, during dealloying, the formation of a passive film at the electrode/electrolyte interface can impact the kinetics of the dealloying process and the morphology (e.g., microstructural size and crystal structure) of the dealloyed material. The nature of this passive film directly depends on both the electrolyte and the electrode, and HClO4 and HNO3 are the most widely used electrolytes during electrolytic dealloying of Au–Ag parent alloys based on our broad literature survey in Fig. 1. In the case of HClO4, we hypothesized that the Au–Ag parent alloy and the HClO4 electrolyte may decompose and form insoluble compounds (e.g., silver chloride—AgCl), which may deposit on the surface of the NP-Au as a passive film and hinder the dealloying rate. In the case of HNO3, the Au–Ag parent alloy and the HNO3 electrolyte may also decompose, but form products that are soluble in acid or form a non-blocking film (e.g., silver nitrate – AgNO3, or non-dense silver oxides – AgOx), which may not hinder the dealloying process in acids. To test our hypothesis, in the second part of the Results and discussion section, we probe the evolution of the characteristic microstructural size (using SAXS) and crystallography (using WAXS) simultaneously during electrolytic dealloying in 1 M HClO4 and 1 M HNO3. This is, to the best of our knowledge, the first time SAXS and WAXS have been used simultaneously to characterize the electrolytic dealloying of Au–Ag. In the third part of the Results and discussion section, we use new insights gained from the SAXS and WAXS data to elucidate the electrochemical reaction mechanisms occurring during NP-Au formation by electrolytic dealloying in HClO4 and HNO3, and the effects of the electrolyte on the dealloying process. In the fourth part of the Results and discussion section we elucidate the mechanism through which AgCl forms. We also propose a mechanism for Ag and Au mobility (i.e., Ag atom dissolution and surface diffusion of Au atoms) during electrolytic dealloying in the presence of a passive AgCl film, building on a recent model proposed by Snyder et al. on electrolytic dealloying in neutral pH in the presence of a passive silver oxide film.15 Finally, in the fifth and last part of the Results and discussion section, we clarify how the presence of a passive AgCl film can impact the performance of nanoporous gold in specific energy applications.(2) Small- and wide-angle X-ray scattering (SAXS and WAXS)
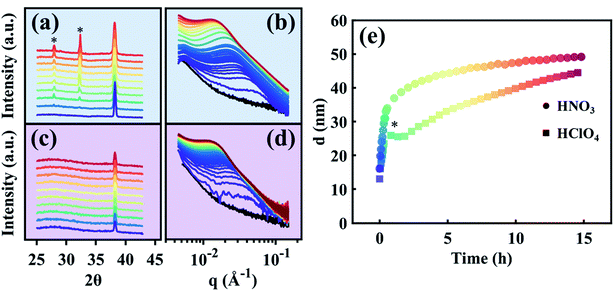
The in situ electrolytic dealloying data obtained are shown in Fig. 2 with background colors corresponding to the electrolyte: blue for HClO4, and purple for HNO3 (similar background colors are also used in Fig. 3–6, and S3–S8†). The current vs. time plots in Fig. 2a and b represent the typical electrolytic dealloying currents measured between the Au35Ag65 working electrode and the Pt counter electrode when a constant voltage of 950 mV is applied between the working and the Ag/AgCl reference electrode in 1 M HClO4 electrolyte (Fig. 2a) and 1 M HNO3 electrolyte (Fig. 2b). In Fig. 2a, there is a fluctuation in current around the end of the first hour of dealloying, which has been known to occur during electrolytic dealloying experiments when the dissolution of the sacrificial element (in our case Ag) does not occur uniformly. Typically, during dealloying, if the Ag dissolution front at the bulk electrode/electrolyte interface propagates uniformly (i.e., layer-by-layer) inside the material, the dealloying current measured across the cell (i.e., the Ag dissolution current) will be constant without fluctuation. In practice, however, Ag dissolution does not occur layer-by-layer: in addition to Ag removed from the bulk electrode/electrolyte interface, the electrolyte can also penetrate into the bulk of the material through cracks and grain boundaries to remove more Ag. This will cause the dealloying current to suddenly increase/fluctuate as shown Fig. 2a. Similar fluctuations have been observed in our previous work on electrolytic dealloying.57 The corresponding plots of the cumulative charge as a function of time, associated with the amount of Ag removed during the dealloying process, are shown in Fig. 2c and d for HClO4 and HNO3, respectively. Note that in our pouch cell configuration, the AuAg parent alloy is partially submerged into solution, and a portion of the AuAg alloy remains outside of the electrolyte to connect with the lead wire (see Fig. S2†). The magnitude of current in Fig. 2a and b is therefore associated with the active mass. We should emphasize that a difference in current magnitude does not impact our SAXS and WAXS results below as the same oxidizing potential was used (950 mV vs. Ag/AgCl) and porosity development was observed in both cases.
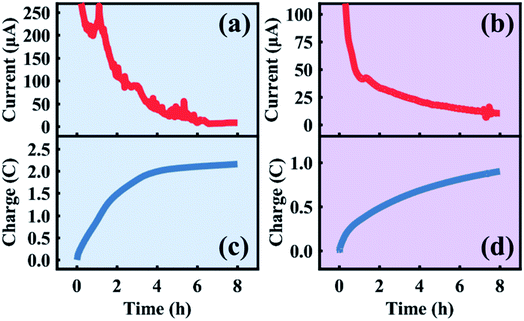 | ||
| Fig. 2 Current and charge transferred during the first eight hours of the in situ sample dealloyed in HClO4 (a and c) and HNO3 (b and d). | ||
Time-resolved SAXS and WAXS collected in situ during Ag removal from the Au35Ag65 parent alloy are shown in Fig. 3a and b for HClO4 and Fig. 3c and d for HNO3. Time in these datasets is indicated by color, beginning in purple and ending in red. The black curve in Fig. 3b and d is the pattern of the starting Au35Ag65 parent alloy. Fig. 3e shows the average ligament–ligament distance, d, for the sample dealloyed in HClO4 (squares) and in HNO3 (circles) deduced from the SAXS data from Fig. 3b and d.55,56 Note that in Fig. 3e, the bump marked by an asterisk for the sample dealloyed in HClO4 is an experimental artifact as it has not been observed in other d versus time curves as shown in Fig. S4 in the ESI.†
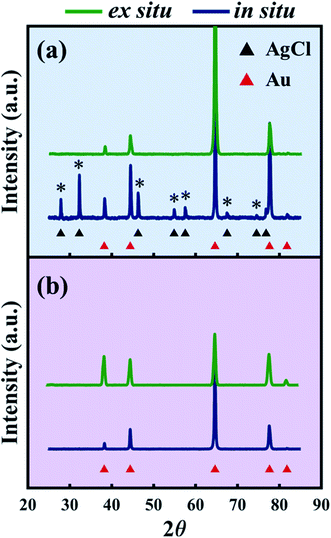
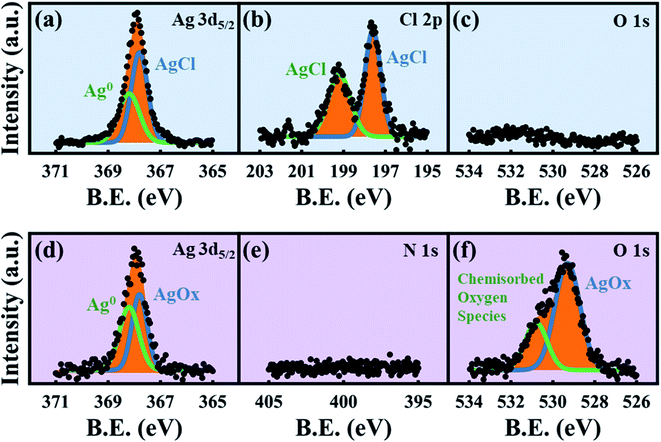
While previous reports have used XPS to analyze the surface states of dealloyed NP-Au, these studies focus mostly on elemental Ag, Au, and O,38,61,62 and not on the electrolyte species. XPS surveys of the surface of the HClO4- and HNO3-dealloyed NP-Au samples are provided in Fig. S7 in the ESI.† The corresponding high-resolution scans associated with Ag 3d5/2, Cl 2p, and O 1s are shown in Fig. 6a–c for the HClO4-dealloyed NP-Au. Similarly, the high-resolution scans associated with Ag 3d5/2, N 1s, and O 1s are shown in Fig. 6d–f for the HNO3-dealloyed NP-Au. Starting with the high resolution Ag 3d5/2 spectra, the deconvoluted peaks for the HClO4-dealloyed NP-Au in Fig. 6a indicate the presence of metallic silver (Ag0) and AgCl as illustrated by the Ag 3d5/2 peaks at 368.2 eV (green curve) and 367.8 eV (blue curve) associated with the binding energies of Ag0 and Ag+, respectively.63 The deconvoluted peaks for the HNO3-dealloyed NP-Au in Fig. 6d also indicate the presence of Ag0 and oxidized silver species (AgOx) as illustrated by the Ag 3d5/2 peaks at 368.2 eV (green curve) and 367.8 eV (blue curve) associated with the binding energies of Ag0 and Ag+, respectively.63 This AgOx can form during dealloying (including residual Ag2O, which is known to dissolve in acids). Next, to further support the presence of AgCl and AgOx, we analyzed the high-resolution scans associated with electrolyte elements, namely Cl 2p and O 1s for the HClO4-dealloyed NP-Au, and N 1s and O 1s for the HNO3-dealloyed NP-Au. For the HClO4-dealloyed NP-Au, Fig. 6b shows two peaks in the Cl 2p scan around 197.6 eV and 199.2 eV, which match well with the binding energies of Cl 2p3/2 and Cl 2p1/2,64,65 and can be attributed to AgCl. Further, the lack of a peak in the O 1s spectrum in Fig. 6c rules out any possibility that there is unwashed HClO4 electrolyte on the sample. Thus, it can safely be concluded that even though AgCl could not be detected by XRD on NP-Au samples dealloyed ex situ using a relatively large volume of HClO4 (green line, Fig. 4a), XPS data clearly suggest that AgCl is present on the surface of these NP-Au samples. For the HNO3-dealloyed NP-Au sample, there is no peak in N 1s region in Fig. 6e, which is expected as nitrogen-containing species such as AgNO3 are very soluble in acids. However, there is an oxygen signal (O 1s spectrum) in Fig. 6f, which can be deconvoluted into a broad peak around 529.3 eV (blue curve) ascribed to AgOx, and a smaller peak at 530.8 eV (green curve), which is ascribed to chemisorbed oxygen.63 Because AgCl is insoluble in most acids, the AgCl film formed during dealloying in HClO4 remains on the surface of NP-Au during dealloying. This will hinder the rate of sacrificial Ag dissolution and surface diffusion of Au atoms and thus slow down the kinetics of the dealloying process and the rate of ligament growth/coarsening. Indeed, Snyder et al. reported that passive silver oxide films can form during electrolytic dealloying in a neutral pH electrolyte (AgNO3), and proposed a mechanism for the hindrance Au and Ag mobility in their system.15 We will return to this mechanism later in this article, and build on its insight for the present results on HClO4. In contrast to HClO4, since AgOx compounds formed during dealloying in HNO3 are soluble in acids, the rate of sacrificial Ag dissolution and the surface diffusion of Au atoms are less hindered during dealloying, and thus the kinetics of the dealloying process and the rate of ligament growth/coarsening are not hampered. The O 1s signal in Fig. 6f indicates that some of the AgOx formed has been trapped on the pore walls during the dealloying. In order to form the passive AgCl film, there must be a source of Cl− ions to react with the Ag+ ions oxidized at the Au–Ag working electrode. The possibility of Cl− originating from the Ag/AgCl reference electrode was ruled out by performing control experiments using a mercury/mercurous sulfate (Hg/Hg2SO4) reference electrode, which does not contain Cl−. In other words, in our control experiments the only source of Cl− ions is the HClO4 electrolyte. Interestingly, XRD still shows that AgCl is present on the NP-Au after dealloying as shown in Fig. S8 in the ESI.†
(3) Elucidation of the reaction mechanisms
In this section, we elucidate the reaction mechanisms through which Cl− and AgCl form during electrolytic dealloying in HClO4, as well as the reaction mechanisms associated with free corrosion and electrolytic dealloying in HNO3.| Au (s) → Au3+ (aq.) + 3e− (EO = +1.50 V vs. SHE) | (1) |
| Ag (s) → Ag+ (aq.) + e− (EO = +0.80 V vs. SHE) | (2) |
Typically, in order to oxidize Ag and leave Au behind un-oxidized to create NP-Au by electrolytic dealloying, the magnitude of the voltage applied must be greater than 0.79 V vs. SHE but less than 1.52 V vs. SHE. In all of the electrolytic dealloying experiments in HClO4 and HNO3 done in the present work, the applied voltage sat between these potentials at 0.95 V vs. Ag/AgCl, which corresponds to 1.17 V vs. SHE.66
Next, we discuss the reduction half-reaction associated with free corrosion and electrolytic dealloying. In free corrosion dealloying (i.e. etching away Ag in concentrated HNO3 without using an external bias), the counter reaction to eqn (2) is the reduction of nitrate ions, which occurs spontaneously through eqn (3) and provides sufficient potential to oxidize Ag:66,67
| NO3− (aq.) + 3H+ (aq.) + 2e− → HNO2 (l) + H2O (l) (ER = +0.93 V vs. SHE) | (3) |
In practice, for free corrosion dealloying to occur, highly concentrated HNO3 is necessary to overcome the high reaction overpotentials by increasing the potential of the reduction half-reaction in eqn (3).67 For example, the potential of eqn (3) is increased from 0.93 V to 1.07 V vs. SHE if the concentration of HNO3 is increased from 1 M to 15 M. In other words, for the present work, Ag removal from Au–Ag by free corrosion in 1 M HNO3 through eqn (2) in combination with eqn (3) is not kinetically favorable. Instead, a bias voltage is used to electrolytically dissolve Ag through eqn (2) in combination with an appropriate reduction half-reaction. This reduction reaction takes place at the Pt counter electrode during electrolytic dealloying. To our knowledge, the nature of the counter half-reaction has not been reported and needs to be identified. For electrolytic dealloying in HClO4 we identify three candidates for reduction at the Pt counter electrode. The first is O2, which in acidic solution can be reduced in the ORR in eqn (4):
| O2 (g) + 4H+ (aq.) + 4e− → 2H2O (l) (ER = +1.23 V vs. SHE) | (4) |
The second is ClO4−, which can decompose into Cl− ions through eqn (5):68
| ClO4− (aq.) + 8H+ (aq.) + 8e− → Cl− (aq.) + 4H2O (l) (ER = +1.29 V vs. SHE) | (5) |
And finally, Ag plating is possible based on eqn (6):
| Ag+ (aq.) + e− → Ag (s), (ER = +0.80 V vs. SHE) | (6) |
Thermodynamically, when there are many possible reduction half-reactions, the one with the highest reduction potential proceeds first (i.e., the ClO4− reduction reaction in eqn (5)). However, if the reaction kinetics are sluggish, a reduction half-reaction with lower reduction potentials may proceed first. Out of the three possible counter reactions in eqn (4)–(6), the kinetics of the Ag+ deposition onto the counter electrode through eqn (6) is expected to be very favorable, but this reaction cannot occur before Ag+ ions are sufficiently present in solution. Thus, the only possible reactions in the early stages of dealloying are ORR (eqn (4)) and ClO4− reduction (eqn (5)). In practice, eqn (4) and (5) are kinetically sluggish but Pt catalyzes both of these reactions and thereby reduces their overpotentials.68,69 It is well-known in the electrocatalysis community that for the ORR reaction in eqn (4) to proceed continuously, the electrolyte to should be saturated with O2 gas, which is not the case during our electrolytic dealloying process. Therefore, we point to the reaction in eqn (5) as the main counter half-reaction during electrolytic dealloying in HClO4 in combination with eqn (2). At a later stage of the dealloying process (when the concentration of Ag+ in the electrolyte is high enough), the half-reaction in eqn (6) may proceed. This can be confirmed by the presence of metallic Ag on the Pt counter electrode.
| Ag+ + Cl− → AgCl (s) (ΔG = −55.7 kJ mol−1) | (7) |
This AgCl (s) product is insoluble in water,60 and thus remains on NP-Au. On the other hand, the counter reactions in HNO3 do not form products that can react with Ag+ to form a blocking film on the surface. In addition to ORR (eqn (4)) and Ag plating (eqn (6)), NO3− can be reduced to HNO2 (l) in eqn (3), and gaseous products including NO2 (g) and NO (g).66 Ag+ ions neither react with the electrolyte ions (NO3−), nor the reaction products in eqn (3), to form an insoluble blocking film, as evidenced by a lack of N species in our XPS data in Fig. 6e.
(4) Proposed mechanism of Au and Ag mobility in the presence of a passivating AgCl film
Based on the early understanding of the porosity evolution mechanism during dealloying,13 during selective leaching of a Au–Ag parent alloy, sacrificial Ag atoms dissolve in the electrolyte while Au atoms remaining at the electrode/electrolyte interface diffuse about to form Au clusters, which further grow into coarsened ligaments (i.e. post-dealloying coarsening). This mechanism, however, assumes a “clean” electrode/electrolyte interface that only comes into contact with the electrolyte and does not contain a passivating surface film. The presence of a passivating AgCl surface film at the electrode/electrolyte interface as reported in our work will hinder the mobility of Ag and Au atoms. The first model of the porosity evolution mechanism during dealloying that takes into account a passivating film was reported by Snyder et al.15 Their study involved creating nanoporous Au by electrolytic removal of Ag from a Au–Ag parent alloy in a neutral pH electrolyte, an aqueous solution of AgNO3, to circumvent using corrosives such as HNO3 or HClO4. In their work, they reported the formation of a silver oxide (AgxO) passivating film during electrolytic dealloying that hinders Ag and Au mobility and slows down the ligament coarsening significantly. The authors proposed a mechanism for Au surface diffusion and Ag dissolution in the presence of a AgxO passive film based on local pH gradients. They suggested the existence of the following three regions inside the pores.15 Region 1: the etch front, which has a lower pH compared to the rest of the pore. This region of low pH facilitates the dissolution of Ag and surface diffusion of Au. Region 2: the intermediate region adjacent to the etch front, where the AgxO layer starts to form. Region 3: the porous channels through which removed Ag+ ions diffuse and dissolve into the bulk electrolyte. Based on our results from SAXS, WAXS, SEM, EDX, XRD, and XPS, we build on the above model of Snyder et al., to explain the hindrance of Ag and Au mobility in our system, and propose the following regions within a nanopore which we graphically depict in Fig. 7 adapted from the work of Snyder et al.:15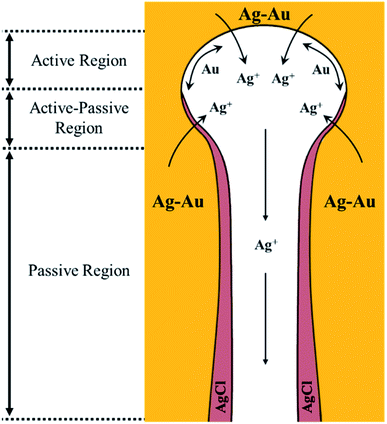 | ||
| Fig. 7 Au and Ag mobility mechanism in the presence of a passivating AgCl film formed during dealloying in HClO4. The three regions proposed are as follows: (1) active region: the etch front without a passive film, where Ag atoms can oxidize from the bulk Ag–Au electrode and Au is free to diffuse on the pore wall. (2) Active–passive region of competing dissolution of Ag and AgCl formation. (3) Passive region: a region where Ag oxidation from the bulk Au–Ag electrode is not possible due to a thick, passive AgCl film in the pore channel. Illustration adapted from the work of Snyder et al., DOI: 10.1149/1.2940319. Copyright The Electrochemical Society. Adapted by permission of IOP Publishing. All rights reserved.15 | ||
(5) Impact of passive film on energy applications
Various energy applications based on NP-Au can be impacted by this AgCl passive film. Two of them include the use of NP-Au as an (electro)catalyst,2,71 and as an electrochemical actuator to convert electrochemical energy into mechanical energy.72–77 In the former case, the remarkable (electro)catalytic performance of NP-Au made by selective removal of Ag from Au–Ag alloys is usually attributed to specific catalytic sites such as {100} facets, or to residual sacrificial Ag atoms near the surface of NP-Au.2,71 The presence of a passive film at the surface of NP-Au will obviously prevent these active catalytic sites from coming in direct contact with the liquid or gas reactant, in order for the catalytic reaction to take place. This raises a fundamental question pertaining to the origin of the remarkable (electro)catalytic performance of dealloyed nanoporous metals. In the latter case, nanoporous metals have been reported to perform very well as electrochemical actuators,72–77 known as metallic muscles,78 in which the actuation mechanism takes advantage of charge-induced changes in surface stress.72,79,80 An unexpected sign-inversion in the surface stress response of nanoporous metals has recently been reported during electrochemical actuation.14,74 Such a sign-inversion response was associated with a passive film present at the internal surface of freshly dealloyed nanoporous metals.14,74 Hence, passive films directly impact the performance of nanoporous metal electrochemical actuators.Conclusion
In summary, X-ray scattering techniques (SAXS and WAXS) were used in real time during NP-Au formation by selective electrolytic removal of Ag from a Au–Ag parent alloy (dealloying) in 1 M HClO4 and 1 M HNO3 electrolytes. We studied the impacts of side reactions on the reaction kinetics and on the morphology of the fabricated NP-Au in each of these electrolytes. By combining in situ SAXS and WAXS data with ex situ XRD, SEM, EDX, and XPS data, it was found that during electrolytic dealloying in HClO4, the Ag+ ions released during Ag oxidation at the Au–Ag working electrode spontaneously react with Cl− ions released during the reduction of ClO4− ions on the Pt counter electrode to form an insoluble AgCl passive film on the surface of NP-Au. We propose a mechanism for Au and Ag mobility in the presence of a passivating AgCl film formed during electrolytic dealloying in HClO4, building on insights from a previous report of passive film formation during electrolytic dealloying in neutral pH. The presence of the AgCl film at the Au–Ag/HClO4 interface is expected to hinder both the dissolution of Ag into the electrolyte and the surface diffusion of Au atoms left behind, which will ultimately slow down the dealloying reaction kinetics and the rate of ligament growth and coarsening. During electrolytic dealloying in HNO3, on the other hand, it was found that AgOx forms at the Au–Ag/HNO3 interface. However, because AgOx compounds are very soluble in acids, they do not form an ion-blocking passive film at the electrode/electrolyte interface even though residual AgOx can be trapped in the pores of NP-Au during dealloying. As a result, the reaction kinetics are less hampered in HNO3 and the ligaments grow larger during the initial stages of dealloying. These new insights should contribute to a better understanding of the reaction mechanisms in dealloying, and to a better control of the morphology and surface chemical state of dealloyed nanoporous metals for specific applications.Conflicts of interest
There are no conflicts to declare.Acknowledgements
The authors are thankful to Penn Engineering and the Vagelos Institute for Energy Science and Technology (VIEST) for their financial support through the PI startup and the 2019 VIEST Fellowship to Samuel S. Welborn. We gratefully acknowledge the National Science Foundation (NSFMRI-1725969), which funded the Dual Source (Cu and Mo) and Environmental X-ray Scattering (DEXS) facility used in this research. This work was carried out in part at the Singh Center for Nanotechnology, part of the National Nanotechnology Coordinated Infrastructure Program, which is supported by the NSF grant NNCI-1542153.References
- T. T. H. Hoang and A. A. Gewirth, ACS Catal., 2016, 6, 1159–1164 CrossRef CAS.
- A. Wittstock, V. Zielasek, J. Biener, C. M. Friend and M. Bäumer, Science, 2010, 327, 319–322 CrossRef CAS PubMed.
- Z. Wang, J. Du, Y. Zhang, J. Han, S. Huang, A. Hirata and M. Chen, Nano Energy, 2019, 56, 286–293 CrossRef CAS.
- E. Detsi, X. Petrissans, Y. Yan, J. B. Cook, Z. Deng, Y.-L. Liang, B. Dunn and S. H. Tolbert, Phys. Rev. Mater., 2018, 2, 55404 CrossRef CAS.
- M. Li, Z. Wang, J. Fu, K. Ma and E. Detsi, Scr. Mater., 2019, 164, 52–56 CrossRef CAS.
- F. Meng and Y. Ding, Adv. Mater., 2011, 23, 4098–4102 CrossRef CAS PubMed.
- X. Lang, A. Hirata, T. Fujita and M. Chen, Nat. Nanotechnol., 2011, 6, 232–236 CrossRef CAS PubMed.
- J. Ye, A. C. Baumgaertel, Y. M. Wang, J. Biener and M. M. Biener, ACS Nano, 2015, 9, 2194–2202 CrossRef CAS PubMed.
- S. S. Welborn, S. Van Der Meer, J. S. Corsi, J. T. M. De Hosson and E. Detsi, ACS Appl. Mater. Interfaces, 2021, 13, 11721–11731 CrossRef CAS PubMed.
- E. Detsi, M. Salverda, P. R. Onck and J. T. M. De Hosson, J. Appl. Phys., 2014, 115, 44308 CrossRef.
- X. Lang, L. Qian, P. Guan, J. Zi and M. Chen, Appl. Phys. Lett., 2011, 98, 93701 CrossRef.
- A. Pröschel, J. Chacko, R. Whitaker, M. A. U. Chen and E. Detsi, J. Electrochem. Soc., 2019, 166, H146–H150 CrossRef.
- J. Erlebacher, M. J. Aziz, A. Karma, N. Dimitrov and K. Sieradzki, Nature, 2001, 410, 450–453 CrossRef CAS PubMed.
- H. J. Jin, S. Parida, D. Kramer and J. Weissmüller, Surf. Sci., 2008, 602, 3588–3594 CrossRef CAS.
- J. Snyder, K. Livi and J. Erlebacher, J. Electrochem. Soc., 2008, 155, C464 CrossRef CAS.
- M. Graf, B. Roschning and J. Weissmüller, J. Electrochem. Soc., 2017, 164, C194–C200 CrossRef CAS.
- T. Wada, K. Yubuta, A. Inoue and H. Kato, Mater. Lett., 2011, 65, 1076–1078 CrossRef CAS.
- L. Lu, P. Andela, J. T. M. De Hosson and Y. Pei, ACS Appl. Nano Mater., 2018, 1, 2206–2218 CrossRef CAS PubMed.
- M. Kosmidou, M. J. Detisch, T. L. Maxwell and T. J. Balk, MRS Commun., 2019, 9, 144–149 CrossRef CAS.
- W. Yang, X.-G. Zheng, S.-G. Wang and H.-J. Jin, J. Electrochem. Soc., 2018, 165, C492–C496 CrossRef CAS.
- Q. Chen, J. Electrochem. Soc., 2014, 161, H643–H646 CrossRef CAS.
- C. Wang and Q. Chen, Chem. Mater., 2018, 30, 3894–3900 CrossRef CAS.
- S. Chatterjee, A. Anikin, D. Ghoshal, J. L. Hart, Y. Li, S. Intikhab, D. A. Chareev, O. S. Volkova, A. N. Vasiliev, M. L. Taheri, N. Koratkar, G. Karapetrov and J. Snyder, Acta Mater., 2020, 184, 79–85 CrossRef CAS.
- E. Detsi, S. Punzhin, J. Rao, P. R. Onck and J. T. M. De Hosson, ACS Nano, 2012, 6, 3734–3744 CrossRef CAS PubMed.
- H. Kumar, E. Detsi, D. P. Abraham and V. B. Shenoy, Chem. Mater., 2016, 28, 8930–8941 CrossRef CAS.
- X.-B. Cheng, R. Zhang, C.-Z. Zhao, F. Wei, J.-G. Zhang and Q. Zhang, Adv. Sci., 2016, 3, 1500213 CrossRef PubMed.
- Y. C. K. Chen-Wiegart, S. Wang, Y. S. Chu, W. Liu, I. McNulty, P. W. Voorhees and D. C. Dunand, Acta Mater., 2012, 60, 4972–4981 CrossRef CAS.
- K. Ma, J. S. Corsi, J. Fu and E. Detsi, ACS Appl. Nano Mater., 2018, 1, 541–546 CrossRef CAS.
- S. Parida, D. Kramer, C. A. Volkert, H. Rösner, J. Erlebacher and J. Weissmüller, Phys. Rev. Lett., 2006, 97, 35504 CrossRef CAS PubMed.
- P. Gao, P. Qian, L. Qiao, A. A. Volinsky and Y. Su, Scr. Mater., 2019, 168, 1–4 CrossRef CAS.
- C. Lakshmanan, R. N. Viswanath, R. Rajaraman, S. Dash and A. K. Tyagi, Mater. Today: Proc., 2016, 3, 1702–1706 Search PubMed.
- A. K. Mishra, C. Bansal and H. Hahn, J. Appl. Phys., 2008, 103, 94308 CrossRef.
- L.-H. Shao, H.-J. Jin, R. N. Viswanath and J. Weissmüller, Europhys. Lett., 2010, 89, 66001 CrossRef.
- L.-Z. Liu, X.-L. Ye and H.-J. Jin, Acta Mater., 2016, 118, 77–87 CrossRef CAS.
- B. Roschning and J. Weissmüller, Adv. Mater. Interfaces, 2020, 7, 2001415 CrossRef.
- M. Kim, W.-J. Ha, J.-W. Anh, H.-S. Kim, S.-W. Park and D. Lee, J. Alloys Compd., 2009, 484, 28–32 CrossRef CAS.
- O. Okman and J. W. Kysar, J. Alloys Compd., 2011, 509, 6374–6381 CrossRef CAS.
- M. Graf, M. Haensch, J. Carstens, G. Wittstock and J. Weissmüller, Nanoscale, 2017, 9, 17839–17848 RSC.
- N. A. Senior and R. C. Newman, Nanotechnology, 2006, 17, 2311–2316 CrossRef CAS.
- A. A. El-Zoka, B. Langelier, G. A. Botton and R. C. Newman, Mater. Charact., 2017, 128, 269–277 CrossRef CAS.
- A. F. Ebrahimy, B. Langelier and R. C. Newman, Mater. Today Commun., 2020, 25, 101371 CrossRef CAS.
- F. Liu, X.-L. Ye and H.-J. Jin, Phys. Chem. Chem. Phys., 2017, 19, 19217–19224 RSC.
- S.-M. Zhang and H.-J. Jin, Appl. Phys. Lett., 2014, 104, 101905 CrossRef.
- X.-L. Ye, N. Lu, X.-J. Li, K. Du, J. Tan and H.-J. Jin, J. Electrochem. Soc., 2014, 161, C517–C526 CrossRef.
- P. Gao, X. Ye, Z. Zhu, Y. Wu, A. A. Volinsky, L. Qiao and Y. Su, Scr. Mater., 2016, 119, 51–54 CrossRef CAS.
- R. Musat, S. Moreau, F. Poidevin, M. H. Mathon, S. Pommeret and J. P. Renault, Phys. Chem. Chem. Phys., 2010, 12, 12868–12874 RSC.
- S. G. Corcoran, Proceedings of the Symposium on Critical Factors in Localized Corrosion III, The Electrochemical Society, 1999, pp. 500–507 Search PubMed.
- M. Hakamada and M. Mabuchi, Mater. Lett., 2008, 62, 483–486 CrossRef CAS.
- A. M. Hodge, J. R. Hayes, J. A. Caro, J. Biener and A. V. Hamza, Adv. Eng. Mater., 2006, 8, 853–857 CrossRef CAS.
- A. Lackmann, M. Bäumer, G. Wittstock and A. Wittstock, Nanoscale, 2018, 10, 17166–17173 RSC.
- N. Badwe, X. Chen and K. Sieradzki, Acta Mater., 2017, 129, 251–258 CrossRef CAS.
- P. Wahl, T. Traußnig, S. Landgraf, H.-J. Jin, J. Weissmüller and R. Würschum, J. Appl. Phys., 2010, 108, 73706 CrossRef.
- L. V. Moskaleva, S. Röhe, A. Wittstock, V. Zielasek, T. Klüner, K. M. Neyman and M. Bäumer, Phys. Chem. Chem. Phys., 2011, 13, 4529–4539 RSC.
- A. Lackmann, C. Mahr, M. Schowalter, L. Fitzek, J. Weissmüller, A. Rosenauer and A. Wittstock, J. Catal., 2017, 353, 99–106 CrossRef CAS.
- M. Teubner and R. Strey, J. Chem. Phys., 1987, 87, 3195–3200 CrossRef CAS.
- S. S. Welborn and E. Detsi, Nanoscale Horiz., 2020, 5, 12–24 RSC.
- E. Detsi, M. Van De Schootbrugge, S. Punzhin, P. R. Onck and J. T. M. De Hosson, Scr. Mater., 2011, 64, 319–322 CrossRef CAS.
- Y. Li, B.-N. Dinh Ngô, J. Markmann and J. Weissmüller, Phys. Rev. Mater., 2019, 3, 76001 CrossRef CAS.
- C. Soyarslan, S. Bargmann, M. Pradas and J. Weissmüller, Acta Mater., 2018, 149, 326–340 CrossRef CAS.
- H. Hunt and L. Boncyk, J. Am. Chem. Soc., 1933, 55, 3528–3530 CrossRef CAS.
- B. Zugic, L. Wang, C. Heine, D. N. Zakharov, B. A. J. Lechner, E. A. Stach, J. Biener, M. Salmeron, R. J. Madix and C. M. Friend, Nat. Mater., 2017, 16, 558–564 CrossRef CAS PubMed.
- S. Röhe, K. Frank, A. Schaefer, A. Wittstock, V. Zielasek, A. Rosenauer and M. Bäumer, Surf. Sci., 2013, 609, 106–112 CrossRef.
- N. J. Firet, M. A. Blommaert, T. Burdyny, A. Venugopal, D. Bohra, A. Longo and W. A. Smith, J. Mater. Chem. A, 2019, 7, 2597–2607 RSC.
- J. Luo, Q. Yin, J. Zhang, S. Zhang, L. Zheng and J. Han, ACS Appl. Energy Mater., 2020, 3, 4559–4568 CrossRef CAS.
- N. Zhao, X. Fei, X. Cheng and J. Yang, IOP Conf. Ser.: Mater. Sci. Eng., 2017, 242, 12002 CrossRef.
- P. Vanýsek, Handb. Chem. Phys., 2012, 93, 5–80 Search PubMed.
- J. Fu, Z. Deng and E. Detsi, JOM, 2019, 71, 1581–1589 CrossRef CAS.
- E. T. Urbansky, Biorem. J., 1998, 2, 81–95 CrossRef CAS.
- W. Chen, J. Huang, J. Wei, D. Zhou, J. Cai, Z.-D. He and Y.-X. Chen, Electrochem. Commun., 2018, 96, 71–76 CrossRef CAS.
- J. R. Davis, Corrosion: Understanding the Basics, ASM International, Materials Park, OH, 2000 Search PubMed.
- Z. Wang, P. Liu, J. Han, C. Cheng, S. Ning, A. Hirata, T. Fujita and M. Chen, Nat. Commun., 2017, 8, 1066 CrossRef PubMed.
- J. Weissmüller, R. N. Viswanath, D. Kramer, P. Zimmer, R. Würschum and H. Gleiter, Science, 2003, 300, 312–315 CrossRef PubMed.
- E. Detsi, P. Onck and J. T. M. De Hosson, ACS Nano, 2013, 7, 4299–4306 CrossRef CAS PubMed.
- H. J. Jin, X. L. Wang, S. Parida, K. Wang, M. Seo and J. Weissmüller, Nano Lett., 2010, 10, 187–194 CrossRef CAS PubMed.
- C. Cheng and A. H. W. Ngan, ACS Nano, 2015, 9, 3984–3995 CrossRef CAS PubMed.
- M. Hakamada and M. Mabuchi, Procedia Engineering, Elsevier B.V., 2014, vol. 81, pp. 2159–2164 Search PubMed.
- J. Zhang, Q. Bai and Z. Zhang, Nanoscale, 2016, 8, 7287–7295 RSC.
- R. H. Baughman, Science, 2003, 300, 268–269 CrossRef CAS PubMed.
- E. Detsi, M. S. Sellès, P. R. Onck and J. T. M. De Hosson, Scr. Mater., 2013, 69, 195–198 CrossRef CAS.
- C. Stenner, L. H. Shao, N. Mameka and J. Weissmuller, Adv. Funct. Mater., 2016, 26, 5174–5181 CrossRef CAS.
Footnote |
| † Electronic supplementary information (ESI) available. See DOI: 10.1039/d1ta04822h |
| This journal is © The Royal Society of Chemistry 2021 |

