 Open Access Article
Silver sulfide nanoparticles for photodynamic therapy of human lymphoma cells via disruption of energy metabolism
Ge Wangab,
Jing Liua,
Lin Zhua,
Yuming Guo *a and
Lin Yang
 *a
*a
aHenan Key Laboratory of Green Chemical Media and Reactions, School of Chemistry and Chemical Engineering, Henan Normal University, Xinxiang, Henan 453007, P. R. China. E-mail: yanglin1819@163.com
bSchool of Basic Medical Sciences, Xinxiang Medical University, Xinxiang, Henan 453003, P. R. China
First published on 23rd September 2019
Abstract
Recently, studies on the application of light-responsive semiconductor nanomaterials for photodynamic therapy (PDT) of non-solid tumors have attracted tremendous attention. Herein, 6.98 nm Ag2S nanoparticles (Ag2S NPs) with excellent aqueous dispersibility, stability, and biocompatibility were synthesized by a facile strategy without any post-modification. In vitro studies indicated that Ag2S NPs could significantly inhibit the growth of human lymphoma cells (Raji cells) compared with hepatoma carcinoma cells (Hep G2 cells) under light irradiation. Further studies revealed that Ag2S NPs could specifically induce the accumulation of intracellular reactive oxidative species in Raji cells under light irradiation, and induce significant disruption of energy metabolism. This finding provides inspiration for the potential application of Ag2S semiconductor nanoparticles as a photosensitizer to significantly and specifically treat human lymphoma through PDT.
1 Introduction
Photodynamic therapy (PDT) is known as a non-invasive therapeutic method for efficient treatment of cancers1,2 due to its repeatability without cumulative toxicity, minimal invasiveness, and improved quality of life for the patient.3–5 Owing to the critical role of photosensitizers in PDT treatment, there is much interest in exploiting superior photosensitizers to enhance the curative duration of PDT.6,7 Although traditional organic photosensitizer molecules, such as rhodamine, porphyrin, and their derivatives, ensure effective execution of PDT,8,9 some properties still need to be improved: for example, enhanced retention times or resistance to photobleaching.10,11 In addition, complicated synthesis and functionalization steps can be barriers to their practical application.Some inorganic nanomaterials possess intrinsic photodynamic properties for killing tumor cells by photochemical reactions, which are similar to organic photosensitizers, through their inherent light-absorption abilities.12,13 Different from organic photosensitizers, the enhanced permeability and retention of inorganic nanomaterials may offer better opportunities for phototherapy applications.14,15 However, most studies on inorganic photosensitizers have mainly focused on organic–inorganic hybrid nanomaterials8,16,17 and up-conversion of nanoparticles,18,19 which have to overcome complicated syntheses for energy conversion efficiency. Recently, some semiconductor nanoparticles (SCNPs) with superior photosensitive properties have been used for photodynamic therapy,20 including Cd- and Pb-based SCNPs, because they emit in the visible and near-infrared region.20,21 However, the high toxicity of lead and cadmium hinders their potential application. Moreover, the lack of in-depth understanding of the response of SCNPs to PDT does not help in their effective use in correlative nanomaterials for PDT. Thus, it is urgent to explore alternative inorganic photosensitizers with low toxicity and improved efficiency.
Some studies have indicated that, due to the absence of toxic metal ions and the ultralow solubility product constant (Ksp = 6.3 × 10−50), Ag2S exhibits excellent biocompatibility22 and a wide range of applications in many fields, including bioimaging,23 fluorescent detection of molecules and metal ions,24,25 electronics, catalysis,26 and energy conversion.27 In particular, Ag2S NPs have attracted increasing attention as a result of their fascinating optical properties. However, little is known about the application of Ag2S nanoparticles (Ag2S NPs) as a photosensitizer for PDT, especially to treat non-solid tumors such as lymphoma, which is more aggressive and chemoresistant than solid tumors.28
Based on these considerations and using bovine serum albumin (BSA) as stabilizer, we utilize a facile strategy to synthesize crystalline Ag2S nanoparticles with good water dispersibility. The as-prepared Ag2S NPs can be used directly as a photosensitizer to significantly inhibit the growth of human lymphoma cells under light irradiation. This can be ascribed to accumulation of intracellular reactive oxygen species (ROS) and the corresponding disruption of energy metabolism. The results indicate that Ag2S NPs might be used as a photosensitizer to specifically and significantly treat human lymphoma through PDT.
2 Experimental section
Chemicals
Silver nitrate (AgNO3), thioacetamide (TAA), and BSA were purchased from Sigma Chemical Co. (USA). Reactive oxygen species assay kit was purchased from Beyotime Biotechnology (Shanghai, China). Fetal bovine serum (FBS), EMEM medium, DMEM medium, trypsin, 3-(4,5-dimethylthiazol-2-yl)-2,5-diphenyltetrazolium bromide (MTT), and annexin V-FITC/PI double-staining assay kit were purchased from Becton Dickinson and Company.Preparation of Ag2S/BSA NPs
AgNO3 was dissolved in double-distilled water (ddH2O) and mixed with BSA solution, then moderately stirred for 6 h to ensure complete chelation of Ag+ with BSA. Then, TAA was dissolved in ddH2O and slowly injected into the Ag+–BSA mixed solution under nitrogen flow, then allowed to stand for 24 h at 25 °C. Finally, the sample (Ag2S/BSA NPs) was collected and dried under vacuum.Characterization
The morphology and size of the Ag2S NPs were characterized by HRTEM (JEOL JEM-2100). The Fourier transform infrared (FT-IR) spectra were recorded in the range 4000–400 cm−1 (Bio-Rad FTS-40 FT-IR spectrometer). The crystal phase of the Ag2S/BSA NPs was determined using an X-ray diffractometer (Bruker AXS, Germany) with graphite-monochromatized CuKα radiation (λ = 0.15406 nm) in the 2θ range 20–70°. UV-vis absorption spectra were recorded on a Shimadzu UV-1700 spectrometer. Zeta potentials in phosphate buffer solution (PBS), H2O, serum or DMEM, were measured using a Nano-ZS instrument. Photoluminescence (PL) measurements were carried out on a HITACHI FP-6500 spectrophotometer.Cell culture and evaluation of cytotoxic effects
Human hepatoma (Hep G2) and lymphoma (Raji) cells were purchased from the Cell Bank of the Chinese Academy of Sciences, Shanghai, China. The cells were incubated in DMEM or EMEM medium under 5.0 wt%/vol CO2 at 37 °C. Then, Ag2S NPs of different concentrations were added. After 2 h incubation, cells were irradiated with a diode laser (400–600 nm, 0.4 W cm−2, ∅ 3 mm) for 10 h. The cytotoxic effects of Ag2S NPs under dark or light irradiation were determined by MTT cytotoxic assay.29 The data were analyzed by one-way ANOVA.Annexin V-FITC/PI double-staining assay
Hep G2 cells and Raji cells (1 × 10⁵ cells per ml) were cultured for 24 h. Then, the cells were exposed to Ag2S NPs for 12 h under dark or light irradiation. As control, cells without treatment with Ag2S NPs were prepared. After treatment, the cells were harvested. The apoptotic and necrotic evaluation was quantified by flow cytometric analysis.Confocal microscopy analysis
Hep G2 cells and Raji cells (1 × 10⁵ cells per ml) were incubated in a confocal dish for 12 h. Then, the cells were treated with Ag2S NPs. An FV1200 spectral confocal microscope (Olympus, Japan) was used to image cells in one-photon mode. As control, the untreated cells were imaged.Evaluation of intracellular internalization of Ag2S NPs
Hep G2 cells and Raji cells (1 × 10⁵ cells per ml) were treated by Ag2S NPs for 12 h under dark or light irradiation. Subsequently, all of the cells were continually exposed under dark for 6 h. After treatment, the cells were digested with concentrated nitric acid for 2 h. As control, the cells without treatment with Ag2S NPs were prepared. Then, the intracellular concentrations of Ag+ were analyzed by inductively coupled plasma-mass spectroscopy (ICP-MS) (ELAN DRC-e, PerkinElmer SCIEX).Flow cytometric analysis and confocal microscopy imaging analysis of intracellular ROS
2′,7′-Dichlorofluorescin diacetate (DCFH-DA) was utilized to evaluate intracellular ROS levels. Briefly, after incubation with Ag2S NPs for 12 h under dark or light irradiation, the cells (1 × 10⁶ cells per ml) were further exposed to DCFH-DA for 2 h. Subsequently, cells were continually exposed under dark for another 6 h. As control, the cells without treatment with Ag2S NPs were prepared. After treatment, the cells were harvested. The fluorescence of intracellular ROS was analyzed by flow cytometry. Meanwhile, cell imaging was carried out using a FV1200 spectral confocal microscopy.Photostability of Ag2S NPs
To evaluate the photostability of the Ag2S NPs, the photoluminescence and UV-vis absorbance of Ag2S NPs were continually monitored every 2 h under dark or light irradiation.Glycolysis metabolism evaluation by Seahorse extracellular flux (XF-96) analyzer
The glycolytic capacity was determined for Raji cells using the Seahorse XF-96 analyzer. Cells were incubated for 24 h and treated with Ag2S NPs under dark or light irradiation. Then, cellular oxygen consumption rates (OCRs) were measured as follows. Cells were washed with Seahorse assay media supplemented with fresh sodium pyruvate and glucose and incubated at 37 °C without CO2 for 1 h. Oligomycin (1 μM), carbonyl cyanide-p-trifluoromethoxyphenylhydrazone (FCCP) (0.5 μM), and rotenone/antimycin A (1 μM) were sequentially added into each well. Then, the amount of oxygen consumption for adenosine triphosphate (ATP) production (coupling efficiency), the level of proton leak (non-ATP-linked oxygen consumption), the maximal respiration capacity, and the level of non-mitochondrial respiration were measured.3 Results and discussion
Synthesis and characterization of silver sulfide nanoparticles
Silver sulphide nanoparticles (Ag2S NPs) were synthesized using BSA as a stabilizer by a facile method. First, silver nitrate aqueous solution was gently mixed with BSA aqueous solution to construct the chelating system. Then, the chelating system was mixed with freshly prepared TAA aqueous solution to prepare Ag2S NPs. The X-ray diffraction (XRD) pattern was recorded and used to demonstrate formation of the silver sulfide. The diffraction peaks with 2θ values at 31.52°, 34.38°, and 36.81° (Fig. 1a) can be indexed to the (−112), (−121) and (121) planes of acanthite Ag2S. From the HRTEM images shown in Fig. 1b, the as-prepared Ag2S comprises well-dispersed nanoparticles with an average diameter of ∼6.98 nm. The lattice fringe spacing in the HRTEM image was determined as 0.294 nm (see Fig. 1c), corresponding to the (−112) plane of acanthite Ag2S.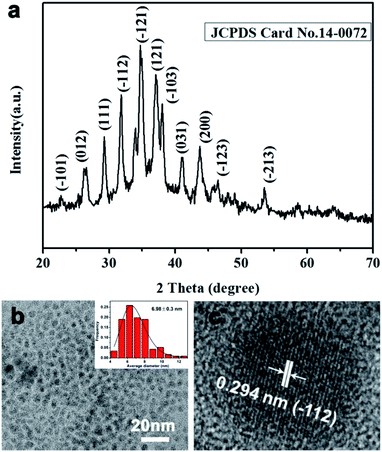 | ||
| Fig. 1 Characterization of silver sulfide. (a) XRD pattern of silver sulfide. (b and c) HRTEM images of silver sulfide and lattice fringe image (c). Inset (b): size distribution analysis. | ||
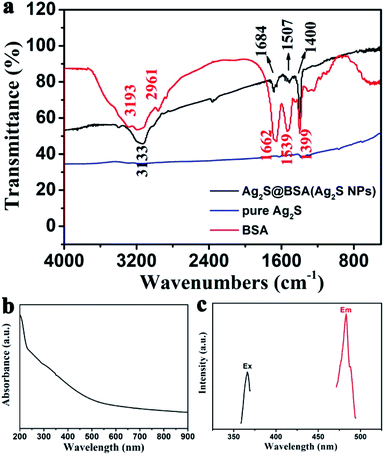
The zeta potentials of Ag2S NPs in ddH2O, FBS, PBS, and DMEM medium were determined to be −24.74, −26.78, −21.48, and −31.21 mV, respectively. Therefore, these results reveal the excellent stability of the Ag2S NPs under physiological conditions when the Ag2S NPs are dispersed into different media. The FT-IR spectroscopic analysis results indicate the presence of BSA in the as-prepared Ag2S NPs. From the FT-IR spectra shown in Fig. 2a, compared with Ag2S NPs, absorption bands of N–H stretching (3193 cm−1) and amide bands (1662, 1539, and 1399 cm−1) were detected in the spectrum of BSA. In the spectrum for Ag2S NPs the absorption bands for N–H stretching are observed to shift to lower wavenumber (3193 to 3133 cm−1) and the amide bands obviously shift to higher/lower wavenumber (1684, 1507, and 1400 cm−1), suggesting the presence of BSA in Ag2S NPs and the interaction of silver sulfide with BSA.
From the ultraviolet-visible (UV-vis) absorption characterization (Fig. 2b), silver sulfide nanoparticles exhibit strong absorbance in the range 200–600 nm, revealing good photo absorption properties. In Fig. 2c, the fluorescence spectrum demonstrates that Ag2S NPs exhibit a powerful emission peak at 483 nm (excitation wavelength: 366 nm).
Cell cytotoxicity assay
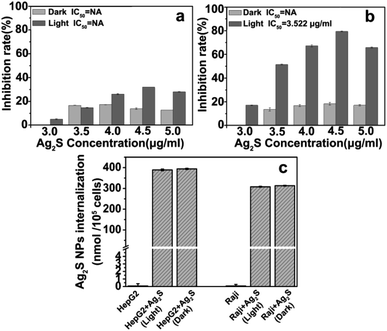
The antiproliferative effects of Ag2S NPs on Hep G2 human hepatocellular carcinoma cells and Raji human lymphoma cells were evaluated under dark or light irradiation using the MTT assay. From the data shown in Fig. 3a, Ag2S NPs slightly inhibit the proliferation of Hep G2 cells under dark or light irradiation. From Fig. 3b, negligible cytotoxicity was observed when Raji cells were treated with Ag2S NPs in the dark. However, under light irradiation, Ag2S NPs significantly inhibited the proliferation of Raji cells, compared with Hep G2 cells. The results indicate that Ag2S NPs could be used as photosensitizers for PDT of human lymphoma cells, such as Raji cells.Cellular internalization of Ag2S NPs
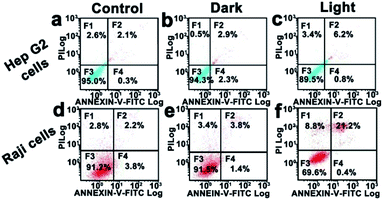
In order to explore the possible reasons for the specific anticancer activities of Ag2S NPs, the amounts of intracellular nanoparticles internalized by Hep G2 cells and Raji cells were determined through ICP-MS analysis. From the results shown in Fig. 3c, more Ag2S NPs could be internalized by Hep G2 cells. However, the intracellular amounts of Ag2S NPs internalized by Raji cells or Hep G2 cells do not show significant differences under dark or light irradiation. This suggests that the different efficiency for anticancer PDT of Ag2S NPs towards Hep G2 and Raji cells is not derived from the difference in the amounts of internalized nanoparticles. Meanwhile, ICP-MS results indicate that light irradiation cannot increase the amount of Ag2S NP internalization by Raji cells (Fig. 3c). In addition, the Ag2S NPs cannot be specifically internalized by Raji cells or Hep G2 cells.Because of the different antiproliferative effects of Ag2S NPs on different cancer cells, the apoptosis-inducing effects of Ag2S NPs on Hep G2 cells and Raji cells were determined using the annexin V-FITC/PI double-staining assay through flow cytometry analysis. From Fig. 4a–c it can be seen that the apoptosis of Hep G2 cells cannot be induced by Ag2S NPs, either under dark or light irradiation. Fig. 4d–f shows that Ag2S NPs, also, cannot induce apoptosis and necrosis of Raji cells under dark irradiation. However, Ag2S NPs could significantly induce apoptosis and necrosis (30%) of Raji cells under light irradiation. These results suggest that the considerable antiproliferative effects of Ag2S NPs on Raji cells are relevant to apoptosis.
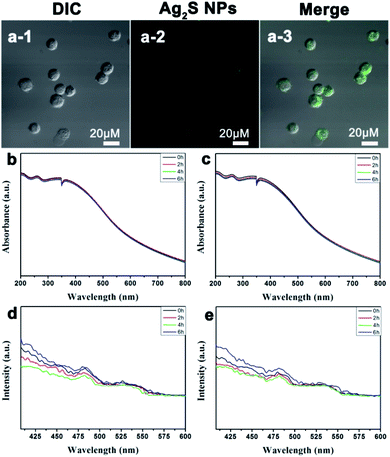
Confocal microscopy images (Fig. 5a) show the luminescence intensity in Raji human lymphoma cells from Ag2S NPs. The bright-field images and overlay of confocal luminescence show that luminescence can be observed in the cytoplasm but not in the membrane surface and nucleus. In Fig. 5b–e, the UV-vis and fluorescence spectra of Ag2S NPs do not show obvious changes when illuminated for different periods of time, revealing their good photostability.
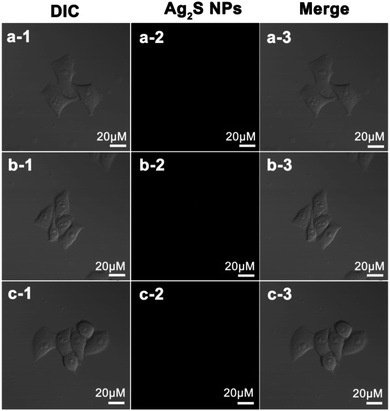
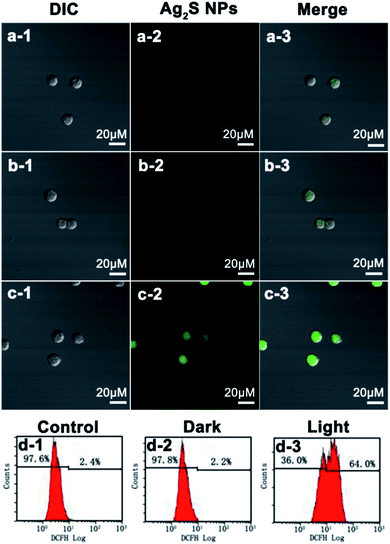
Confocal microscopy images indicate that Ag2S NPs cannot induce generation of intracellular ROS in Hep G2 cells when treated under dark or light irradiation (Fig. 6a–c). For Raji cells, the control cells and the cells treated with Ag2S NPs under dark exhibit only negligible green fluorescence (Fig. 7a and b). These results suggest that the intracellular level of ROS is very low when cells are treated with Ag2S NPs under dark irradiation. However, in contrast, strong green fluorescence was observed in Raji cells treated with Ag2S NPs under light irradiation (Fig. 7c), revealing the presence of high levels of intracellular ROS. These results indicate that high levels of intracellular ROS can be specifically generated by Raji cells upon treatment with Ag2S NPs under irradiation, which was further quantified by flow cytometric analysis. From Fig. 7d, compared with control cells, the fluorescence level of DCFH from the Raji cells treated with Ag2S NPs under dark does not show strong enhancement. However, after treatment with Ag2S NPs under light irradiation, the fluorescence level from Raji cells increases sharply. This confirms that treatment of Raji cell Ag2S NPs under light illumination can induce generation of intracellular ROS in Raji cells, which is critical for PDT of cancer cells.
To understand the photodynamic response of Raji cells treated with Ag2S NPs in depth, the OCR, an indicator of mitochondrial respiration, was determined to evaluate the effects of different treatments on the mitochondrial function of cancer cells. From the results shown in Fig. 8, compared with untreated Raji cells, the basal respiration, maximal respiration, and spare capacity of Raji cells decreased significantly when treated with Ag2S NPs under light irradiation. However, the cells treated with Ag2S NPs under dark were not influenced. These results reveal that Ag2S NPs under light irradiation could give rise to disruption of energy metabolism.
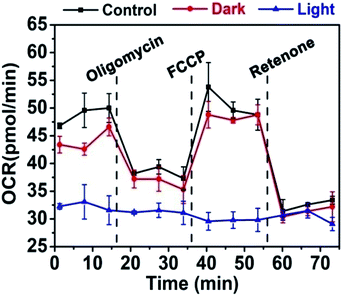 | ||
| Fig. 8 Cellular OCR of Raji cells by treatment with Ag2S NPs under dark and light irradiation. Error bars represent n = 3. | ||
Conclusions
In summary, aiming to find alternatives for inorganic photosensitizers that have low toxicity and improved efficiency as sole and direct photosensitizers for PDT, Ag2S/BSA hybrid nanoparticles with stable water dispersibility were prepared by a facile method, and without complicated modification. The Ag2S NPs with good solubility can be used directly as photosensitizers to significantly inhibit the growth of human non-solid tumors cells, such as human lymphoma cells, under light irradiation. This can be explained by accumulation of intracellular ROS. Furthermore, this study indicates a mechanism whereby Ag2S NPs damage mitochondrial function and disrupt energy metabolism, which could be used for sole and direct application to photodynamic therapy for human lymphoma cells.Conflicts of interest
There are no conflicts to declare.Acknowledgements
This work was financially supported by National Natural Science Foundation of China (21571053, 21771058), Program for Science Technology Innovation Talents and Team in Universities of Henan Province (18IRTSTHN002), Key Project of Science and Technology of Henan Province (182102311182), Key Scientific Research Project of Higher Education of Henan Province (18A150046), the 111 project (D17007) and Henan Center for Outstanding Overseas Scientists (GZS2018003).References
- S. Liu, H. Zhang, Y. Li, J. Liu, L. Du, M. Chen, R. T. K. Kwok, J. W. Y. Lam, D. L. Phillips and B. Z. Tang, Angew. Chem., Int. Ed., 2018, 57, 15189–15193 CrossRef CAS PubMed.
- Z. Zhou, J. Song, L. Nie and X. Chen, Chem. Soc. Rev., 2016, 45, 6597–6626 RSC.
- Y. Jiang, X. Pang, R. Liu, Q. Xiao, P. Wang, A. W. Leung, Y. Luan and C. Xu, ACS Appl. Mater. Interfaces, 2018, 10, 31674–31685 CrossRef CAS PubMed.
- M. Chudy, K. Tokarska, E. Jastrzębska, M. Bułka, S. Drozdek, Ł. Lamch, K. A. Wilk and Z. Brzózka, Biosens. Bioelectron., 2018, 101, 37–51 CrossRef CAS PubMed.
- W. Fan, N. Lu, C. Xu, Y. Liu, J. Lin, S. Wang, Z. Shen, Z. Yang, J. Qu, T. Wang, S. Chen, P. Huang and X. Chen, ACS Nano, 2017, 11, 5864–5872 CrossRef CAS PubMed.
- M. H. Chan, Y. T. Pan, I. J. Lee, C. W. Chen, Y. C. Chan, M. Hsiao, F. Wang, L. Sun, X. Chen and R. S. Liu, Small, 2017, 13, 1700038 CrossRef PubMed.
- L. Feng, F. He, Y. Dai, B. Liu, G. Yang, S. Gai, N. Niu, R. Lv, C. Li and P. Yang, ACS Appl. Mater. Interfaces, 2017, 9, 12993–13008 CrossRef CAS PubMed.
- J. Chen, Y. Xu, Y. Gao, D. Yang, F. Wang, L. Zhang, B. Bao and L. Wang, ACS Appl. Mater. Interfaces, 2018, 10, 248–255 CrossRef CAS PubMed.
- K. Hirakawa, D. Ouyang, Y. Ibuki, S. Hirohara, S. Okazaki, E. Kono, N. Kanayama, J. Nakazaki and H. Segawa, Chem. Res. Toxicol., 2018, 31, 371–379 Search PubMed.
- M. Cheng, Y. X. Cui, J. Wang, J. Zhang, L. N. Zhu and D. M. Kong, ACS Appl. Mater. Interfaces, 2019, 11, 13158–13167 CrossRef CAS PubMed.
- R. Yang, M. Hou, Y. Gao, L. Zhang, Z. Xu, Y. Kang and P. Xue, Nanoscale, 2019, 11, 5717–5731 RSC.
- L. e. Zhang, L. Zeng, Y. Pan, S. Luo, W. Ren, A. Gong, X. Ma, H. Liang, G. Lu and A. Wu, Biomaterials, 2015, 44, 82–90 CrossRef CAS PubMed.
- J. Y. Zhang, S. Chen, P. Wang, D. J. Jiang, D. X. Ban, N. Z. Zhong, G. C. Jiang, H. Li, Z. Hu, J. R. Xiao, Z. G. Zhang and W. W. Cao, Nanoscale, 2017, 9, 2706–2710 RSC.
- J. E. Au Chang, H. J. Au Cho and S. Au Jheon, J. Visualized Exp., 2016, e54865 Search PubMed.
- L. Li, S. Zhou, N. Lv, Z. Zhen, T. Liu, S. Gao, J. Xie and Q. Ma, Mol. Pharm., 2018, 15, 3595–3599 CrossRef CAS PubMed.
- Y.-X. Zhu, H.-R. Jia, Z. Chen and F.-G. Wu, Nanoscale, 2017, 9, 12874–12884 RSC.
- T. Nomoto, S. Fukushima, M. Kumagai, K. Miyazaki, A. Inoue, P. Mi, Y. Maeda, K. Toh, Y. Matsumoto, Y. Morimoto, A. Kishimura, N. Nishiyama and K. Kataoka, Biomater. Sci., 2016, 4, 826–838 RSC.
- F. Yang, J. Liu, X. Jiang, W. Wu, Z. Wang, Q. Zeng and R. Lv, RSC Adv., 2019, 9, 17273–17280 RSC.
- X. Sun, J. Sun, B. Dong, G. Huang, L. Zhang, W. Zhou, J. Lv, X. Zhang, M. Liu, L. Xu, X. Bai, W. Xu, Y. Yang, X. Song and H. Song, Biomaterials, 2019, 201, 42–52 CrossRef CAS PubMed.
- J. Sun, Y. Guo, L. Zhu, L. Yang, W. Shi, K. Wang and H. Zhang, Part. Part. Syst. Charact., 2017, 34, 1600413 CrossRef.
- K. Huang, L. Chen, J. Deng and J. Xiong, J. Nanomater., 2012, 2012, 1–12 Search PubMed.
- R. Gui, A. Wan, X. Liu, W. Yuan and H. Jin, Nanoscale, 2014, 6, 5467–5473 RSC.
- X. Jia, D. Li, J. Li and E. Wang, RSC Adv., 2015, 5, 80929–80932 RSC.
- F. Nemati and R. Zare-Dorabei, Talanta, 2019, 200, 249–255 CrossRef CAS PubMed.
- P. Jiang, S. Li, M. Han, Y. Liu and Z. Chen, Analyst, 2019, 144, 2604–2610 RSC.
- Y. Chen, Y. Liang, M. Zhao, Y. Wang, L. Zhang, Y. Jiang, G. Wang, P. Zou, J. Zeng and Y. Zhang, Ind. Eng. Chem. Res., 2019, 58, 3538–3548 CrossRef CAS.
- Z. Qiu, J. Shu and D. Tang, Anal. Chem., 2018, 90, 12214–12220 CrossRef CAS PubMed.
- M. Ahmed, E. Lorence, J. Wang, D. Jung, L. Zhang, K. Nomie and M. Wang, Sci. Signaling, 2019, 12, eaat4105 CrossRef CAS PubMed.
- C. Abshire, H. Y. Murad, J. S. Arora, J. Liu, S. H. Mandava, V. T. John, D. B. Khismatullin and B. R. Lee, J. Pharm. Sci., 2017, 106, 1355–1362 CrossRef CAS PubMed.
| This journal is © The Royal Society of Chemistry 2019 |

