 Open Access Article
Creative Commons Attribution 3.0 Unported Licence
A highly sensitive fluorimetric protocol based on isoindole formation for determination of gabapentin
Tamer Z. Attia ,
Mohamed Elnady and
Sayed M. Derayea
 *
*
Department of Analytical Chemistry, Faculty of Pharmacy, Minia University, Minia, Egypt. E-mail: sayed_derayea@mu.edu.eg
First published on 23rd September 2019
Abstract
A new, simple, highly sensitive and selective spectrofluorimetric method was developed for determination of gabapentin through its derivatization with o-phthalaldehyde in the presence of 2-mercaptoethanol. The resulting product was highly fluorescent and its emission intensity was measured at 431 nm after excitation at 335 nm. The effect of different experimental parameters on the formation and stability of the fluorescent product was carefully studied and optimized. The fluorescence–concentration plot was rectilinear over the range of 25–125 ng mL−1. The lower detection and quantification limits were 3.4 mL−1 and 11.2 ng mL−1, respectively. The procedure was fully validated according to the guidelines of the International Conference on Harmonization. The proposed method was successfully applied for the determination of the investigated drug in its pharmaceutical capsules and the results were in agreement with those of the reported method, in terms of the accuracy and precision. The low cost of analysis and high sensitivity make the proposed method ideally suited for analysis of the investigated drug in quality control laboratories.
1. Introduction
Gabapentin (Fig. 1), chemically known as 1-(amino methyl)cyclohexane acetic acid, is a structural analogue of the inhibitory neurotransmitter gamma-amino butyric acid (GABA) and its action is attributed to the irreversible inhibition of the enzyme GABA-transaminase, thus preventing the physiological degradation of GABA in the brain. It is an anticonvulsant drug used in the treatment of epilepsy and neuropathic pain, as an adjunct therapy for partial seizures in adults and children.1 | ||
| Fig. 1 The proposed pathway of the reaction between gabapentin and o-phthalaldehyde/2-mercaptoethanol reagent. | ||
An analytical literature survey revealed that several methods have been reported for determination of gabapentin in pure forms and pharmaceutical dosage forms including spectrophotometry,2–4 spectrofluorimetry,5–8 high-performance liquid chromatography (HPLC),9–11 gas chromatography-mass spectrometry (GC-MS),12 capillary electrophoresis13 and electrochemical techniques.14
The reported spectrofluorimetric methods of analysis are either suffer from low sensitivity5–7 or require heating and tedious extraction procedures.8 In addition, the chromatographic, electrophoretic and electrochemical methods require highly sophisticated instruments and/or require expensive detector which is not available in most laboratories.
The aim of the present work is to develop a simple and highly sensitive spectrofluorimetric method for determination of gabapentin. The amino group of the investigated drug was condensed with o-phthalaldehyde to form a highly fluorescent product. The proposed method was applied for the determination of gabapentin in its capsules without any interference from the excipients. The advantage of spectrofluorimetric method over other methods of analysis is that it does not require highly sophisticated instruments and more sensitive than the reported spectrophotometric methods of analysis.
2. Experimental
2.1 Apparatus
PerkinElmer UK model LS 45 Luminescence Spectrometer was used for performing all the spectrofluorimetric measurements. The instrument is equipped with a 150 W xenon arc lamp and a 1 cm quartz cell, connected to an IBM PC computer loaded with the FL WINLAB™ software. Grating excitation and emission monochromators slit width for both monochromators were set at 10 nm.Spectronic™ Genesys™ 2PC Ultraviolet/Visible Spectrophotometer (Milton Roy Co, USA) with a matched 1 cm quartz cell, connected to IBM computer loaded with Winspec™ application software. Milwaukee SM 101 pH meter, Portugal and Digital Analytical Balance (AG 29, Mettler Toledo, Glattbrugg, Switzerland) were also used.
2.2 Chemicals and reagents
Gabapentin was kindly provided by Delta Pharm Company (10th of Ramadan city, El Sharkeya, Egypt). It was used without further purification. o-Phthalaldehyde (Loba Chemie, Pvt. Ltd. 107, Woodhouse road, Mumbai, India) was freshly prepared by dissolving 10 mg in 3 mL of methanol and complete to 100 mL with distilled water. Working solution of the reagent (1 μg mL−1) was prepared by further dilution with distilled water. 2-Mercaptoethanol (Alpha Chemika, Mumbai, India) was freshly prepared as 0.5% (v/v) in water. Sodium hydroxide (El-Nasr Chemical Co., Cairo, Egypt) (0.1 M) was prepared by dissolving 400 mg in 100 mL of distilled water. Methanol was obtained from Merck, Darmstadt, Germany. All the reagents used were of analytical grade and the solutions were prepared with double distilled water.2.3 Pharmaceutical formulations
The following available commercial preparation was analyzed; Gaptin® capsules (Delta Pharma S.A.E, 10th of Ramadan City, El Sharkeya, Egypt) labeled to contain 100 mg gabapentin per capsule.2.4 Preparation of standard solution
A stock solution of gabapentin was prepared by dissolving 10.0 mg of the investigate drug in 100 mL methanol. This solution was further diluted with the same solvent as appropriate to obtain the required working concentrations. The standard solutions were stable for at least 7 days when kept in the refrigerator.2.5 General analytical procedure
Aliquots of gabapentin standard solutions covering the working concentration ranges (25–125 ng mL−1 as final concentrations) were quantitatively transferred into a series of 10 mL volumetric flasks. To each flask 0.6 mL of 2-mercaptoethanol solution (0.5% v/v) was added, followed by 0.8 mL of 0.1 M sodium hydroxide and mixed well. The solutions were allowed to stand for 10 min. Then, 1.7 mL of o-phthalaldehyde was added. The reaction mixture was allowed to stand for 25 min. The volume was completed to the mark with methanol and the fluorescence intensity of the reaction product was measured at 431 nm after excitation at 335 nm. The relative fluorescence intensity was plotted against the final concentration of the drug (ng mL−1) to get the calibration graph.2.6 Analysis of pharmaceutical formulations
Twenty capsules containing the investigated drug were accurately weighed and mixed thoroughly. An amount of the powder equivalent to 10 mg of the drug was dissolved in 100 mL methanol. The solution was further diluted with the same solvent and a portion of the resulting solution was subjected for drug analysis using the previously described general analytical procedure. The nominal content of the capsules were calculated using the corresponding regression equation.3. Result and discussion
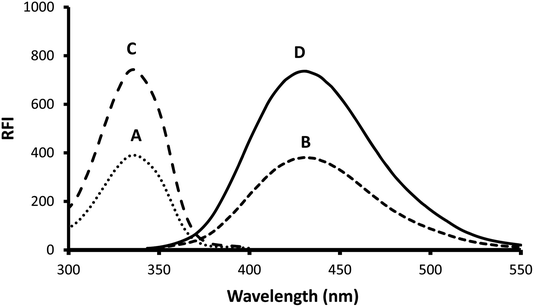
o-Phthalaldehyde in combination with a thiol compound, such as 2-mercaptoethanol, is widely utilized as a fluorescence derivatizing agent for amino compounds. This approach has been applied for the determination of several pharmaceutical compounds.15–17 A condensation reaction occurs between the aldehydic groups of o-phthalaldehyde and primary amine group of gabapentin lead to formation of a high fluorescent reaction product. Addition of 2-mercaptoethanol to the solution is essential to stabilize the formed reaction product. A proposal for the reaction pathway is presented in Fig. 1. The formed product exhibited high fluorescence at 431 nm after excitation at 335 nm. The fluorescence spectra of the reaction product obtained by using 75 ng mL−1 of gabapentin against the blank treated in the same manner are shown in Fig. 2.The developed spectrofluorimetric method has several advantages over the previous reported methods. The current spectrofluorimetric method is characterized by high sensitivity (in ng mL−1) compared with Hassan et al.5 and Prasad et al.7 methods. Also, the method is cheap as it does not depend on using expensive reagent compared with Belal et al. method.6 In addition, the proposed spectrofluorimetric method is highly simple as there is no need for heating, using buffer or extraction with ethyl acetate as in Ulu et al. method.8 As a result, the current spectrofluorimetric method is a good alternative to the previous reported methods and could be ideally suited for quality control laboratory.
3.1 Optimization of the reaction condition
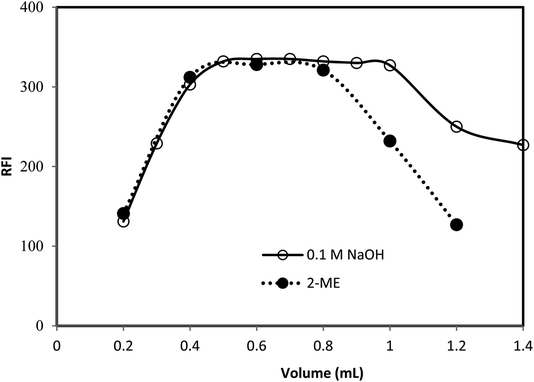
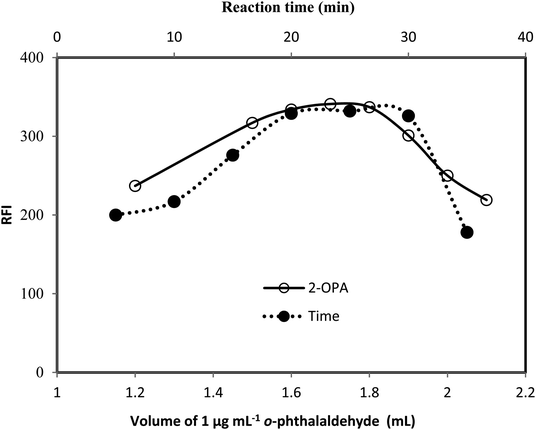
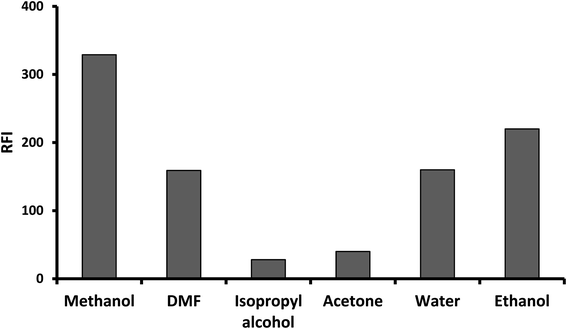
The fluorescence properties of the reaction product, as well as the different experimental parameters affecting the development and stability of the reaction product were carefully studied and optimized. Each factor was changed individually while others were kept constant. The examined factors included; volumes of 2-mercaptoethanol, sodium hydroxide and o-phthalaldehyde, reaction time and diluting solvents.As, the fluorescence intensity is directly proportional to the fluorescent product concentration. By increasing the reaction time, volume of 2-mercaptoethanol, sodium hydroxide or o-phthalaldehyde, the concentration of the fluorescent product (fluorophore) increase and subsequently the fluorescent intensity increased up to saturation. Further increasing in the fluorophore concentration, the fluorophore absorbs the exciting and possibly emitted light (the inner filter effect), reducing the amount of light detected and hence reduces the fluorescence intensity.
3.2 Validation of the proposed method
According to ICH Q2 recommendations,18 the analytical validity of the method was tested regarding; linearity, sensitivity, accuracy, and precision.Linearity and range: the calibration curve for studied drug was constructed by plotting the relative fluorescence intensities (RFI) against the final investigated drug concentrations (ng mL−1). Linear regression analysis of the data was performed and the calculated analytical parameters including slope, intercept, standard deviation of slope and intercept and correlation coefficient are summarized in Table 1. From the calibration curves, we could observe that the RFI values and the drug concentrations was linear dependent within the range of 25–125 ng mL−1 of gabapentin. The excellent linearity of the proposed method was indicated by the high correlation coefficients. In addition, the small values of standard deviation of the intercept (Sa), and standard deviation of the slope (Sb) indicate low scattering of the points around the calibration curves.
| Parameters | Value |
|---|---|
| Linear range (ng mL−1) | 25–125 |
| Intercept (a) | 69.8 |
| Standard deviation of the slope (Sb) | 0.046 |
| Slope (b) | 3.416 |
| Standard deviation of the intercept (Sa) | 3.849 |
| Correlation coefficient (r) | 0.9997 |
| Limit of detection (LOD, ng mL−1) | 3.4 |
| Limit of quantitation (LOQ, ng mL−1) | 11.2 |
Accuracy: in general, the accuracy could be defined as the closeness or agreement of the obtained analytical value to the true value and measured by calculating the percentage (%) recoveries. For the proposed method, the accuracy was checked by preparation of three standard solutions containing different concentrations of the studied drug within the specified linear range. The concentration of each standard solution was measured by our proposed method in triplicate manner. As shown in Table 2, the obtained % recoveries are close to 100% which indicates the good accuracy of the proposed method.
Precision: the precision is closeness or agreement of obtained analytical values to each other and is measured by calculating the relative standard deviation (RSD). The intra- and inter-day precisions were evaluated by applying the general analytical procedure for the analysis of standard drug solutions having three different concentrations within the specified linear range. The analysis was repeated three times within the same day for the intra-day precision and at three successive days for inter-day precision. The results were expressed in the form of % recovery and % relative standard deviation (Table 3). The calculated relative standard deviations were found to be very small and below 2%, indicating good repeatability and reliability of the proposed method.
| Conc. level (ng mL−1) | Intra-day precision | Inter-day precision | ||
|---|---|---|---|---|
| % recovery ± SDa | % RSDa | % recovery ± SDa | % RSDa | |
| a SD – standard deviation, % RSD – relative standard deviation percentage. | ||||
| 25 | 98.59 ± 1.17 | 1.19 | 100.94 ± 1.17 | 1.15 |
| 75 | 99.74 ± 1.62 | 1.63 | 98.96 ± 1.62 | 1.64 |
| 125 | 100.28 ± 1.17 | 1.17 | 100.85 ± 0.62 | 0.61 |
Sensitivity: the sensitivity of the proposed method was evaluated by calculating the limit of detection (LOD) and limit of quantitation (LOQ). Based on the standard deviation of the intercept (σ) and the slope of calibration curve (S), the Limit of detection (LOD) and limit of quantitation (LOQ) were calculated using the following formula (LOD = 3σ/S and LOQ = 10σ/S). The obtained detection and quantitation limits were 3.4 and 11.2 ng mL−1, respectively (Table 1). These values indicate the high sensitivity of the proposed method.
Robustness of the proposed method was evaluated by introducing minor changes in the experimental parameters such as volumes of o-phthalaldehyde, 2-mercaptoethanol, and sodium hydroxide and the reaction time (Table 5). These minor changes have no effect on the method performance as the obtained fluorescence intensities were nearly the same. As a result, the proposed method could be considered as robust.
| Parameters | Change | % recovery ± SD |
|---|---|---|
| o-Phthalaldehyde volume | 1.6 mL | 99.11 ± 1.27 |
| 1.8 mL | 101.25 ± 1.35 | |
| 2-Mercaptoethanol volume | 0.4 mL | 99.32 ± 1.16 |
| 0.8 mL | 101.45 ± 1.23 | |
| Sodium hydroxide volume | 0.5 mL | 99.83 ± 1.18 |
| 1.0 mL | 101.23 ± 1.26 | |
| Reaction time | 20 min | 99.93 ± 0.76 |
| 30 min | 101.33 ± 0.87 |
3.3 Application to pharmaceutical capsules
The general analytical procedure was applied for the quantitative analysis of commercial capsules containing gabapentin. The obtained results were statistically compared with those of the reported method3 using t- and F- tests. At 95% confidence level, no significant difference was observed between the calculated and theoretical values of both parameters indicating the acceptable level of precision and accuracy of the proposed method (Table 4). It is clear from the analysis of the dosage forms that the presence of excipients has no significant interference in the results of the analysis. This indicates that the proposed method could be used for determination of the investigated drug in their commercial capsules with a high degree of accuracy, precession and selectivity.4. Conclusion
A highly sensitive procedure for the selective spectrofluorimetric determination of gabapentin through derivatization with o-phthalaldehyde was developed and validated. The proposed method was successfully applied for determination of investigated drug in their commercial pharmaceutical capsules with good accuracy and precision without any interference from common excipients. The involved methodology does not require elaborate treatment for the sample or tedious extraction steps. The high sensitivity together with the recognized advantage of the relatively low cost of spectrofluorometric instrumentation make the application of the proposed method is feasible in routine analysis. Therefore, the proposed method is ideally suited for determination of gabapentin in quality control laboratories.Conflicts of interest
There are no conflicts to declare.References
- K. L. Goa and E. M. Sokrin, Gabapentin: A Review of Its Pharmacological Properties and Clinical Potential in Epilepsy, Drugs, 1993, 46, 409–427 CrossRef CAS PubMed.
- J. Al-Zehouri, S. Al-Madi and F. Belal, Determination of the antiepileptics vigabatrin and gabapentin in dosage forms and biological fluids using Hantzsch reaction, Arzneim. Forsch., 2001, 51, 97 CAS.
- R. S. Gujral, S. M. Haque and P. Shanker, A Sensitive UV Spectrophotometric Method for the Determination of Gabapentin, E-J. Chem., 2009, 6(S1), S163–S170 CrossRef.
- F. A. Siddiquia, et al., Spectrophotometric determination of gabapentin in pharmaceutical formulations using ninhydrin and π-acceptors, Eur. J. Med. Chem., 2010, 45(7), 2761–2767 CrossRef PubMed.
- E. M. Hassan, et al., Spectrofluorimetric determination of vigabatrin and gabapentin in dosage forms and spiked plasma samples through derivatization with 4-chloro-7-nitrobenzo-2-oxa-1,3-diazole, J. AOAC Int., 2001, 84, 1017 CAS.
- F. Belal, et al., Spectrofluorimetric determination of vigabatrin and gabapentin in urine and dosage forms through derivatization with fluorescamine, J. Pharm. Biomed. Anal., 2002, 27, 253 CrossRef CAS PubMed.
- M. K. C. Prasad, G. V. Sagar and D. P. Sudhakar, Spectrofluorimetric method of analysis for gabapentin in spiked human plasma and formulations, Int. J. ChemTech Res., 2013, 5(6), 2732–2746 Search PubMed.
- S. T. Ulu and E. Kel, Sensitive Spectrofluorimetric Method of Analysis for Gabapentin in Pure and Pharmaceutical Preparations, Chin. J. Chem., 2011, 29, 562–566 CrossRef CAS.
- Q. Jiang and S. Li, Rapid high-performance liquid chromatographic determination of serum gabapentin, J. Chromatogr. B: Biomed. Sci. Appl., 1999, 727, 119 CrossRef CAS.
- P. H. Tang, et al., Automated microanalysis of gabapentin in human serum by high-performance liquid chromatography with fluorometric detection, J. Chromatogr. B: Biomed. Sci. Appl., 1999, 727, 125 CrossRef CAS.
- D. F. Chollet, et al., Fast isocratic high-performance liquid chromatographic assay method for the simultaneous determination of gabapentin and vigabatrin in human serum, J. Chromatogr. B: Biomed. Sci. Appl., 2000, 746, 311 CrossRef CAS.
- M. M. Kushnir, et al., Analysis of gabapentin in serum and plasma by solid-phase extraction and gas chromatography-mass spectrometry for therapeutic drug monitoring, J. Anal. Toxicol., 1999, 23, 1 CrossRef CAS PubMed.
- P. Rada, et al., In vivo monitoring of gabapentin in rats: A microdialysis study coupled to capillary electrophoresis and laser-induced fluorescence detection, Electrophoresis, 1998, 19, 2976 CrossRef CAS PubMed.
- A. Yari, F. Papi and S. Farhadi, Voltammetric Determination of Trace Antiepileptic Gabapentin with a Silver-Nanoparticle Modified Multiwalled Carbon Nanotube Paste Electrode, Electroanalysis, 2011, 23(12), 2949–2959 CrossRef CAS.
- A. El-Gindy, et al., Spectrophotometric,spectrofluorimetric and LC determination of lisinopril, J. Pharm. Biomed. Anal., 2001, 25, 913–922 CrossRef CAS PubMed.
- N. M. El-Enany, et al., Validated spectrofluorimetric method for the determination of lamotrigine in tablets and human plasma through derivatization with o-phthalaldehyde, J. Fluoresc., 2010, 20, 463–472 CrossRef CAS PubMed.
- M. I. Walash, et al., Spectrofluorimetric determination of oseltamivir phosphate through derivatization with o-phthalaldehyde. Application to pharmaceutical preparations with a preliminary study on spiked plasma samples, Luminescence, 2012, 27, 511–518 CrossRef CAS PubMed.
- Validation of analytical procedures: methodology, Presented at international conference on harmonization of technical requirements for the registration of pharmaceuticals for human use (ICH), http://www.fda.gov/downloads/drugs/guidancecomplianceregulatoryinformation/guidances/ucm073384.pdf, 1996 Search PubMed.
| This journal is © The Royal Society of Chemistry 2019 |


