 Open Access Article
Creative Commons Attribution 3.0 Unported Licence
Novel organic solvents for electrochemistry at the liquid/liquid interface
Peter S.
Toth
and
Robert A. W.
Dryfe
*
School of Chemistry, University of Manchester, Oxford Road, Manchester, M13 9PL, UK. E-mail: robert.dryfe@manchester.ac.uk; Tel: +44 (0)161 306 4522
First published on 28th January 2015
Abstract
Two-phase voltammetry has been carried out using a reverse cell configuration, i.e. with the lower density organic solvent on the top of the aqueous solution in the cell, where the organic solvents contain either nitrile or ketone functional groups. The transfer of tetraphenylarsonium TPAs+, tetrabutylammonium TBA+, tetrapropylammonium TPrA+, and perchlorate CIO4− ions across these liquid/liquid interfaces has been observed. The standard Gibbs energies of ion partition from water to di-n-butyl ketone (5-nonanone) were calculated and compared with the previously reported 2-heptanone/water interface. Ion transfer (IT) and electron transfer (ET) were also investigated at the 5-nonanone/water interface. ET was exemplified using the ferri/ferrocyanide redox couple as the aqueous phase couple and the 7,7,8,8-tetracyanoquinodimethane (TCNQ) as the organic species.
Introduction
Liquid/liquid interfaces are important in various branches of electroanalysis. Voltammetry at the Interface between Two Immiscible Electrolyte Solutions (ITIES), requires two electrolytic solutions of low mutual miscibility to be present – namely an “oil” and an aqueous phase. The interface can be polarised by applying a direct potential; the potential difference is expressed as the Galvani potential (ΔwoΦ) between the two phases.1–4 Charge transfer at the ITIES can be detected as a current flow, when either ion transfer (IT) occurs across the interface as ΔwoΦ overcomes the Gibbs energy of transfer from the aqueous to organic phase, or as electron transfer (ET) through the interface by redox reactions in the different phases.5–18 Using a liquid/liquid interface has a distinct advantage over traditional solid/liquid interfaces (i.e. the interface between a metallic electrode and an electrolyte solution), as it can be considered as defect-free, which means that various reactants can be readily separated from one another to avoid direct interactions.1,19Conventionally, the liquid/liquid interface is formed from a more dense organic solvent than water with relative permittivity around 10–15. A number of organic solvents, such as nitrobenzene (NB),8,20,21 1,2-dichloroethane (DCE),5,8–10,22 acetophenone,23 1,2-dichlorobenzene (DCB),16,24 1,6-dichlorohexane,18,25 1,1-dichlorobutane25 have been widely used in electrochemical studies of the ITIES. The main limitation to the wider applications of these solvents, e.g. in electroanalysis, is the toxicity: DCE for example is classified as a suspected carcinogen. Other solvents such as 2-nitrophenyl octyl ether (NPOE), mixed organic solvents21,26 and even lately room temperature ionic liquids14,27 have been found to be suitable for liquid/liquid electrochemistry, but are either expensive or difficult to prepare. In 2012, Olaya et al. presented the utility of α,α,α-trifluorotoluene as a higher density (1.19 g cm−3 at 20 °C) organic phase, which is a colourless and free-flowing liquid with a relatively low toxicity.28 This work called attention to the need to identify alternative organic solvents for studying charge transfer across liquid/liquid interfaces.
In the last two decades the applications of various lower density organic solvents for two-phase electrochemistry have attracted interest. The key advantages of these solvents are their low toxicity, being non-halogenated and non-aromatic, as well as having low mutual solubilities with water. The successful observation of simple ion transfers from water to 2-heptanone and 2-octanone solvents with a relatively wide potential range (∼400 mV) have been reported.29,30 Moreover, Fernandes et al. reported several computational studies of the “inverted” liquid/liquid interface: the properties of two interfaces, 2-heptanone/water and iso-octane/water,31 have been studied with a focus on the transfer of the iodide ion across them; a molecular dynamics simulation reported the transfer of some metal ions (Na+, K+, Rb+ and Sr2+), and the tetramethylammonium ion across the 2-heptanone/water interface in 2000.32 Luo et al. demonstrated the utility of X-ray reflectivity to study the electron density as a function of depth through the nitrobenzene/water and 2-heptanone/water interfaces and found an interfacial width of around 7 Å for the 2-heptanone/water interface.20,33 Several organic solvents, such as phenyl isothiocyanate, benzyl cyanide, propiophenone, methyl cyclohexanone, cyclohexanone, methyl amyl ketone, benzonitrile and their mixtures with nitrobenzene and DCB have been studied for applications in liquid/liquid electrochemistry: an increase in the potential window in the case of the mixtures, compared to the pure solvents, was reported.26,34 There are several organic solvents containing either the nitrile or ketone functional groups, which have not been reported previously to the best of our knowledge, and which could be excellent candidates for the “reverse” liquid/liquid electrochemistry due to their low toxicity.
Interfacial ET has been reported at several oil/water interfaces, using more dense organic solvents, such as DCE, DCB, NB, NPOE.10,12,13 The most common method to investigate ET is two-phase liquid/liquid electrochemistry in a four-electrode configuration. ET can occur at the organic/water interface with each redox-active species in its respective phase, e.g. ferrocene25 or 1,1′-dimethylferrocene10,13 for oxidation or 7,7,8,8-tetracyanoquinodimethane (TCNQ)10,12,13 for reduction in the organic phase, and ferricyanide (Fe(CN)63−) reduction to ferrocyanide (Fe(CN)64−), or vice versa, in the aqueous solution. Scanning electrochemical microscopy (SECM) has been used to investigate ET in DCE and NB using TCNQ and ferricyanide.11,15 The interfacial ET study of TCNQ reduction in a lower density organic phase, i.e. at a reverse organic/water interface configuration, has not been reported previously, to the best of our knowledge.
In the current work we report a study of the ITIES between water and less dense organic solvents in this “reverse” liquid/liquid cell configuration. A number of novel organic solvents were found to be suitable for charge transfer: the widest potential window, around 600 mV, was found in the case of 5-nonanone, which is a colourless liquid with a relatively low cost, which is not a carcinogenic reagent (according to its material safety data sheet, MSDS).35 The standard transfer potential of different ions across the 5-nonanone/water interface was determined, the standard Gibbs energies calculated and compared to those reported previously for either 2-heptanone/water or 2-octanone/water interfaces. As a comparison, the electrochemical response of 5-nonanone as a “conventional” solvent (i.e. in a single phase system) was also investigated to prove that it can be employed as a stable solvent in this context. Finally, ET was studied between ferrocyanide (Fe(CN)64−) in the aqueous phase and TCNQ in the 5-nonanone organic solvent.
Experimental
Materials and reagents
Lithium chloride (LiCl, 99.99%, Sigma-Aldrich); tetrabutylammonium chloride (TBACl, 99%, Sigma-Aldrich); tetrapropylammonium chloride (TPrACl, ≥98%, Fluka); lithium perchlorate (LiClO4, ≥99.0%, Fluka); tetraphenylarsonium chloride hydrate, (TPAsCl, 97%, Sigma-Aldrich) were used as received. The organic phase electrolyte bis(triphenylphosphoranylidene)ammonium tetrakis(4-chlorophenyl)borate (BTPPATPBCl) was prepared as described elsewhere10 from potassium tetrakis(4-chlorophenyl)borate (KTPBCl, ≥98.0%, Sigma-Aldrich) and bis(triphenylphosphoranylidene)ammonium chloride (BTPPACl, 97%, Sigma-Aldrich). The 7,7,8,8-tetracyanoquinodimethane (TCNQ, 98%, Lancaster Synthesis); potassium hexacyanoferrate(III) (ferricyanide, K3Fe(CN)6, 99+%, Sigma-Aldrich) and potassium hexacyanoferrate(II) trihydrate (ferrocyanide, K4Fe(CN)6, ≥98.5%, Sigma Aldrich) were used as the organic and the aqueous redox couples.The organic solvents were 1,2-dichloroethane (DCE, ≥99.8%); butyl cyanide (valeronitrile, 99.5%); heptyl cyanide (caprylonitrile, 97%); methyl n-hexyl ketone (2-octanone, ≥98%); methyl octyl ketone (2-decanone, 98%); ethyl hexyl ketone (3-nonanone, 99%); di-n-butyl ketone (5-nonanone, 98%) all were purchased from Sigma-Aldrich and used as received. Deionized water (18.2 MΩ cm resistivity), purified by a “PURELAB” Ultrafiltration unit (Elga Process Water) was used for solution preparation. Glassware was cleaned in Piranha solution, a 1![[thin space (1/6-em)]](https://www.rsc.org/images/entities/char_2009.gif) :
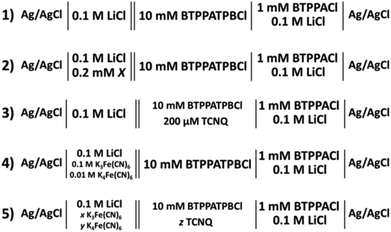
:![[thin space (1/6-em)]](https://www.rsc.org/images/entities/char_2009.gif) 4 mixture (by volume) of 30% hydrogen peroxide (H2O2, Fisher Scientific) and concentrated sulphuric acid (H2SO4, Fisher Scientific) – CAUTION required when handling – boiled in ultra-pure water, and dried. The composition of the electrochemical cells is displayed in Scheme 1.
4 mixture (by volume) of 30% hydrogen peroxide (H2O2, Fisher Scientific) and concentrated sulphuric acid (H2SO4, Fisher Scientific) – CAUTION required when handling – boiled in ultra-pure water, and dried. The composition of the electrochemical cells is displayed in Scheme 1.
Methods
Cyclic voltammetric experiments were performed using a three- and four-electrode configuration with an Autolab PGSTAT100 potentiostat (Metrohm-Autolab). iR compensation was applied for the electrochemical measurements. Homemade Ag/AgCl reference electrodes (RE) were directly immersed in the chloride-containing aqueous phase, an aqueous solution of 0.1 mM LiCl and 1 mM BTPPACl was brought in contact with the organic solution via a micropipette and formed a liquid junction for the organic reference electrode. The micropipette was prepared from a borosilicate capillary (o.d. 1.5 mm, i.d. 1.1 mm), using a micropipette puller (Sutter P-97 Flaming/Brown). The average internal diameter of the micropipette tip was estimated to be 2–3 μm. The aqueous counter electrode (CEw) was glass coated to avoid contact of the Pt with the organic (upper) phase (all metals were obtained from Advent Research Materials). The cells used for the liquid/liquid electrochemical measurements at the organic/water interface, had a working area in the range 0.74–0.83 cm2 and a total solution volume of 2.5 mL. The errors presented are either standard deviations (arithmetic averages of multiple measured values) or absolute errors determined from the best fit errors.Results and discussion
Polarised interfaces between the water and the novel lower density organic solvents
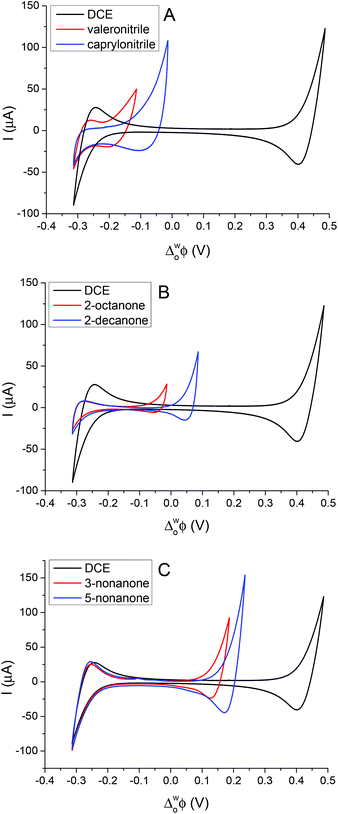
Cheng et al. first reported a reverse cell configuration to study the 2-heptanone/water and 2-octanone/water interfaces.29 In the present study, six less dense (relative to water) organic solvents were investigated to find the widest potential window resulting on polarisation of the interface. All of these organic solvents are relatively low cost, colourless liquids and are not classified as carcinogenic agents. Fig. 1 shows the cyclic voltammograms (CV) of the supporting electrolyte at the aqueous/organic solvent interfaces compared to the DCE/water interface (cell 1, Scheme 1). The potential windows of the CVs (Fig. 1) are limited by the transfer of Li+ and TPBCl− on the positive side and by Cl− and BTPPA+ at the negative potential differences.6,28 In the case of nitriles (Fig. 1A) the potential window is 200 mV and 300 mV for valeronitrile and caprylonitrile, respectively, and the background current is around 20–40 μA, which is higher than in the case of the DCE/water interface, while in the case of 2-octanone and 2-decanone the polarisation range was found to be 300 mV and 400 mV (Fig. 1B). Wider potential windows and lower background currents were observed for the 3- or 5- substituted ketones: 500 mV for 3-nonanone and 550 mV for the 5-nonanone (Fig. 1C).By comparing the mutual solubility values of the organic solvents and water,36 1–5 g L−1 (22.5 °C) for valeronitrile, “partial” solubility for caprylonitrile, and 0.4 g L−1 (25 °C) for 3-nonanone were found, while the 2-octanone, 2-decanone and the 5-nonanone are quoted to be “insoluble” with water. Based on the DCE solubility in water (8.7 g L−1 at 20 °C), a two-phase shake flask (separator) was used “to wash” the organic solvents with water (and left to separate for 24 h), although no significant difference in the electrochemical response was observed. This potential window for the 5-nonanone/water interface was deemed suitable for further charge transfer studies (IT and ET).
Simple ion transfers at 5-nonanone/water interface
The simple IT using quaternary ammonium salts, TBA+, TPrA+ and TPAs+, ClO4−, at the 5-nonanone/water interface is shown in Fig. 2 (2nd cell, Scheme 1, where the X indicates the transferring ion).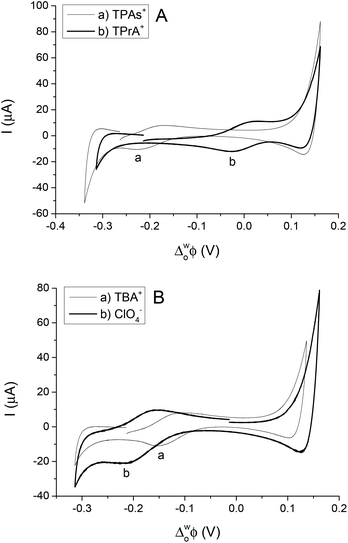 | ||
| Fig. 2 Cyclic voltammograms of transfer of TPAs+, TPrA+ (A) and TBA+, ClO4− (B) across the water/5-nonanone interface (at scan rates of 10 mV s−1). | ||
In order to calibrate the whole potential window and the half-wave potential (ΔwoΦ1/2) scale, the tetraphenylarsonium tetraphenylborate (TATB) extra thermodynamic assumption was used.28–30,37 The standard Gibbs energy of partition of tetraphenylarsonium tetraphenylborate (TPAsTPB) can be split into two equal parts for the cation and the anion, as the radii of both ions are very similar, so the Gibbs energy of the TPAs+ transfer is equated with the Gibbs energy of the TPB− transfer from aqueous to 5-nonanone.28 The resultant potential window of the 5-nonanone/water interface did not extend to sufficiently positive potential differences to observe the TPB− transfer, so the TPAs+ transfer was used for the potential calibration, the zero of the ΔwoΦ1/2 scale is assumed to be located in the middle of the half-wave potentials of the TPAs+ ion (Fig. 2A).28 TPrA+ was also added to the aqueous phase in order to determine its ΔwoΦ1/2, and used as a secondary reference ion in the voltammograms recorded at the 5-nonanone/water interface. Fig. 2A shows the CVs obtained for the transfer of TPAs+, TPrA+ and Fig. 2B represents transfer of TBA+, ClO4− from water to 5-nonanone.
Eqn (1) was used to calculate the standard potentials (ΔwoΦ°) at the 5-nonanone/water interface from the half-wave potential values, ΔwoΦ1/2, which were obtained experimentally.8,22,28–30
 | (1) |
 ln
ln  was estimated to be ±3.5 mV for univalent ions. The ΔwoΦ° is related to the standard Gibbs energy of the transfer (ΔG°,w→otr) from aqueous phase to 5-nonanone solvent through eqn (2). The calculations are summarised in Table 1. The determined ΔG°,w→otr values are compared with reported ΔG°,w→otr values for IT at water/2-heptanone and water/2-octanone interfaces.29
| ΔG°,w→otr = zFΔwoΦ° | (2) |
| Ion | ΔwoΦ1/2 (V) | ΔwoΦ° (V) | ΔG°,w→otr (kJ mol−1) | ΔG°,w→o![[thin space (1/6-em)]](https://www.rsc.org/images/entities/char_2009.gif) tr29 (kJ mol−1) tr29 (kJ mol−1) |
|
|---|---|---|---|---|---|
| TPAs+ | −0.200 | −0.196 | −19.00 | N/A | N/A |
| ClO4− | −0.184 | −0.187 | +18.09 | 10.9 | 9.2 |
| TBA+ | −0.103 | −0.099 | −9.644 | −16.9 | −13.0 |
| TPrA+ | −0.013 | −0.016 | −1.596 | −4.9 | −1.0 |
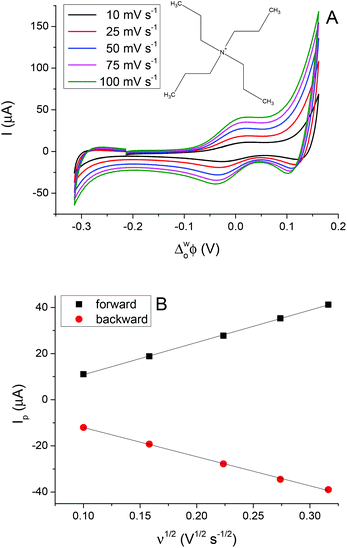
The peak separation (ΔwoΦp) obtained was in the range of 55 to 64 mV, close to the theoretical value of 59 mV for a singly charged reversible IT process. The peak current (Ip) is linearly dependent on the square root of the potential scan rate (ν1/2) when tested between 10 mV s−1 and 100 mV s−1 (2nd cell, Scheme 1), implying that the process is controlled by diffusion.
Fig. 3A shows the CVs obtained for the transfer of TPrA+ from water to 5-nonanone. The forward and backward peak current, plotted versus the square root of the scan rate, is shown in Fig. 3B and is consistent with the trend predicted with the Randles–Sevčik eqn (3):19
 | (3) |
| Ion | ΔwoΦp (mV) | 106Dw (cm2 s−1) |
|---|---|---|
| TPAs+ | 57 | 6.06 (±0.02) |
| ClO4− | 64 | 19.6 (±0.09) |
| TBA+ | 55 | 11.2 (±0.07) |
| TPrA+ | 57 | 7.75 (±0.01) |
Electron transfer at 5-nonanone/water interface
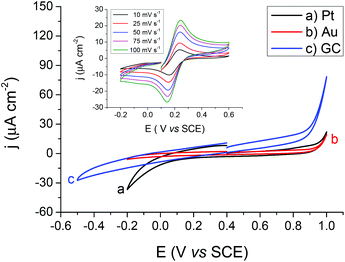
The 5-nonanone molecule has been made, or used as a reagent, in electrochemical processes previously, e.g. in studies of the electrolysis of dialkyl ketones in methanol using a sodium halide–sodium hydroxide system to prepare α,β-unsaturated carboxylic esters38 or in an electrochemical deoxygenation reaction of diphenylphosphinates, in this case the products included dialkyl ketones,39 but to the best of our knowledge it has not been reported previously as an electrochemical solvent. For this reason, cyclic voltammetric measurements were performed using 5-nonanone as the solvent to establish its suitability in conventional electrochemistry. A three-electrode configuration was applied, using platinum (Pt), gold (Au) and glassy carbon (GC) disc electrodes as working electrodes against saturated calomel electrode (SCE), while the counter electrode was Pt gauze. Blank voltammograms, i.e. measurement with the organic solution containing only 10 mM BTPPATPBCl were recorded (Fig. 4), providing different potential windows without further electrochemical process as a function of the electrode materials shows no significant electrode reaction in the range of the TCNQ reduction and TCNQ− anion oxidation (between +0.142 V and +0.243 V vs. SCE).In order to determine the diffusion coefficient of the TCNQ, several cyclic voltammetric measurements were performed on the Au disc electrode (Fig. 4 inset). The absolute current value of the “blank” on the Au electrode (Fig. 4b) is negligible in comparison to the potential range of the TCNQ reduction and oxidation peaks (Fig. 4 inset). The inset of Fig. 4 provides an overview of the voltammetric data recorded with 200 μM TCNQ and 10 mM BTPPATPBCl electrolyte in 5-nonanone at scan rates in the range 10 to 100 mV s−1. The diffusion coefficient calculated according to the Randles–Sevčik equation (eqn (3)), from the slope of the linear fitting of the reduction peak current versus the scare root of scan rate, was 1.70 × 10⁻⁵ cm2 s−1, with a standard deviation 5.10 × 10⁻⁷ cm2 s−1, which is consistent with values in the literature, reported using either cyclic voltammetry or with SECM techniques.40 Also, the reduction/oxidation peaks were symmetrical and peak currents were similar in magnitude, proving that no competing processes occur.
Given that the 5-nonanone/water interface has been identified as a good candidate for interfacial IT, this interface was also investigated in an ET study at the ITIES by adding organic and aqueous redox couples to each phase. When the bis(cyclopentadienyl)iron derivatives, such as ferrocene (Fc) and 1,1-dimethylferrocene (DMFc) were tried in the 5-nonanone and the ferri/ferrocyanide redox couple used in the water, no charge transfer was observed. The explanation could be found in the differences between the standard electrode potentials of ferrocene–ferrocenium (E° = 0.348 V) and the highest available potential (ΔwoΦ ≈ +0.2 V) of our 5-nonanone/water interface.41 So, TCNQ reduction10–13,15,40 was studied in the 5-nonanone phase with the ferri/ferrocyanide couple in the aqueous solvent, according to reaction (4).
| TCNQ(o) + Fe(CN)64−(w) = TCNQ−(o) + Fe(CN)63−(w) | (4) |
Several concentrations of TCNQ and different ratios of ferri/ferrocyanide were applied to study the ET at the interface.10,12,13 The concentration of the TCNQ was much lower than either the ferricyanide (Fe(CN)63−) or ferrocyanide (Fe(CN)64−) in each case, so the diffusion limited process is the reduction of the TCNQ to TCNQ− anion.12 The diagrams of the cell configurations are shown in Scheme 2, and the compositions of the different cells are given in Scheme 1.
 | ||
| Scheme 2 Diagrams of the cells for the ET studies. (A) The organic blank for cell 3, (B) the aqueous blank for cell 4, (C) both redox species in the aqueous and organic phases for cell 5. | ||
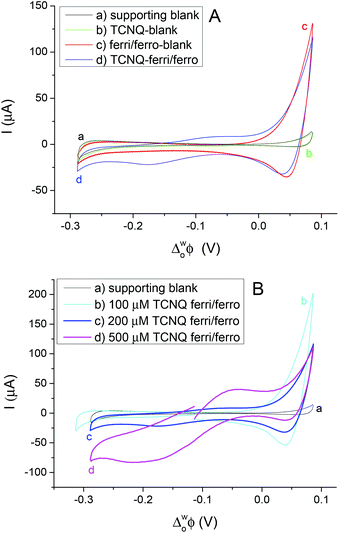
Different cell compositions were used to clarify the interfacial ET between the organic and aqueous redox species and to exclude the IT of the reduced product, TCNQ−, at the 5-nonanone/water interface. In the case of either the supporting blank (Fig. 5Aa for cell 1) or the TCNQ blank (Fig. 5Ab for cell 3, diagram A), no significant difference or redox peak signal can be seen, as one would expect in a “blank” experiment because no ions or electrons are being transferred across the interface. Only the ion transfers of the supporting electrolytes are seen (the current rise seen at both ends), the potential window in the middle was found to be around 500 mV. The ferri/ferro blank scan (aqueous blank, cell 4, diagram B) can be seen in Fig. 5Ac: comparing the one with both redox species added to the organic and aqueous phases, the TCNQ-ferri/ferro scan (Fig. 5Ad, cell 5, diagram C), the TCNQ concentration was 200 μM in the 5-nonanone, while the ferricyanide and ferrocyanide concentrations were 0.1 M and 0.01 M, respectively in the water. The positive end current is higher for the ferri/ferro blank (c) and when the redox species were present (d), as K+ transfer occurs at less positive potentials than the Li+ transfer.5 Neither IT nor ET are observed in the supporting blank (a), organic (b) and aqueous blank (c), although the expected ET across the 5-nonanone/water interface is observed in the case of (d), between −160 mV and −65 mV (ΔwoΦp = 95 mV).
The concentration of either the TCNQ or the ferri/ferrocyanide redox couple was varied to exclude the IT of TCNQ− anion and to find the ferro/ferricyanide ratio which provides reversible processes at the interface.10,12,13Fig. 5B shows the CVs at the 5-nonanone/water interface for cell 1 (a) and for cell 5 (b, c, d), with 100 μM (b), or 200 μM (c), 500 μM (d) TCNQ concentration in 5-nonanone and aqueous ferricyanide and ferrocyanide concentrations of 0.1 M and 0.01 M, respectively at 50 mV s−1 scan rate. No significant differences can be seen between the supporting blank (a) and the 100 μM TCNQ case (b). The ΔwoΦp value for 200 μM TCNQ is 95 mV and for 500 μM TCNQ ΔwoΦp = 175 mV, so both show an apparently quasi-reversible process,12,13,19 although in the case of the more concentrated one, the bigger peak separation is likely to reflect the influence of uncompensated resistance.
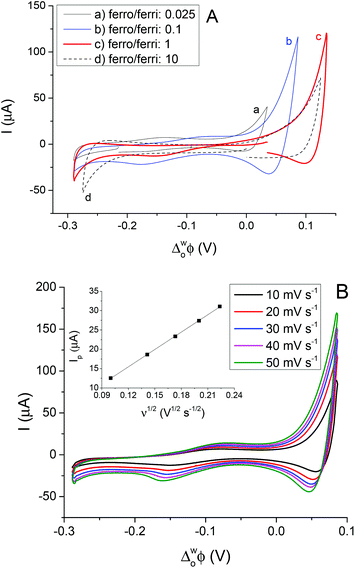
The CVs for interfacial ET to different ratios of the aqueous redox couple at constant (200 μM) TCNQ in the 5-nonanone phase are given in Fig. 6A. The ferro/ferricyanide ratios were adjusted to: 0.025 (0.01 M Fe(CN)64− and 0.4 M Fe(CN)63−), 0.1 (0.01 M Fe(CN)64− and 0.1 M Fe(CN)63−), 1 (0.02 M Fe(CN)64− and 0.02 M Fe(CN)63−) and 10 (0.1 M Fe(CN)64− and 0.01 M Fe(CN)63−). The most reversible ET process between TCNQ and ferrocyanide, reported elsewhere, was when the ferrocyanide/ferricyanide ratio was 40.10,12,13 Surprisingly, opposite behaviour was obtained here at the 5-nonanone/water interface, in comparison to literature reports at the DCE/water interface, as the largest redox activity is shown in the case of the higher concentration of the ferricyanide (a, b) rather than ferrocyanide (d) where the ferrocyanide/ferricyanide ratio is 10, though when the amounts of the aqueous redox species are equal (c), only a small reduction can be seen.
In order to determine the diffusion coefficient of TCNQ from its interfacial reduction, cyclic voltammetric measurements were performed at the 5-nonanone/water interface (cell 5 and diagram C). Fig. 6B provides an overview of the voltammetric curves recorded with 200 μM TCNQ in 5-nonanone and 0.1 M Fe(CN)63−and 0.01 M Fe(CN)64− in water at scan rates in the range 10 to 50 mV s−1. The ΔwoΦp values between 10 and 50 mV s−1 vary in the range of 72 to 95 mV, suggesting quasi-reversible behaviour.12,13 The reduction peak current plotted versus the square root of the scan rate is shown in the inset (Fig. 6B) and is consistent with the trend predicted with the Randles–Sevčik equation (eqn (3)). The diffusion coefficient calculated from the slope of the linear fitting of the scatter plot in the inset of Fig. 6B, was 1.38 × 10⁻⁵ cm2 s−1, with a standard deviation 2.77 × 10⁻⁷ cm2 s−1, which is reasonably consistent with the values in the literature,10,40 reported using either the four-electrode classical liquid/liquid electrochemistry approach10 or in with SECM techniques.40
Conclusions
The study of the charge transfer through a polarised interface between water and lower density organic solvents (valeronitrile, caprylonitrile, 2-octanone, 2-decanone, 3-nonanone, 5-nonanone) has shown that the widest potential window (∼600 mV) could be observed in the case of 5-nonanone/water interface. Several simple ion transfers were carried out at the 5-nonanone/water interface, namely those of the tetraphenylarsonium, tetraalkylammonium cations and perchlorate anion. The observed results were used to calculate the diffusion coefficients of the ion on transfer from the aqueous to organic phase. The standard Gibbs energy values were obtained for ion transfers and these are comparable with the previously reported Gibbs energies of 2-heptanone/water or 2-octanone/water interfaces.29The 5-nonanone organic phase has been shown to be a stable solvent for use in electrochemistry, using cyclic voltammetry measurements employing the BTPPATPBCl electrolyte and the TCNQ redox couple.
The possibility of interfacial electron transfer in a reverse liquid/liquid cell configuration is exemplified with the case of TCNQ reduction to the TCNQ− anion in the organic (5-nonanone) phase, and the simultaneous ferrocyanide oxidation to ferricyanide in the aqueous solution.
5-nonanone is advocated as a good candidate for studying charge transfer (both IT and ET), at the organic/water interface, without toxicity, at reasonable cost and offering a larger potential window than in the case of the more widely studied 2-heptanone or 2-octanone, so opening up further practical applications for liquid/liquid electrochemistry in electroanalysis.
Acknowledgements
The authors thank the U.K. EPSRC (EP/K007033/1) for financial support and Ms Keeley Tomkinson for performing preliminary experiments.Notes and references
- P. Peljo and H. H. Girault, in Encyclopedia of Analytical Chemistry, ed. R. A. Meyers, John Wiley & Sons, 2012 Search PubMed.
- Z. Samec, Electrochim. Acta, 2012, 84, 21–28 CrossRef CAS PubMed.
- P. Vanysek and L. B. Ramirez, J. Chil. Chem. Soc., 2008, 53, 1455–1463 CAS.
- Z. Samec, Pure Appl. Chem., 2004, 76, 2147–2180 CrossRef CAS.
- A. Sabela, V. Marecek, Z. Samec and R. Fuoco, Electrochim. Acta, 1992, 37, 231–235 CrossRef CAS.
- Z. Samec, V. Marecek, J. Kortya and M. W. Khalil, J. Electroanal. Chem., 1977, 83, 393–397 CrossRef CAS.
- Z. Samek, V. Marecek and J. Weber, J. Electroanal. Chem., 1979, 100, 841–852 CrossRef.
- T. Wandlowski, V. Marecek and Z. Samec, Electrochim. Acta, 1990, 35, 1173–1175 CrossRef CAS.
- M. H. Abraham and A. F. D. Namor, J. Chem. Soc., Faraday Trans. 1, 1976, 76, 955–962 RSC.
- Z. Ding, D. J. Fermin, P. F. Brevet and H. H. Girault, J. Electroanal. Chem., 1998, 458, 139–148 CrossRef CAS.
- Z. Ding, B. M. Quinn and A. J. Bard, J. Phys. Chem. B, 2001, 105, 6367–6374 CrossRef CAS.
- B. Quinn and K. Kontturi, J. Electroanal. Chem., 2000, 483, 124–134 CrossRef CAS.
- B. Quinn, R. Lahtinen, L. Murtomaki and K. Kontturi, Electrochim. Acta, 1998, 44, 47–57 CrossRef CAS.
- Z. Samec, J. Langmaier and T. Kakiuchi, Pure Appl. Chem., 2009, 81, 1473–1488 CrossRef CAS.
- T. Solomon and A. J. Bard, J. Phys. Chem., 1995, 99, 17487–17489 CrossRef CAS.
- M. Velicky, K. Y. Tam and R. A. W. Dryfe, Anal. Chem., 2014, 86, 435–442 CrossRef CAS PubMed.
- A. Sherburn, M. Platt, D. W. M. Arrigan, N. M. Boag and R. A. W. Dryfe, Analyst, 2003, 128, 1187–1192 RSC.
- J. Strutwolf, M. D. Scanlon and D. W. M. Arrigan, Analyst, 2009, 134, 148–158 RSC.
- A. J. Bard and L. R. Faulkner, Electrochemical Methods, Fundamentals and Applications, John Wiley & Sons, New York, 2nd edn, 2001 Search PubMed.
- G. Luo, S. Malkova, S. V. Pingali, D. G. Schultz, B. Lin, M. Meron, T. J. Graber, J. Gebhardt, P. Vanysek and M. L. Schlossman, Faraday Discuss., 2005, 129, 23 RSC.
- T. Solomon, H. Alemu and B. Hundhammer, J. Electroanal. Chem., 1984, 169, 311–314 CrossRef CAS.
- M. A. Rahman and H. Doe, J. Electroanal. Chem., 1997, 424, 159–164 CrossRef CAS.
- T. Solomon, H. Alemu and B. Hundhammer, J. Electroanal. Chem., 1984, 169, 303–309 CrossRef CAS.
- B. Hundhammer, C. Muller, T. Solomon, H. Alemu and H. Hassen, J. Electroanal. Chem., 1991, 319, 125–135 CrossRef CAS.
- H. Katano, H. Tatsumi and M. Senda, Talanta, 2004, 63, 185–193 CrossRef CAS PubMed.
- Z. S. Sun and E. K. Wang, Electroanalysis, 1989, 1, 507–515 CrossRef CAS.
- J. Zhang and A. M. Bond, Analyst, 2005, 130, 1132–1147 RSC.
- A. J. Olaya, P. Ge and H. H. Girault, Electrochem. Commun., 2012, 19, 101–104 CrossRef CAS PubMed.
- Y. Cheng and D. J. Schiffrin, J. Electroanal. Chem., 1996, 409, 9–14 CrossRef.
- Y. Cheng and D. J. Schiffrin, J. Electroanal. Chem., 1997, 429, 37–45 CrossRef CAS.
- P. A. Fernandes, M. N. D. S. Cordeiro and J. A. N. F. Gomes, J. Phys. Chem. B, 1999, 103, 8930 CrossRef CAS.
- P. A. Fernandes, M. N. D. S. Cordeiro and J. A. N. F. Gomes, J. Phys. Chem. B, 2000, 104, 2278–2286 CrossRef CAS.
- G. Luo, S. Malkova, S. V. Pingali, D. G. Schultz, B. Lin, M. Meron, T. J. Graber, J. Gebhardt, P. Vanysek and M. L. Schlossman, Electrochem. Commun., 2005, 7, 627–630 CrossRef CAS PubMed.
- Y. Shao, M. V. Mirkin and J. F. Rusling, J. Phys. Chem. B, 1997, 101, 3202–3208 CrossRef CAS.
- 5-nonanone MSDS, Sigma-Alrdich Co. Ltd., http://www.sigmaaldrich.com/MSDS/.
- R. M. Stephenson, J. Chem. Eng. Data, 1992, 37, 80–95 CrossRef CAS.
- S. Wilke and T. Zerihun, J. Electroanal. Chem., 2001, 515, 52–60 CrossRef CAS.
- M. N. Elinson, S. K. Feducovich, T. A. Zaimovskaya, A. S. Dorofeev, A. N. Vereshchagin and G. I. Nikishin, Russ. Chem. Bull., 2003, 52, 998–1002 CrossRef CAS.
- K. Lam and I. n. E. Markó, Org. Lett., 2010, 13, 406–409 CrossRef PubMed.
- C. B. Ekanayake, M. B. Wijesinghe and C. G. Zoski, Anal. Chem., 2013, 85, 4022–4029 CrossRef CAS PubMed.
- I. M. Kolthoff and F. G. Thomas, J. Phys. Chem., 1965, 69, 3049–3058 CrossRef CAS.
| This journal is © The Royal Society of Chemistry 2015 |

